Attention-deficit hyperactivity disorder (ADHD) is a common, chronic, and impairing disorder characterized in the official Diagnostic and Statistical Manual of Mental Disorders (DSM) scheme by age-inappropriate levels of inattention and/or hyperactivity–impulsivity (APA, 2013). Yet presentations of ADHD and clinical course are highly heterogeneous. Whereas some children with ADHD show a seemingly full remittance of symptoms by adolescence or early adulthood, many, if not most, continue to experience clinically impairing ADHD symptoms (Biederman, Petty, Clarke, Lomedico, & Faraone, Reference Biederman, Petty, Clarke, Lomedico and Faraone2011; Sibley et al., Reference Sibley, Pelham, Molina, Gnagy, Waschbusch, Garefino and Karch2012; Willoughby, Reference Willoughby2003). ADHD is also a risk factor for a range of serious subsequent complications. It appears very early in development and conveys 50% to 300% increased risk for problems across the life span ranging from depression to conduct problems to substance use and even shortened life span (Bussing, Mason, Bell, Porter, & Garvan, Reference Bussing, Mason, Bell, Porter and Garvan2010; Erskine et al., Reference Erskine, Norman, Ferrari, Chan, Copeland, Whiteford and Scott2016; Franke et al., Reference Franke, Michelini, Asherson, Banaschewski, Bilbow, Buitelaar and Haavik2018; Groenman, Janssen, & Oosterlaan, Reference Groenman, Janssen and Oosterlaan2017; Kessler et al., Reference Kessler, Adler, Berglund, Green, McLaughlin, Fayyad and Zaslavsky2014, Reference Kessler, Adler, Barkley, Biederman, Conners, Demler and Secnik2006; Lee, Humphreys, Flory, Liu, & Glass, Reference Lee, Humphreys, Flory, Liu and Glass2011).
Despite substantial research efforts, both (a) the secondary co-occurrence of ADHD and complicating additional clinical problems and (b) the developmental pathways leading toward or away from recovery through adolescence remain poorly understood. One possibility is that the core symptoms domains of ADHD – inattention and hyperactivity–impulsivity – are early emerging risk features that directly convey risk for later problems. Alternatively, ADHD symptoms may operate via indirect influences – inattention contributing to academic failure that in turn increases risk for depression and conduct problems. A third possibility is that features outside of traditional symptom domains, such as weaknesses in executive functioning (EF) or anger regulation, may convey transdiagnostic risk for multiple problem domains including both ADHD and co-occurring symptoms of disruptive behavior disorders and depression (Beauchaine & Tackett, Reference Beauchaine and Tackett2020; Macdonald, Goines, Novacek, & Walker, Reference Macdonald, Goines, Novacek and Walker2016; McTeague, Goodkind, & Etkin, Reference McTeague, Goodkind and Etkin2016). Resolving these (nonmutually exclusive) hypotheses requires accounting for transactional influences of a large number of features across development. Here, we apply a longitudinal network model to a theoretically justified set of diagnostic and transdiagnostic features spanning DSM symptoms, trait-based ratings of emotional functioning (temperament), and performance-based measures of cognition (executive function) to address how ADHD and co-occurring problems unfold over time.
Network perspective on problem co-occurrence
Historically, categorical, DSM-oriented perspectives have suggested that symptoms of ADHD (and other disorders) arise from latent disease entities that cause sets of symptoms (Kendler, Reference Kendler2009; McNally, Reference McNally2020). Co-occurring problems in this framework are viewed as “comorbid” because of the implication that they arise from distinct, independent disease entities. This Kraepelinian framework and the related DSM perspective has of course received ample challenge (Kendler & Engstrom, Reference Kendler and Engstrom2018; Wakefield, Reference Wakefield2016). Symptoms and disorders cluster hierarchically into a fairly constrained number of domains (Achenbach, Reference Achenbach1966, Reference Achenbach2020; Caspi et al., Reference Caspi, Houts, Belsky, Goldman-Mellor, Harrington, Israel and Poulton2014; Lahey et al., Reference Lahey, Rathouz, Van Hulle, Urbano, Krueger, Applegate and Waldman2008; Olino et al., Reference Olino, Bufferd, Dougherty, Dyson, Carlson and Klein2018; Smith, Atkinson, Davis, Riley, & Oltmanns, Reference Smith, Atkinson, Davis, Riley and Oltmanns2020). Similar symptoms also appear as indicators of multiple disorders – for example, concentration problems appear as a symptom in both ADHD and depression (and other disorders as well). Unsurprisingly, comorbidity is the rule rather than the exception.
In ADHD, as many as 60% of children experience a co-occurring condition across the life span, with ADHD frequently the first condition to emerge (Kessler et al., Reference Kessler, Adler, Barkley, Biederman, Conners, Demler and Secnik2006a). Because ADHD diagnosis often precedes full onset of other conditions, it is often viewed as a liability for secondary psychopathology (Kessler et al., Reference Kessler, Adler, Barkley, Biederman, Conners, Demler and Secnik2006a). Evidence suggests it does in fact serve as a causal step toward both depression (Riglin et al., Reference Riglin, Leppert, Dardani, Thapar, Rice, O'Donovan and Thapar2020; Stern et al., Reference Stern, Agnew-Blais, Danese, Fisher, Matthews, Polanczyk and Arseneault2020) and conduct disorder (Beauchaine, Hinshaw, & Pang, Reference Beauchaine, Hinshaw and Pang2010). However, the specific pathways by which this risk is conveyed remain unclear.
One conceptualization, popularized over the last decade, comes from network theory (Borsboom & Cramer, Reference Borsboom and Cramer2013; Fried et al., Reference Fried, van Borkulo, Cramer, Boschloo, Schoevers and Borsboom2017; McNally, Reference McNally2016, Reference McNally2020). From a network perspective, changes in symptoms across time result from patterns of co-activation among the symptoms themselves. For example, inattention or hyperactivity–impulsivity may activate sleep problems, which in turn activates other symptoms of depression, leading to their commonly observed co-occurrence. The dynamics of the symptoms themselves constitutes the mechanisms of disorder co-occurrence.
Statistically, these hypotheses are tested via a partial correlation network model in which nodes (which correspond to variables) are connected by edges that reflect the partial correlation between two variables controlling for all other variables in the model. For example, if ADHD symptom domains “activate” (or cause) features of depression (or other co-occurring problems), this would be reflected in edges that directly connect these nodes in the network. Alternatively, connections may be indirect. For example, ADHD may activate oppositional defiant behaviors that in turn activate depression symptoms, which would be reflected in short overall path lengths from ADHD to depression but only via indirect paths. Thus, network approaches offer an analytical tool for understanding the unique direct and indirect associations between large sets of interrelated features. They are ideal for testing hypotheses about how specific features characterizing one disorder, such as inattention and hyperactivity–impulsivity, are related to multiple other domains of psychopathology. Figure 1 conceptually depicts some of the common metrics used to assess longitudinal network structure. Figure 2 depicts hypothetical examples of how different relationships between ADHD, oppositional defiant disorder (ODD), and depression would appear in a network analysis.
Shows how longitudinal associations are captured in a network framework. Panel 1 depicts hypothetical edges between three variables (A, B, C) measured at two time points. Variable A has outgoing edges to itself (the autoregressive path), B, and C. Outgoing strength for A is equal to the sum of the edge weights from A1 to B2 and A1 to C2. Variable A has incoming edges from itself (autoregressive path) and B. The incoming strength for A is equal to the edge weight from B1 to A2. In models used here, the autoregressive path is omitted when computing outgoing and incoming strength. Variable A has high closeness centrality. It has direct connections (short paths) to all other nodes. Variables B and C would have lower closeness centrality because they require longer paths to get to some other nodes. For example, variable B has a direct connection to A but an indirect connection to C (i.e., that path requires two edges: B1 to A2, A1 to C2). Panel 2 highlights the edges contributing to the indirect path from B to C using dotted lines. Edge weight also plays a role in determining path length with stronger associations resulting in shorter paths. In conventional representation of longitudinal networks, the multiple measurement occasions are not explicitly shown. Instead, outgoing and incoming paths are represented as directional arrows. In panel 3, solid arrows contribute to A's outgoing strength (A1 to B2 and A1 to C2) and dotted lines to its incoming strength (B1 to A2 and C1 to A2). Note that for B and C, solid lines would contribute to incoming strength and dotted lines to outgoing strength.

Provides a hypothetical example of the network conceptualization of problem co-occurrence using fifth edition of Diagnostic and Statistical Manual of Mental Disorders (DSM-5) diagnoses. In panel 1, attention-deficit/hyperactivity disorder (ADHD) has a direct outgoing edge to oppositional defiant disorder (ODD). ADHD predicts developing ODD symptoms over time. ODD and depression have direct, bidirectional edges, they each contribute to each other over time, potentially suggesting linked co-expression of these symptoms. In contrast, ADHD and depression influence each other only indirectly via their associations with ODD. In this example, ODD has the highest closeness centrality because of short paths (direct connections) to all other features. In panel 2, an additional direct connection exists between ADHD and depression (dotted line), indicating that ADHD independently predicts both ODD and depression, suggesting ADHD plays a direct causal role in developing depression. Here, both ADHD and ODD would have high closeness centrality, while depression would have lower closeness centrality because its only direct connection is to ODD.

DSM symptom networks
The majority of network studies of psychopathology to-date have focused on relationships among DSM symptoms, either within or between disorders (Contreras, Nieto, Valiente, Espinosa, & Vazquez, Reference Contreras, Nieto, Valiente, Espinosa and Vazquez2019; Robinaugh, Hoekstra, Toner, & Borsboom, Reference Robinaugh, Hoekstra, Toner and Borsboom2020). The observed symptom networks are often densely connected with many edges between nodes. Unsurprisingly (Achenbach, Reference Achenbach1966, Reference Achenbach2020), symptoms tend to cluster broadly into internalizing, externalizing, and attention problems domains in networks based on both youth self-report (Boschloo, Schoevers, van Borkulo, Borsboom, & Oldehinkel, Reference Boschloo, Schoevers, van Borkulo, Borsboom and Oldehinkel2016; Funkhouser, Chacko, Correa, Kaiser, & Shankman, Reference Funkhouser, Chacko, Correa, Kaiser and Shankman2020) and parent-report symptom ratings (McElroy, Shevlin, Murphy, & McBride, Reference McElroy, Shevlin, Murphy and McBride2018; Rouquette et al., Reference Rouquette, Pingault, Fried, Orri, Falissard, Kossakowski and Borsboom2018). Studies also consistently find moderate to strong connections between symptoms in different domains (Contreras et al., Reference Contreras, Nieto, Valiente, Espinosa and Vazquez2019). Of particular interest for ADHD, studies of both child- and parent-reported symptom network configuration in middle childhood identify inattention, specifically, as a central feature with strong, direct connections to other internalizing and externalizing features (Boschloo et al., Reference Boschloo, Schoevers, van Borkulo, Borsboom and Oldehinkel2016; Funkhouser et al., Reference Funkhouser, Chacko, Correa, Kaiser and Shankman2020; Rouquette et al., Reference Rouquette, Pingault, Fried, Orri, Falissard, Kossakowski and Borsboom2018). However, other studies in early to middle childhood using maternal report of symptoms have placed other domains more central in the psychopathology network (McElroy et al., Reference McElroy, Shevlin, Murphy and McBride2018).
In a cross-sectional network (one in which all features in the network are measured at the same time) the edges are undirected (for review see McNally, Reference McNally2020). Thus, cross-sectional studies may identify inattention as a central feature but cannot clarify whether inattention exerts influence on other symptoms or if other symptoms exert influence on inattention. From a developmental perspective, the difference between these interpretations is critical. Further, cross-sectional networks rely on between-person associations that may or may not accurately reflect the within-person covariation of features (McNally, Reference McNally2020). A longitudinal design can address both limitations.
The recently developed cross-lagged panel network model (CLPN) combines a network approach with a traditional cross-lagged model (Funkhouser et al., Reference Funkhouser, Chacko, Correa, Kaiser and Shankman2020; Rhemtulla, van Bork, & Cramer, Reference Rhemtulla, van Bork and Cramer2020). Estimates for both incoming and outgoing edges can be estimated controlling for all other incoming or outgoing paths, including autoregressive effects, thus isolating the direction of influence and clarifying the causal structure relating the features over time. Using this approach, recent longitudinal studies in community-based samples in middle childhood suggest inattention causally influences the development of other internalizing and externalizing symptoms across time based on both parent- and child-report (Funkhouser et al., Reference Funkhouser, Chacko, Correa, Kaiser and Shankman2020; Rouquette et al., Reference Rouquette, Pingault, Fried, Orri, Falissard, Kossakowski and Borsboom2018). However, it is unclear if this pattern holds for clinical range problems. Additional studies in clinical populations can clarify whether causal structure varies based on the range of symptom severity present in the sample (Hoffman et al., Reference Hoffman, Steinley, Trull, Lane, Wood and Sher2019).
Incorporating the benefits of the RDoC perspective
Important explanatory power can also arise from inclusion of other domains related to psychological dimensions. National Institute of Health (NIH)'s Research Domain Criteria (RDoC) initiative is one example of efforts to re-conceptualize psychopathology via the study of dimensionally measured psychological or biological features that extend beyond traditional DSM symptom domains (Cuthbert & Insel, Reference Cuthbert and Insel2010; Insel et al., Reference Insel, Cuthbert, Garvey, Heinssen, Pine, Quinn and Wang2010) and may cut across traditional disorder categories. For example, although they are not part of formal diagnostic criteria, differences in emotion regulation and executive function are commonly observed in both ADHD and other disorders, suggesting they may be transdiagnostic risk factors that influence multiple forms of psychopathology. Thus, the co-occurrence of ADHD with factors such as disruptive behavior disorders and depression may not reflect a direct influence of ADHD symptoms on other symptoms but instead implicate transdiagnostic risk factors that convey shared risk for multiple disorders. In a network model, this would be reflected in direct pathways from these transdiagnostic features to multiple psychopathology domains with few or no connections directly between the disorder symptoms themselves. Longitudinal network approaches offer an ideal analytic tool to test this possibility but have not yet been applied in studies of developmental psychopathology, despite calls for studies that address multilevel, multimodal conceptualizations of disorder (Beauchaine & Hinshaw, Reference Beauchaine and Hinshaw2020; Thomas & Sharp, Reference Thomas and Sharp2019) and incorporate developmental perspectives into RDoC (Mittal & Wakschlag, Reference Mittal and Wakschlag2017).
Emotional functioning
Within ADHD, expansion to domains outside of the core symptoms has proven fruitful for describing the heterogeneous developmental pathways observed within the disorder. One expansion has included use of trait-based measures of emotional functioning operationalized from a temperament perspective (Bates, Goodnight, & Fite, Reference Bates, Goodnight, Fite, Lewis, Haviland-Jones and Barrett2008; Clark, Reference Clark2005; Rothbart & Ahadi, Reference Rothbart and Ahadi1994). Domains of temperament functioning align with the positive and negative valence system domains of RDoC, and provide an optimal trait-based assessment that may be complementary to state-based assessments of RDoC constructs (Patrick & Hajcak, Reference Patrick and Hajcak2016). A major benefit, from an RDoC perspective, is that temperament traits are measured via standard, easily obtained self-report but are hypothesized to be related to neurobiological features that can be studied at other levels of analysis as well (Whittle et al., Reference Whittle, Yücel, Fornito, Barrett, Wood, Lubman and Allen2008; Whittle, Allen, Lubman, & Yücel, Reference Whittle, Allen, Lubman and Yücel2006).
Work in young children (Martel, Reference Martel2016), school-age children (Karalunas et al., Reference Karalunas, Fair, Musser, Aykes, Iyer and Nigg2014; Karalunas, Gustafsson, Fair, Musser, & Nigg, Reference Karalunas, Gustafsson, Fair, Musser and Nigg2019), and young adults with ADHD (Martel, Goth-Owens, Martinez-Torteya, & Nigg, Reference Martel, Goth-Owens, Martinez-Torteya and Nigg2010; Smith & Martel, Reference Smith and Martel2019) converge on the importance of affective features, including dysregulation of both positive and negative affect (Karalunas & Nigg, Reference Karalunas and Nigg2019; Nigg, Karalunas, Feczko, & Fair, Reference Nigg, Karalunas, Feczko and Fair2020a). Recent theory posits high negative affect, especially irritability, as a causal factor in the development of ADHD symptoms (Gagne & Hill Goldsmith, Reference Gagne and Hill Goldsmith2011; Nigg et al., Reference Nigg, Karalunas, Feczko and Fair2020a; Nigg, Sibley, Thapar, & Karalunas, Reference Nigg, Sibley, Thapar and Karalunas2020c). Other perspectives suggest affective dysregulation is a manifestation of ADHD and should be considered a core feature of the disorder for some children (Karalunas et al., Reference Karalunas, Gustafsson, Fair, Musser and Nigg2019; Nigg et al., Reference Nigg, Karalunas, Gustafsson, Bhatt, Ryabinin, Mooney and Wilmot2020b). From a network perspective, these possibilities can be untangled by looking for either unidirectional or bidirectional effects between these features (the former suggesting a specific longitudinal pathway and the latter suggesting closely linked co-expression over time).
Further, emotional heterogeneity, particularly high negative affect and irritability, may increase vulnerability to other co-occuring problems, such as oppositional defiant behavior and depression, via both direct and indirect pathways (Karalunas et al., Reference Karalunas, Fair, Musser, Aykes, Iyer and Nigg2014, Reference Karalunas, Gustafsson, Fair, Musser and Nigg2019; Martel, Reference Martel2016; Muris, Meesters, & Blijlevens, Reference Muris, Meesters and Blijlevens2007; Rutter & Arnett, Reference Rutter and Arnett2020; Smith & Martel, Reference Smith and Martel2019). Recent evidence from network studies suggest that irritability may serve as a key bridge between multiple forms of DSM psychopathology when considering self-reported symptoms in adolescence (Madole, Rhemtulla, Grotzinger, Tucker-Drob, & Harden, Reference Madole, Rhemtulla, Grotzinger, Tucker-Drob and Harden2019; McElroy et al., Reference McElroy, Shevlin, Murphy and McBride2018). However, the direction of relationships remains unclear. Traditional cross-lag models suggest irritability is a stronger prospective predictor of internalizing symptoms than the other way around (Savage et al., Reference Savage, Verhulst, Copeland, Althoff, Lichtenstein and Roberson-Nay2015), but longitudinal network findings accounting for other domains of psychopathology suggest the opposite (depressed mood as a cause of developing irritability over time) or find bidirectional relationships that are more consistent with co-expression than directional causality (Madole et al., Reference Madole, Rhemtulla, Grotzinger, Tucker-Drob and Harden2019). Support emerged in one study of short-term longitudinal change in the Adolescent Brain Cognitive Development sample that youth-reported irritability more strongly predicted developing impulsivity symptoms than the other way around (Funkhouser et al., Reference Funkhouser, Chacko, Correa, Kaiser and Shankman2020). However, relationships may vary by age (Karalunas & Nigg, Reference Karalunas and Nigg2019; McElroy et al., Reference McElroy, Shevlin, Murphy and McBride2018), and additional studies using parent-report of both irritability and ADHD symptom are needed given challenges with youth report of these domains (Du Rietz et al., Reference Du Rietz, Cheung, McLoughlin, Brandeis, Banaschewski, Asherson and Kuntsi2016; Sibley et al., Reference Sibley, Pelham, Molina, Gnagy, Waschbusch, Garefino and Karch2012). In addition, most studies thus far have focused on overt aggression or composite measures of DSM-based ODD symptoms that do not differentiate irritability from other types of oppositional and defiant behavior, although such distinctions are likely to be important (Cardinale et al., Reference Cardinale, Freitag, Brotman, Pine, Leibenluft and Kircanski2021; Vidal-Ribas, Reference Vidal-Ribas2021). Relationships also require further analysis in clinical samples, particularly given evidence that network structure may be less informative for psychopathology when too few “cases” are included in the sample (Hoffman et al., Reference Hoffman, Steinley, Trull, Lane, Wood and Sher2019).
Executive function
Cognitive systems are a major domain of interest for RDoC, as well as for understanding the progression of ADHD symptoms and co-occurring problems over time. Numerous alterations in cognitive development are apparent in ADHD (Kofler et al., Reference Kofler, Rapport, Sarver, Raiker, Orban, Friedman and Kolomeyer2013; Willcutt, Doyle, Nigg, Faraone, & Pennington, Reference Willcutt, Doyle, Nigg, Faraone and Pennington2005). Among the most consistently identified are weaknesses in working memory and inhibition (which often though not always co-occur Karalunas & Nigg, Reference Karalunas and Nigg2019), as well as slow and/or variable reaction times (Bergwerff, Luman, Weeda, & Oosterlaan, Reference Bergwerff, Luman, Weeda and Oosterlaan2017; Fair et al., Reference Fair, Nigg, Iyer, Bathula, Mills, Dosenbach and Bangaru2012), which may reflect arousal-related deficits in attention (Aston-Jones & Cohen, Reference Aston-Jones and Cohen2005; de Gee et al., Reference de Gee, Tsetsos, Schwabe, Urai, McCormick, McGinley and Donner2020; Karalunas & Huang-Pollock, Reference Karalunas and Huang-Pollock2013; Karalunas, Huang-Pollock, & Nigg, Reference Karalunas, Huang-Pollock and Nigg2012; Murphy, Vandekerckhove, & Nieuwenhuis, Reference Murphy, Vandekerckhove and Nieuwenhuis2014). Yet the role of cognitive impairments in ADHD symptom development and secondary comorbidity development has seen insufficient empirical study (Karalunas & Nigg, Reference Karalunas and Nigg2019; Nigg et al., Reference Nigg, Karalunas, Feczko and Fair2020a). The evidence to date appears strongest for a direct role of working memory. Development of working memory in childhood and early adolescence follows a parallel trajectory of change in ADHD symptoms (Karalunas et al., Reference Karalunas, Gustafsson, Dieckmann, Tipsord, Mitchell and Nigg2017). However, examining the effects of working memory in the context of other putative causal factors is necessary.
In addition, the cognitive weaknesses observed in ADHD are commonly associated with multiple forms of psychopathology (Bloemen et al., Reference Bloemen, Oldehinkel, Laceulle, Ormel, Rommelse and Hartman2018; Karalunas et al., Reference Karalunas, Hawkey, Gustafsson, Miller, Langhorst, Cordova and Nigg2018; Martel et al., Reference Martel, Pan, Hoffmann, Gadelha, do Rosário, Mari and Bressan2017; White et al., Reference White, Moore, Calkins, Wolf, Satterthwaite, Leibenluft and Gur2017), yet it is not clear how strongly these impairments are correlated with disorders when ADHD is also controlled (Nigg et al., Reference Nigg, Jester, Stavro, Ip, Puttler and Zucker2017). Thus, it remains unclear whether cognitive impairments in ADHD are epiphenomenal, are directly related to ADHD symptom course, or potentially reflect a transdiagnostic mechanism that could explain changes in ADHD symptom expression with age (Biederman, Mick, & Faraone, Reference Biederman, Mick and Faraone2000; Lahey, Pelham, Loney, Lee, & Willcutt, Reference Lahey, Pelham, Loney, Lee and Willcutt2005; Larsson, Dilshad, Lichtenstein, & Barker, Reference Larsson, Dilshad, Lichtenstein and Barker2011; Van Lier, Der Ende, Koot, & Verhulst, Reference Van Lier, Der Ende, Koot and Verhulst2007), as well as the heterogeneous trajectories for co-occurring clinical problems (Goodkind et al., Reference Goodkind, Eickhoff, Oathes, Jiang, Chang, Jones-Hagata and Korgaonkar2015; Hawkey, Tillman, Luby, & Barch, Reference Hawkey, Tillman, Luby and Barch2018). Each would be reflected differently in network structure as described.
Crucially, while it is clear that some top-down regulatory functions are shared in EF and emotion regulation, the mechanistic relationship between the emotional functioning and cognitive domains remain poorly characterized, with some studies suggesting a direct relationship (e.g., poor EF causes poor emotion regulation) and common neurobiological mechanisms (Macdonald et al., Reference Macdonald, Goines, Novacek and Walker2016) and other studies suggesting they reflect orthogonal, interacting dimensions (Banaschewski et al., Reference Banaschewski, Jennen-Steinmetz, Brandeis, Buitelaar, Kuntsi, Poustka and Albrecht2012) that may moderate relationships between psychopathology symptoms (Madole et al., Reference Madole, Rhemtulla, Grotzinger, Tucker-Drob and Harden2019). A network approach is, in some ways, ideal for study of these cross-domain interactions. It can characterize the relationships among a broad number of diverse feature sets accounting for the influence of all other features. Yet studies have not yet applied a process-oriented network model to a broad multilevel feature set.
Current study
The current study applies a CLPN approach in a relatively large sample of children oversampled for ADHD between 7 and 15 years old. We build on prior network studies of psychopathology but substantively expand in several ways that align with an RDoC framework. We included a broad feature set that includes traditional symptom ratings, trait-based ratings of positive and negative valence systems, and performance-based measures of executive function. Although prior studies have looked at single level ratings data over time using this approach (e.g., Funkhouser et al., Reference Funkhouser, Chacko, Correa, Kaiser and Shankman2020), the present report is the first study that we are aware of that has applied a network approach suited to causal inference to a multiconstruct, multilevel dataset that extends to trait- and performance-based measures of relevant domains. Debate continues as to whether explanatory power in network analysis is best achieved by using individual symptoms/behaviors or composite constructs as input features. Ultimately, the optimal input features will depend both on the questions of interest and the domain being measured. Here, we preserve power for our primary questions about transdiagnostic causal dynamics by selecting a set of conceptually guided composite dimensions, rather than individual symptoms, in most cases. Justification for each input feature is incorporated into the relevant sections in the Method.
Consistent with prior DSM-based work, we expected a densely connected network with a large number of edges connecting features within- and across- disorders and domains. In response to recent calls to move beyond an exploratory application of the network approaches (Robinaugh et al., Reference Robinaugh, Hoekstra, Toner and Borsboom2020), we focused on several specific hypotheses regarding network structure. First, we expected both ADHD symptom domains to be closely connected to other model features (i.e., high closeness) and to have high outgoing strength centrality with outgoing edges specifically linking ADHD to depression and ODD at later time points. This pattern would be consistent with inattention and hyperactivity–impulsivity serving as early emerging features that convey transdiagnostic risk for multiple pathologies over time, even when accounting for differences in other aspects of emotional functioning and cognition. We also hypothesized that temperamental irritability would be a central feature and a likely bridge feature connecting between domains (i.e., high betweenness centrality). We further hypothesized independent causal roles for irritability in worsening ADHD and depression symptoms over time (i.e., high outgoing strength with edges directly connecting irritability to ADHD and depression symptom domains rather than only indirect connections, again consistent with direct transdiagnostic risk). Finally, we hypothesized that working memory would be an important causal feature that predicted ADHD symptoms, particularly inattention (high outgoing strength with edges to inattention), and we sought to examine whether working memory also exerted independent influence on depression-related features. A major advance here over prior work suggesting similar associations is the ability to use a longitudinal network approach to examine directional paths while controlling for all other model features in order to isolate the specific unidirectional or bidirectional influences of interest.
Method
Participant enrollment
The enrolled sample included 673 children (ADHD n = 415) who enrolled in a longitudinal study and a parent or legal guardian. Children were between the ages of 7 and 12 years at initial entry into the study. Children were recruited via community volunteers and mass advertising. Children were followed annually. The current analyses use data from Years 1–3 of the ongoing longitudinal study, and included 488 children (nADHD = 296) who completed at least one of the measures used in the current analyses at all three years of assessment (additional information on missing data handling is described in that section below). Table 1 provides demographic characteristics by diagnostic group. Detailed information on retention in the overall cohort (Supplementary Table S1) can be found in the Supplemental Information (SI). Human participant protection procedures were approved by the local Institutional Review Board. A parent/legal guardian provided written informed consent, and children provided written assent. Behavioral ratings data were collected and managed using REDCap®, which provides a secure web-based and intuitive interface and export capabilities (Harris et al., Reference Harris, Taylor, Thielke, Payne, Gonzalez and Conde2009).
Sample demographics by diagnostic group

Note: Y1 = Year 1; mood disorders includes fourth edition of Diagnostic and Statistical Manual of Mental Disorders (DSM-IV) major depressive episode or dysthymia (current major depressive episode was exclusionary at baseline so totals reflect percent of children with history of mood disorder but not currently experiencing a major depressive episode); anxiety disorder includes separation anxiety, social phobia, and generalized anxiety disorder; ADHD = attention-deficit/hyperactivity disorder; ODD = oppositional defiant disorder
Diagnostic procedures
ADHD and all comorbid diagnoses were established via a multimethod, multi-informant, best-estimate diagnostic confirmation procedure. A parent/guardian, teacher, and child all completed nationally normed, reliable and valid standardized rating scales, including the Conners’ Rating Scales (CRS-R, Conners, Reference Conners2003), Strengths and Difficulties Questionnaire (SDQ, Goodman, Reference Goodman2001), and the ADHD Rating Scale (ADHD-RS, DuPaul, Power, Anastopoulos, & Reid, Reference DuPaul, Power, Anastopoulos and Reid1998).
The parent/guardian also completed a semi-structured clinical interview for DSM-IV diagnoses (the cohort was enrolled prior to DSM-5) (Kiddie Schedule for Affective Disorders and Schizophrenia [KSAD], Puig-Antich & Ryan, Reference Puig-Antich and Ryan1986). Child IQ was estimated based on a reliable and valid three-subtest short form of the Wechsler Intelligence Scale for Children (WISC)-IV (Sattler & Dumont, Reference Sattler and Dumont2004). Academic achievement was assessed using the Word Reading and Math Reasoning subtests of the Wechsler Individual Acheievement Test, 2nd edition (WIAT-II (Wechsler, Reference Wechsler2002). Final ADHD and all comorbid diagnoses were made by a clinical diagnostic team. Their blind agreement was acceptable for ADHD diagnosis (kappas at all years >.88) and for other disorders with >5% base rate in the sample (all kappa >.70). Disagreements were conferenced for final diagnostic assignments.
Measures
Inattention and hyperactivity–impulsivity
Primary analyses included two latent variables reflecting the two ADHD symptom domains that were created based on parent-report measures of: (a) inattention (indicators were: ADHD Rating Scale inattention raw score, KSAD inattention symptom count, Conners’ inattention raw score, and the Strengths and Weaknesses of Attention-Deficit/Hyperactivity-symptoms and Normal-behaviors [SWAN] Rating Scale inattention score) and (b) hyperactivity–impulsivity (indicators: ADHD Rating Scale hyperactivity–impulsivity raw score, KSAD hyperactivity–impulsivity symptom count, Conners’ raw hyperactivity–impulsivity raw score, SWAN hyperactivity–impulsivity raw score, and the SDQ hyperactivity–inattention raw score). Treating ADHD as a continuous trait is consistent with evidence that symptoms reflect underlying correlated but distinct dimensions (Sturm, McCracken, & Cai, Reference Sturm, McCracken and Cai2019). The selection of these composites follows extensive prior work in ADHD, including in the current sample (Nigg et al., Reference Nigg, Karalunas, Gustafsson, Bhatt, Ryabinin, Mooney and Wilmot2020b), indicating a two-factor model fits the data well. Other ongoing work in this sample examines cross-sectional networks using individual symptoms to answer different questions. However, the most recent network studies of ADHD focused on clinical course prediction across domains suggest that little additional information is gained by inclusion of individual symptoms over composite measures given that symptoms have been selected over time via factor analytic studies to reflect unitary constructs (Preszler, Burns, Becker, & Servera, Reference Preszler, Burns, Becker and Servera2020; Silk et al., Reference Silk, Malpas, Beare, Efron, Anderson, Hazell and Sciberras2019).
Secondary analyses replaced parent-reported ADHD symptoms with teacher-reported ADHD symptoms. Teacher ratings were combined into two latent variables using the same indicators as described for parent report when available: (a) inattention (indicators were: ADHD Rating Scale inattention raw score, Conners’ inattention raw score) and (b) hyperactivity–impulsivity (indicators: ADHD Rating Scale hyperactivity–impulsivity raw score, Conners’ raw hyperactivity–impulsivity raw score. The SDQ hyperactivity–inattention raw score was allowed to cross-load on both the inattention and hyperactivity–impulsivity factors. The model fit the data moderately well at all years, albeit with slightly higher root mean square error of approximation (RMSEA) values than would be desirable (comparative fit index [CFI] .97–.98, Tucker–Lewis index [TLI] .88–.93, RMSEA .22–.27). Use of the reasonably well-fitting two-factor model here allowed us to easily compare networks based on parent and teacher ratings.
Oppositional defiant disorder
Parent-reported KSAD symptoms were used as indicators for two separate latent variables: (a) defiant/headstrong behavior and (b) angry/irritable mood with symptoms assigned based on how they are classified in DSM-5. Composite selection was guided by prior literature suggesting that ODD symptoms are best understood as two correlated but distinct dimensions of behavior (Burke et al., Reference Burke, Boylan, Rowe, Duku, Stepp, Hipwell and Waldman2014; Stringaris & Goodman, Reference Stringaris and Goodman2009), as well as with recent network analyses suggesting network structure aligns with these latent variables (Preszler & Burns, Reference Preszler and Burns2019). Consistent with the literature, this model fit the data well (RMSEA = .043, CFI = .993, TLI = .995).
Depression
Children self-reported on symptoms of depression using the Children's Depression Inventory (CDI). At the time data collection was initiated for this longitudinal study (2009), the CDI was a widely used 27-item self-report questionnaire assessing features of depression in children and adolescents (Kovacs, Reference Kovacs1985, Reference Kovacs1992) and the CDI-2 had not yet been published. The original CDI was retained in original form over time to maximize sensitivity to detect change. Children rated items on a 0 to 2 scale. Items were combined into five subscales: (a) negative mood, (b) negative self-esteem, (c) interpersonal difficulties, (d) ineffectiveness, and (e) anhedonia. Scale reliabilities at all years were adequate (all alpha >.60).
Executive functioning
Children completed multiple measures of working memory and arousal/alertness. They also completed multiple measures of inhibitory control, but a single indicator is emphasized here (see Supplemental Information for additional details on all tasks). Tasks were used to create two latent variables: (a) working memory (indicators: WISC-IV digit span forward and backward raw scores, Cambridge Neuropsychological Test Automated Battery (CANTAB) spatial span backward number completed, and N-back 2-back accuracy) and (b) arousal (indicators: drift diffusion model drift rate (Ratcliff & McKoon, Reference Ratcliff and McKoon2008; Wickens, Reference Wickens2002) and two versions of d’ for the identical pairs continuous performance task). Latent variables were based on previously validated and well-fitting latent variable models used in this sample (Nigg et al., Reference Nigg, Gustafsson, Karalunas, Ryabinin, McWeeney, Faraone and Wilmot2018).
Working memory measures captured both verbal and nonverbal working memory domains. Use of this composite factor score is consistent with findings that domain general processes are primarily implicated in ADHD (Fosco, Kofler, Groves, Chan, & Raiker, Reference Fosco, Kofler, Groves, Chan and Raiker2020) and in other forms of psychopathology (Huang-Pollock, Shapiro, Galloway-Long, & Weigard, Reference Huang-Pollock, Shapiro, Galloway-Long and Weigard2017). Arousal indicators were derived via well-validated computational cognitive models (Ratcliff & McKoon, Reference Ratcliff and McKoon2008; Wickens, Reference Wickens2002) that isolate parameters linked neurobiologically to noradrenergic neural systems (Aston-Jones & Cohen, Reference Aston-Jones and Cohen2005a; Aston-Jones & Cohen, Reference Aston-Jones and Cohen2005b). We included arousal here due to longstanding theories about the role of arousal in ADHD and our prior work in this sample linking arousal to ADHD genetic risk (Nigg et al., Reference Nigg, Gustafsson, Karalunas, Ryabinin, McWeeney, Faraone and Wilmot2018).
Response inhibition is best conceptualized as multiple distinct cognitive processes, only some of which are impaired in ADHD. Here, response inhibition was measured using a single observed variable – the well-validated stop signal reaction time from a tracking version of the Logan Stop task. This measure captures a type of inhibitory control commonly impaired in ADHD, is based on a well-validated cognitive theory, and showed adequate reliability in our sample. While it could be combined with other measures of inhibitory control in our sample (e.g., Delis–Kaplan Executive Function System [DKEFS] Color Word), the factor loadings for the resulting latent variable are modest, consistent with the multifactorial nature of the construct.
Child temperament
A parent/guardian completed the Temperament in Middle Childhood Questionnaire (TMCQ, Simonds & Rothbart, Reference Simonds and Rothbart2004). Features included three TMCQ subscales measuring negative affect: (a) anger (referred to as irritability in the text here consistent with the widely used definition of irritability as “proneness to anger” Vidal-Ribas, Brotman, Valdivieso, Leibenluft, & Stringaris, Reference Vidal-Ribas, Brotman, Valdivieso, Leibenluft and Stringaris2016), (b) fear, and (c) sadness, as well as two measures related to positive affect dysregulation: (d) high-intensity pleasure (HIP) and (e) activity level. Feature selection follows prior theory (Rothbart, Reference Rothbart2007, Reference Rothbart2011; Rothbart, Sheese, & Posner, Reference Rothbart, Sheese, Posner and Gross2014) and is in line with prior work in this sample (Nigg et al., Reference Nigg, Karalunas, Gustafsson, Bhatt, Ryabinin, Mooney and Wilmot2020b). All scales showed adequate reliability (Cronbach's α all > .80).
Item overlap
Temperament scales related to Effortful Control (Inhibitory Control, Attentional Control, Impulsivity) were excluded from analyses due to item overlap with ADHD ratings. The ADHD latent variables already included indicators that captured a full range of both clinical and nonclinical symptom levels. In contrast, we retained the Anger/Irritability and Sadness scales in full despite item overlap with ODD-related anger-irritability and depression-related sadness, respectively. Temperament rating scales capture a wider range of dimensional behavior as compared to the clinical symptom ratings on the ODD and Depression scales. Thus, retaining both measures specifically allowed us to address how the broader dimensional constructs were related to other features over time, a critical part of assessing transdiagnostic risk prior emergence of clinical-level syndromes. Nonetheless, we specifically de-emphasize discussion of direct relationships between ODD and temperamental irritability or depression and temperamental sadness due to item overlap.
Analysis plan
Data preparation and missing data
All data transformations and analyses were conducted in R (vers. 3.6.1). To facilitate comparison across variables with different scales, variables were converted to z scores. Missing data were handled in two ways. First, during latent variable creation, missing indicators were handled via full-information maximum likelihood procedures in MPLUS. Thus, anyone with at least one indicator for the construct received a latent variable score. Second, prior to conducting the network model analysis, remaining missing data (i.e., when all indicators of a construct were missing or measurement was not by latent variable) were imputed via random forest imputation implemented with the missForest package (vers. 1.4). This method imputes data iteratively by fitting a random forest model on the observed data to predict the missing data, repeating this process until a prediction performance stopping criterion is met. This nonparametric method has been used with other work utilizing CLPN models with psychological data (Funkhouser et al., Reference Funkhouser, Chacko, Correa, Kaiser and Shankman2020), and there is evidence that random forest imputation methods perform well when compared with other missing data methods (e.g., Waljee et al., Reference Waljee, Mukherjee, Singal, Zhang, Warren, Balis and Higgins2013). Prior to the imputation, missingness within the selected sample of participants with data at all three time points ranged from 0% to 7% for Y1 variables, 0%–32% for Y2 variables, and 0%–15% for Y3 variables.
Cross-lagged panel networks
To examine associations among symptoms over time, a set of CLPN models were applied. We separately estimated: (a) the Year 1–Year 2 (Y1–Y2) network and (b) the Year 2–Year 3 (Y2–Y3) network. CLPN models allow the strength of the directional relationship between pairs of variables in a network to be assessed across time points while accounting for the effects of all variables at baseline, including autoregressive effects for the outcome variable (for recent examples of CLPN models, see Bernstein et al., Reference Bernstein, Kleiman, van Bork, Moriarity, Mac Giollabhui, McNally and Alloy2019; Epskamp, Reference Epskamp2020; Funkhouser et al., Reference Funkhouser, Chacko, Correa, Kaiser and Shankman2020). Thus, in the CLPN framework, edges reflect the directed, pairwise relationship between two nodes controlling for all other nodes at the first time point and any covariates. The edge weights can be interpreted similar to a regression coefficient in standard cross-lagged model. Age and sex were included as covariates in the models.
To reduce the likelihood of spurious edges in the network models, the resulting regression coefficients were adjusted using least absolute shrinkage and selection operator (LASSO) regularization, which helps prevent overfitting and reduces network complexity. The LASSO method shrinks small regression coefficients to zero based on a penalization value, lambda, determined through cross-validation. Thus, this method reduces the number of nonzero regression coefficients, which are used as edges for the network model. The LASSO regularized regression and a 10-fold cross-validation were conducted using the glmnet package (vers. 3.0-2). Analyses for the current study utilized the lambda penalization value that minimized the mean cross-validated error. The regularized regression coefficients served as edge weights in the networks.
The directed networks were plotted with the qgraph package (vers. 1.6.5) using a force-directed layout based on the Fruchterman–Reingold algorithm. In this layout, node placement is determined by the strength of association between each node pair, with highly associated nodes generally appearing closer to each other in the graph.
Network reliability
We addressed reliability of network structure by estimating the stability of the Y1–Y2 and Y2–Y3 networks using a nonparametric bootstrap method implemented with the bootnet package (vers. 1.4.3). A set of 1000 bootstrap samples were drawn with replacement from the dataset and the network model was fit for each sample. This process provides both the mean value for each edge weight across all bootstrapped models and a confidence interval (CI) for that mean based on the range of edge weight values in the bootstrapped models (the 2.5th and 97.5th quantiles).
Comparison of networks
We compared the Y1–Y2 and Y2–Y3 networks by assessing the correlation between edge weights in the two networks, the percentage of edges that maintained the same direction (i.e., positive or negative), and correlation of centrality indices (Funkhouser et al., Reference Funkhouser, Chacko, Correa, Kaiser and Shankman2020). Given that we expect some relationships to change with development, we do not interpret this strictly in terms of network reproducibility but as descriptive information about network similarity.
Measures of centrality
Centrality measures were calculated to support interpretation of the CLPN model output using the qgraph package (vers. 1.6.5). A variety of centrality measures can be used to guide network interpretation. Because our hypotheses focus on identifying features that are strong predictors of worsening or remitting problems over time, we emphasize outgoing strength centrality in our interpretation. Outgoing strength is the sum of the absolute value of regression coefficients for all outgoing edges from a feature (i.e., all edges directed from a Y1 feature to any Y2 feature or from a Y2 feature to any Y3 feature; see Figure 1 for visual depiction). Thus, high outgoing strength identifies those features that have the most predictive power within the network, and the observed edges reflect the specific pathways driving the overall strength.
We also calculated closeness centrality (mathematically average shortest path between a given node and the remaining nodes in the network; Robinaugh, Millner, & McNally, Reference Robinaugh, Millner and Mcnally2016) and betweenness centrality (mathematically the sum of the number of times a feature appears on the shortest path between any other two features), as well as incoming strength (i.e., the sum of the absolute value of all incoming edges to a feature, indicating which features are most highly predicted within the network). Several of these metrics are depicted in Figure 1.
Centrality stability
Similar to edge weight stability, centrality measure stability was assessed using a bootstrap method in the bootnet package. To accomplish this, 1000 bootstrap samples were drawn using the case-drop method described by Eskamp and colleagues (Epskamp, Borsboom, & Fried, Reference Epskamp, Borsboom and Fried2018). In this method, the stability of centrality measures is assessed by examining the maximum proportion of the sample that can be dropped while still maintaining a correlation between respective centrality values in the original versus bootstrapped samples with a 95% CI that does not fall below .7. The authors recommended a minimum cutoff for the centrality stability coefficient of 0.25 (Epskamp et al., Reference Epskamp, Borsboom and Fried2018), and we do not interpret measures that fall below this cutoff.
Results
Network reliability
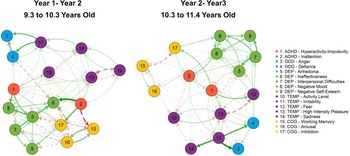
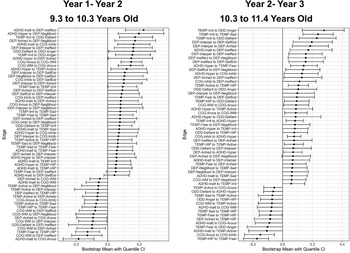
Y1–Y2 and Y2–Y3 networks are shown in Figure 3, and edge weights with 95% CIs are shown in Figure 4. A majority of non-LASSO penalized edges had bootstrapped CIs that did not cross zero, suggesting that the direction of relationships was reliable and can be interpreted. The CIs around the edge weights are relatively large, indicating there was significant overlap in the range of edge weights for each node pair across the bootstrapped samples. Therefore, interpretation of differences in the magnitude of individual edges should be made with caution. We focus interpretation on the presence/absence of edges rather than on comparison of edge strength. Correlations matrices with all incoming and outgoing edge weights are provided in Supplementary Table S2.
Shows the cross-lag panel networks for the year 1–year 2 and year 2–year 3 networks. Arrows indicate the directed effects from a feature at the first time point to another feature at the second time point controlling for all other network features. Thickness of the arrow is determined by the edge weight, with thicker arrows indicting higher absolute values for the partial correlation between features. Green solid arrows indicate a positive correlation between features and red dotted arrows denote a negative correlation between features. Color of the nodes indicate their domain: depression features (green), temperament features (purple), attention-deficit/hyperactivity disorder (ADHD) features (red), oppositional defiant disorder (ODD) features (blue), cognitive features (yellow).

Shows edge weights from 1,000 bootstrapped samples with 95% confidence intervals (CIs) for all nonzero edges in the network. A majority of non-LASSO penalized edges had bootstrapped CIs that did not cross zero, suggesting that the direction of variable relationships was reliable and can be interpreted. The CIs around the edge weights are relatively large, indicating there was significant overlap in the range of edge weights for each node pair. Therefore, interpretation of differences in the magnitude of individual edges should be made with caution.

Centrality stability
Our primary centrality measure of interest – outgoing strength – had acceptable stability in both the Y1–Y2 (0.43) and Y2–Y3 networks (0.28). Closeness centrality had acceptable stability in the Y1–Y2 network (0.28) but rank order of coefficients was not stable in the Y2–Y3 network (0.13); we report these but interpret them with caution in the Y2–Y3 network. Incoming strength (Y1–Y2: 0.20; Y2–Y3: 0.00) and betweenness (Y1–Y2: 0.00; Y2–Y3:0.00) had poor stability in both networks and are not discussed further.
Closeness centrality
Closeness centrality indicates how closely connected a feature is to other features in the network via both direct and indirect paths. In the current analysis, it reflects outgoing-closeness, which is how closely a Year 1 feature is connected to all other Year 2 features. High closeness centrality in this context is often interpreted in terms of a feature's ability to efficiently influence other features (Bringmann & Eronen, Reference Bringmann and Eronen2018, caveats to interpretation are discussed in more detail in the Discussion). Closeness centrality is network dependent and thus interpreted in terms of rank order of features within a given network.
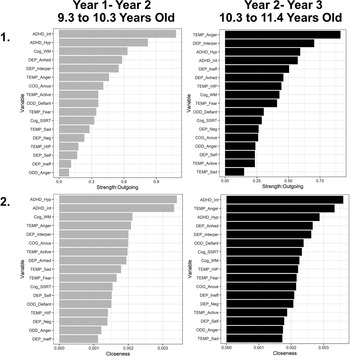
Consistent with hypotheses, ADHD symptom domains had the highest closeness centrality in the Y1–Y2 network and were among the top three features in closeness centrality in the Y2–Y3 network (with ADHD inattention retaining the highest closeness centrality but temperamental irritability rising above hyperactivity–impulsivity; see Figure 5). Hyperactivity–impulsivity and inattention each had outgoing edges connecting them to nearly all other network features in both the Y1–Y2 and Y2–Y3 networks.
Shows outgoing strength (panel 1) and closeness (panel 2) centrality for each network feature in the Y1–Y2 (grey) and Y2–Y3 (black) networks.

Temperamental irritability was also among the most closely connected features. In the Y1–Y2 model, temperamental irritability had the fourth highest closeness centrality. In the Y2–Y3 network, temperamental irritability had the second highest closeness centrality (after only ADHD inattention). It had the highest outgoing strength of any feature in the Y2–Y3 network.
We did not make predictions about overall closeness centrality for working memory. Nevertheless, working memory emerged as one of the most closely connected features in the Y1–Y2 network (third highest closeness centrality after only the ADHD symptom domains); rank order fell relative to other features in the Y2–Y3 network.
Overall, ADHD symptom domains, temperamental irritability, and working memory were all closely connected features within the network suggesting they may efficiently influence multiple other domains, which is consistent with the conceptualization of transdiagnostic risk markers.
Outgoing strength
High outgoing strength identifies those features that have the most predictive power within the network. Outgoing strength metrics for all nodes are shown in Figure 5.
ADHD symptoms predict later ODD
We hypothesized that ADHD symptoms would have outgoing edges to both ODD-related and depression-related features. Results in the Y1–Y2 network were consistent with predictions that higher ADHD symptom severity temporally precedes and predicts worsening ODD over time. Both ADHD inattention and ADHD hyperactivity–impulsivity had outgoing edges to ODD anger and ODD defiance. Outgoing edges from ODD symptom domains to ADHD domains were not present in the Y1–Y2 network, suggesting a directed relationship from ADHD to ODD in this period. In the Y2–Y3 network, ADHD hyperactivity–impulsivity retained an outgoing edge to ODD defiance but other outgoing edges from ADHD domains to ODD domains were not present.
Overall, ADHD symptoms appear to have direct, causal influence developing ODD anger and defiance. Inattention and hyperactivity–impulsivity both play a role earlier in development, but the specific relationships between persistent hyperactivity–impulsivity and ODD defiance symptoms is most developmentally stable.
ADHD symptoms predict later depression
Regarding depression, ADHD hyperactivity–impulsivity and ADHD inattention each predicted multiple depression features, but hyperactivity–impulsivity uniquely predicted negative mood and interpersonal problems while inattention uniquely predicted ineffectiveness. Results confirmed hypothesized relationships between ADHD and depression but also suggest each symptom domain shows unique associations with specific depression features. In the Y2–Y3 network, a similar pattern emerged. ADHD inattention uniquely predicted ineffectiveness. ADHD hyperactivity–impulsivity unique predicted negative self-esteem. Overall, ADHD symptoms play a direct role in developing depression, with each ADHD symptom domain appearing to contribute via a unique pathway.
Bidirectional effects of temperamental irritability with ADHD and depression features
The hypothesized outgoing edges from irritability to depression (specifically interpersonal problems) and to both ADHD symptom domains were also present in the network. In the Y1–Y2 network, there was evidence of bidirectional effects; temperamental irritability predicted worsening ADHD and depression, but each of these features also had outgoing edges to temperamental irritability as well.
Results from the Y2–Y3 network were similar. In the Y2–Y3 network, temperamental irritability had outgoing paths to both ADHD symptom domains and to aspects of depression (interpersonal problems and negative mood). Edges from the ADHD symptom domains to temperamental irritability in the Y2–Y3 network continued to support transactional influences; however, there were no edges from depression-related features to temperamental irritability. This pattern was consistent with edges observed for temperamental sadness. Temperamental irritability predicted temperamental sadness but the reverse was not true.
Overall, temperamental irritability and ADHD symptoms have bidirectional influence on each other consistent with tightly linked co-expression in middle childhood and early adolescence. Temperamental irritability and depression have bidirectional influences that may shift to unidirectional influence over development.
Working memory independently predicts ADHD and depression
As predicted, in the Y1–Y2 network, working memory had an outgoing edge to ADHD inattention. Working memory also had outgoing edges to all depression features. In the Y2–Y3 network, working memory retained moderate outgoing paths to ADHD inattention and multiple depression-related features. Overall, working memory had independent direct influences on both ADHD and depression.
Other notable network features
Although not a central focus of our hypotheses, several other aspects of the network should be highlighted in order to guide hypothesis formation for future studies.
Outgoing strength for other temperament features
In the Y2–Y3 network temperamental fear and HIP both also had high outgoing strength due, in part, to edges connecting them to each other (bidirectional relationship between higher HIP and lower fear).
Working memory–arousal relationships
Working memory and arousal had strong transactional influences on each other with outgoing edges in both the Y1–Y2 and Y2–Y3 networks from working memory to arousal, as well as from arousal to working memory (higher working memory predicted higher arousal).
Outgoing strength for depression features
Several depression-related features also had high outgoing strength. The high centrality for these features was generally due to edges connecting depression features to each other.
Similarity across Y1–Y2 and Y2–Y3 networks
Edges across the two networks demonstrated a moderate but significant correlation (r = .52, p < .001). The four centrality indices were closely correlated across the two networks (r = .69, p < .001). Furthermore, about 72% of the edge weights across the two networks shared the same direction. For edges that were nonzero in either network, the percentage decreased slightly to 65%. Together these metrics suggest that there is some change in the network structure over time, but that the two networks are similar overall.
Networks with teacher-reported ADHD symptoms
Networks using teacher-reported ADHD symptoms were generally similar to those using parent-reported ADHD symptoms with a few notable exceptions described below. Supplementary Figure S1 in the depicts the overall network and Supplementary Table S3 provides the full partial correlation matrix.
Closeness centrality
Similar to results using parent-report, ADHD inattention and temperamental irritability had high closeness centrality in both the Y1–Y2 and Y2–Y3 networks. However, ODD defiance ranked much higher in closeness centrality than in the parent network. It had the highest closeness centrality in Y1–Y2 and was second only to temperamental irritability in Y2–Y3. See Supplementary Figure S2 for rank ordered closeness centrality.
Outgoing strength
Networks using teacher-reported ADHD symptoms suggested bidirectional (rather than unidirectional) relationships between ADHD and ODD in the Y1–Y2 and Y2–Y3 networks. Higher ADHD symptoms predicted worsening ODD symptoms, similar to parent networks; however, higher ODD symptoms also predicted worsening ADHD.
All other major findings were confirmed in the teacher networks. Teacher ADHD symptom networks indicated bidirectional relationships between temperamental irritability and ADHD symptoms, consistent with networks using parent-report. Relationships between temperamental irritability and depression in both the Y1–Y2 and Y2–Y3 networks also paralleled those using parent-reported ADHD symptoms. Finally, findings that working memory independently predicted both ADHD symptoms and depression were also confirmed in the networks using teacher-reported ADHD symptoms. Supplementary Figure S1 shows the networks using teacher-reported ADHD symptoms.
Discussion
Network approaches are increasingly used in adult psychopathology research to understand unique direct and indirect relationships between symptom domains, yet studies in developmental psychopathology remain surprisingly rare (Contreras et al., Reference Contreras, Nieto, Valiente, Espinosa and Vazquez2019; Robinaugh et al., Reference Robinaugh, Hoekstra, Toner and Borsboom2020). Here, we build on prior DSM-symptom-based network studies by incorporating trait-based emotion ratings and performance-based measures of cognition into a multilevel, multiconstruct longitudinal network, employing a CLPN model at this level of detail for the first time.
In the resulting highly connected network, most features had edges connecting them to many other features in the network. Trait-based emotion ratings and measures of cognition were as interconnected within the psychopathology network as the symptoms themselves, consistent with an RDoC framework that emphasizes the need to understand psychopathology by looking beyond traditional core symptom domains. Of note, features from multiple reporters and at multiple levels of analysis played equally important roles in network structure. Results confirmed that ADHD-related inattention and hyperactivity–impulsivity, temperamental irritability, and working memory each exert important influence on multiple domains of psychopathology over time and can be conceptualized as conveying independent, transdiagnostic risk.
Findings from the longitudinal network supported our three primary hypotheses. First, ADHD symptom domains and temperamental irritability were among the most closely connected features in both networks. Being closely connected potentially allows these features to efficiently influence development of other features due to the relatively short paths connecting them (although, as Bringmann & Eronen, Reference Bringmann and Eronen2018 discuss, the availability of many short paths does not guarantee those are the primarily paths via which influence will actually occur). The implications from an RDoC perspective seem clear – these closely connected features have the most potential to simultaneously influence multiple other domains as transdiagnostic drivers of risk. Closeness metrics can depend heavily on the specific features included in the model. Thus, while other network models may yield alternative patterns, the breadth of domains included in the network here increases confidence in interpreting these as important transdiagnostic risk features.
Working memory also emerged as an important transdiagnostic risk feature but with some caveats. Closeness centrality was high in the Y1–Y2 network, but its closeness centrality rank dropped in the Y2–Y3 network. Several things may explain the pattern. Closeness centrality metrics were most stable in the Y1–Y2 network, and the drop in rank order closeness centrality may be a psychometric artifact of overall parameter instability. Yet it is intriguing that this pattern, if replicated, is consistent with working memory having more influence on other features earlier in development but losing some potency to influence other features over time. This pattern would be consistent with other literature suggesting the same thing: working memory impairments play large role early in development but normalize for some children over time (Karalunas et al., Reference Karalunas, Gustafsson, Dieckmann, Tipsord, Mitchell and Nigg2017; Ramos, Hamdan, & Machado, Reference Ramos, Hamdan and Machado2020; Sowerby, Seal, & Tripp, Reference Sowerby, Seal and Tripp2011). Although speculative, results suggest a developmentally sensitive window in which any effects of working memory interventions may be most effective. Early differences in the developmental trajectory of working memory may be an important factor accounting for differential patterns of ADHD symptom remission.
Closeness centrality provides an overall view of the direct and indirect connections of a feature within the network. Outgoing strength, in contrast, quantifies specific direct pathways between features, and we relied on it here to test directional hypotheses about developmental influences among features. Consistent with our hypotheses, ADHD symptoms exerted direct causal influence on developing depression. Further, paths were generally unidirectional. While some caution in interpreting edge weights is needed, in the current network ADHD exerted large influence on depression, explaining more than 12% of variance in the Y1–Y2 network when children were between 9 and 10 years old, whereas the few existing paths from depression to ADHD symptoms explained less than 1% of the variance. Findings are consistent with other recent work suggesting that genetic liability for ADHD directly conveys risk for categorical major depression (Riglin et al., Reference Riglin, Leppert, Dardani, Thapar, Rice, O'Donovan and Thapar2020) and that ADHD predicts developing emotional problems but the reverse is not true (Stern et al., Reference Stern, Agnew-Blais, Danese, Fisher, Matthews, Polanczyk and Arseneault2020). Here, we confirm that the unidirectional pathways hold even after accounting for a myriad of other emotional and cognitive features, a major step in clarifying mechanisms via which risk from categorical ADHD is conferred (Meinzer & Chronis-Tuscano, Reference Meinzer and Chronis-Tuscano2017).
Results also clarify unique patterns than can inform specific risk mechanisms. In particular, ADHD inattention specifically predicted developing feelings of ineffectiveness, pointing to a specific pathway via which inattention contributes to depression (McQuade, Hoza, Murray-Close, Waschbusch, & Owens, Reference McQuade, Hoza, Murray-Close, Waschbusch and Owens2011) and suggesting fostering feelings of success and mastery in areas where inattention often interferes may serve a protective role, even in children who are not yet experiencing depressive symptoms. Hyperactivity–impulsivity, in contrast, uniquely contributes to depression via increasing interpersonal problems and negative self-esteem, pointing to early interventions for social problems as a key tool in preventing depression in hyperactive–impulsive children. In either case, the implication of these direct, unidirectional pathways is that early treatment of core ADHD symptoms can help to prevent later depression.
Working memory also had direct paths to multiple aspects of depression. Recent meta-analytic review also suggests that working memory impairments contribute to co-occurrence of depression and ADHD, but the review highlights the paucity of prospective work using dimensional measures to characterize the cognitive mechanisms of ADHD–depression co-occurrence (Mayer et al., Reference Mayer, Bernhard, Fann, Boxhoorn, Hartman, Reif and Freitag2021). Prior studies have provided contradictory evidence about whether working memory impairments precede or follow onset of depression (Roy, Oldehinkel, & Hartman, Reference Roy, Oldehinkel and Hartman2017), as well as about whether these impairments are implicated in depression after accounting for ADHD comorbidity (Larochette, Harrison, Rosenblum, & Bowie, Reference Larochette, Harrison, Rosenblum and Bowie2011). Results here point to a direct causal role of working memory impairments in the development of depression during middle childhood and early adolescence. In contrast to ADHD symptom domains, which had at least partially dissociable effects, working memory had outgoing edges to all depression features in the Y1–Y2 network where it played the largest role, suggesting it conveys broad, general influence on multiple domains of developing depression. Results are consistent with theory suggesting that working memory impairments make it difficult for children to exert voluntary control over thoughts (Koster, Hoorelbeke, Onraedt, Owens, & Derakshan, Reference Koster, Hoorelbeke, Onraedt, Owens and Derakshan2017; Sportel, Nauta, de Hullu, de Jong, & Hartman, Reference Sportel, Nauta, de Hullu, de Jong and Hartman2011), thus reducing children's abilities to direct attention away from negative thoughts and contributing to increases in negative ruminative thought patterns associated with depression (Beloe & Derakshan, Reference Beloe and Derakshan2020; Kertz, Belden, Tillman, & Luby, Reference Kertz, Belden, Tillman and Luby2016; Koster et al., Reference Koster, Hoorelbeke, Onraedt, Owens and Derakshan2017).
Consistent with conceptualization of temperamental irritability as a transdiagnostic risk feature, temperamental irritability had direct paths to both ADHD and depression but relationships to each domain varied. Irritability predicted depression-related interpersonal problems and negative mood. On one hand, this is unsurprising given the large literature on childhood irritability as a predictor of later mood problems (Fernandez de la Cruz et al., Reference Fernandez de la Cruz, Simonoff, McGough, Halperin, Arnold and Stringaris2015; Leibenluft, Blair, Charney, & Pine, Reference Leibenluft, Blair, Charney and Pine2003; Leibenluft, Cohen, Gorrindo, Brook, & Pine, Reference Leibenluft, Cohen, Gorrindo, Brook and Pine2006; Stringaris, Reference Stringaris2011). However, this study confirms a unique association between temperamental irritability and depression using a cross-lag network approach to account for a myriad of other cognitive and temperamental features, including other features related to temperamental negative affect such as sadness and fear. Of note, while relationships were bidirectional in the Y1–Y2 network, they became unidirectional as children got older. A pattern that held when considering the relationships between temperamental irritability and temperamental sadness as well. At least two pathways may account for these associations. First, irritability was related specifically to the interpersonal problems feature of depression. Irritability in middle childhood may interfere with developing the social relationships that take on a crucial role in later childhood and adolescence (Evans et al., Reference Evans, Burke, Roberts, Fite, Lochman, Francisco and Reed2017), contributing to loneliness and isolation, two key drivers of depression risk (Loades et al., Reference Loades, Chatburn, Higson-Sweeney, Reynolds, Shafran, Brigden and Crawley2020; Matthews et al., Reference Matthews, Danese, Wertz, Odgers, Ambler, Moffitt and Arseneault2016). Second, shift to unidirectional relationship from irritability to negative mood and temperamental sadness may reflect a type of heterotypic continuity – mood dysregulation that is expressed as irritability earlier in development may increasingly manifest in terms of negative mood in later development.
In contrast to the unidirectional relationship between irritability and depression, relationships between irritability and the ADHD symptom domains were bidirectional. These bidirectional influences suggest tightly linked co-development and expression over time. They support recent suggestions that temperamental irritability should be conceptualized as a core part of ADHD symptom expression for some children (Karalunas et al., Reference Karalunas, Gustafsson, Fair, Musser and Nigg2019; Nigg et al., Reference Nigg, Karalunas, Feczko and Fair2020a, Reference Nigg, Karalunas, Gustafsson, Bhatt, Ryabinin, Mooney and Wilmot2020b). The co-development and expression of ADHD symptoms and anger regulation difficulties may be related to their shared reliance on overlapping neural resources related to top-down regulation of attention (Karalunas, Weigard, & Alperin, Reference Karalunas, Weigard and Alperin2020; Ochsner & Gross, Reference Ochsner and Gross2008). Given the shared neural and psychological resources, weak top-down regulation may variously express itself as inattention, poor behavioral control (hyperactivity–impulsivity), or emotion dysregulation depending on the social or other environmental context. Further, for some children, the need to exert attentional control (e.g., school, homework, multitasking situations, or handling complex social interactions) may serve to exacerbate problems with emotional control, contributing to commonly observed contextual variation in symptom expression. Further, differential management of mood dysregulation in early childhood may partially explain heterogeneous course of ADHD symptoms. While existing behavioral treatments appear to have relatively small direct effects on core ADHD symptoms of inattention and hyperactivity–impulsivity (Sonuga-Barke et al., Reference Sonuga-Barke, Brandeis, Cortese, Daley, Ferrin, Holtmann and Döpfner2014), the current findings suggest that behavioral treatments to improve emotion regulation in children with ADHD may actually help modify trajectories of core ADHD symptom expression as well.
Edges connecting irritability to both ADHD domains and depression were all of similar magnitude. There is ongoing debate regarding whether irritability should be conceptualized in terms of distinct tonic negative mood and phasic temper outburst components that may have unique associations with psychopathology (Cardinale et al., Reference Cardinale, Freitag, Brotman, Pine, Leibenluft and Kircanski2021; Hirsch, Davis, Cao, & Roy, Reference Hirsch, Davis, Cao and Roy2021). Future studies, particularly those using momentary assessment to differentiate these components, will be critical to further clarifying which facets of the construct are most influential on different forms of psychopathology. Similarly, the current study used widely spaced assessment points that captured developmental pathways over the course of years. Momentary assessment studies will be important for understanding dynamic causal influences on shorter timescales.
Our primary analyses used parent-reported ADHD symptoms, and networks using teacher-reported ADHD symptoms confirmed our major findings, including the bidirectional relationships between temperamental irritability and ADHD and temperamental irritability and depression features. Teacher networks also confirmed the role of working memory in worsening ADHD symptoms and depression. Teacher-reported networks also confirmed relationships between ADHD and ODD but these effects were bidirectional (as opposed to unidirectional effects in the networks using parent-reported ADHD symptoms. The overall level of convergence between networks using parent- and teacher-reported ADHD symptoms is reassuring, but additional studies using a broader set of teacher report measures may offer additional insight. In addition, studies using observational measures of irritability or ADHD symptoms may yield additional information.
Finally, the current analyses yielded wide CIs around estimated edge weights. CIs did not include zero, suggesting that we can confidently interpret the presence or absence of edges as indicating the presence or absence of relationships in our data. However, the wide confidence intervals mean preclude strong inferences about whether one edge is stronger than another (e.g., even values that superficially appear quite different may actually reflect similar strength relationships at the population level). Wide CIs are common in psychopathology networks but additional studies with larger samples and methodological advances to improve network estimation will be important for understanding the relative importance of various pathways.
Conclusion
Despite substantial research efforts, heterogeneous clinical course in ADHD remains difficult to predict and the mechanisms accounting for secondary co-occurrence of ADHD and additional clinical problems remain poorly understood. Resolving these is crucial to improve prediction and prevention of such outcomes. Yet doing so requires accounting for transactional influences of a large number of features across development. Here, we applied a longitudinal network model to a multimodal, multilevel dataset to test RDoC-inspired hypotheses about transdiagnostic risk features. Results confirmed specific hypotheses about ADHD symptom domains, temperamental irritability, and working memory as critical transdiagnostic risk factors for psychopathology based on their direct associations with other features across time. ADHD symptoms and working memory each had direct, independent associations with depression. Further, we demonstrate tightly linked co-development of ADHD symptoms and temperamental irritability, consistent with the possibility that anger dysregulation is a core feature that is co-expressed as part of the ADHD phenotype for some children.
Supplementary material
The supplementary material for this article can be found at https://doi.org/10.1017/S0954579421000900
Acknowledgment
We would like to sincerely thank the children and families who have dedicated countless hour over many years to participating in this research.
Funding Statement
This project was supported by R37 MH059105 (PI: Nigg). Karalunas’ time was additionally supported by R01 MH120109 (PI: Karalunas). Michelle Martel and Patrick Goh were supported by R01MH119119-01A1 (PI: Martel).
Conflicts of Interest
None.