


1. Introduction
In the United States, turnout in national elections remains lower than in many other Western democracies.Footnote 1 Observers have pointed to voter suppression efforts as a potential explanation for this persistent trend. Indeed, the U.S. Constitution does not afford a universal right to vote and by and large leaves the determination of electoral rules and procedures to the states.Footnote 2 As such, many states have created barriers for citizens to participate in the electoral process, and many of these voting-related policies disproportionately affect minority communities, low-income voters, and young people.Footnote 3
Social scientists have begun to assess the emergence and consequences of voter restrictions more systematically, often trying to isolate the effect of individual vote repression tactics on voter participation and minority representation.Footnote 4 Others have sought to understand the impact of disenfranchisement mechanisms in historical perspective, documenting how new forms of vote repression often emerged in response to moments of voting rights expansion for previously excluded groups, in particular African American communities.Footnote 5
All of these studies share two observations: (1) that attempts to suppress votes, in particular of African Americans, have been a persistent feature of American democracy; and (2) that these attempts have been by and large successful in reducing the size of the electorate at various points in American history. However, for the most part, these studies fail to relate individual repressive tactics to each other to help us understand when—under what conditions—political actors will pursue certain strategies over others.Footnote 6
This paper presents a framework that advances the study of vote repression in America in two ways: first, my framework positions individual voter suppression tactics within a broader repertoire of vote repression used to undermine voting rights, in particular of African American communities. I distinguish between institutionalized vs. non-institutionalized and violent vs. nonviolent tactics, and I argue that political actors who seek to repress votes prioritize effectiveness (achieving disenfranchisement) and efficiency (minimizing costs) when selecting strategies. Second, I argue that the size and composition of the repressive repertoire change amid historically contingent constraints—such as political conditions, state capacity, and political-economic structures—that expand or limit the choice set available to actors over time.
I illustrate the utility of my framework through historical case studies of two pivotal moments of racial mass enfranchisement in the United States: Reconstruction and the Civil Rights era. Both of these moments share critical parallels: During both periods, Black communities spearheaded grassroots movements to secure political rights. Both times, grassroots activism triggered substantial federal intervention into state politics, in particular as it pertained to voting rights and electoral procedures. And during both periods, federal efforts to enfranchise African Americans threatened white political hegemony and prompted intense counter-mobilization on the part of white constituents and elites on the state level, in particular across the American South. Importantly, however, the strategies that dominant political actors employed to repress votes in response to minority rights expansion differed across the two periods.
Putting my theoretical framework to a test, I use causal narratives and process tracing to make sense of this divergence: During Reconstruction, franchise expansion triggered intense violence targeting Black voters, as institutionalized vote repression was constrained, at least temporarily, by federal oversight. Only after Reconstruction had ended and Jim Crow-era legal restrictions were in place, violence as a vote suppression tool waned.Footnote 7 During the Civil Rights era, widespread racial violence was no longer tolerated by the broader mass public,Footnote 8 and the Voting Rights Act (VRA) of 1965 barred legal restrictions on minority voting rights. This forced political actors to pursue subtler—albeit less efficient—repressive strategies like racial gerrymandering, “electoral protectionism,” and felon disenfranchisement through incarceration in an effort to curtail the impact of federally mandated minority enfranchisement.Footnote 9
My analysis is primarily concerned with understanding the American experience. However, the general logic of my framework—that political actors weigh effectiveness and efficiency against institutional and structural constraints when selecting vote repression tactics—is portable to other contexts and generates potentially useful insights for understanding the nature of repression in other political systems where democratic inclusion is stratified along racial or ethnic lines.Footnote 10
In the following section, I will first provide a background on the contested history of voting rights in the U.S. constitutional framework before introducing my theoretical framework. I will then show how the repertoires-of-vote-repression framework helps explain why mass enfranchisement of racial minorities was met with divergent repressive strategies at different moments in American political development, in particular during Reconstruction and the Civil Rights era.
2. Historical background: race and voting rights in the U.S. Constitution
The U.S. history of voting rights has been marked by a tension between democratic aspirations and exclusionary practices. The U.S. Constitution of 1789 did not directly define voting rights and instead set forth a system of electoral federalism, which would prove consequential for the ability of marginalized groups to obtain political rights. Indeed, until the mid-nineteenth century, large swaths of the voting-age population would remain disenfranchised—along socioeconomic, racial, and gender lines.Footnote 11
Following the Civil War, the United States experienced its first moment of mass enfranchisement on the basis of race, brought on by federal-level intervention during Reconstruction. The Reconstruction Amendments passed during Congressional Reconstruction (1867–1877)Footnote 12 aimed to secure rights for previously enslaved individuals. The Fifteenth Amendment to the Constitution, ratified in 1870, was key among these, as it prohibited state and federal governments from denying citizens the right to vote based on “race, color, or previous condition of servitude.” For a brief moment, African American men were able to vote in elections and run for political offices, according them substantial political influence on the state and federal level.Footnote 13
Notably, the Fifteenth Amendment, like the original Constitution, failed to establish a universal right to vote—it only provided legal protections against the denial of voting rights on the basis of race. Once Reconstruction drew to a close and federal attention to the former Confederacy waned, electoral federalism allowed Southern states (and others) to implement discriminatory practices like literacy tests, poll taxes, and grandfather clauses that were de jure “race-neutral,” but de facto disenfranchised Black voters disproportionately until well into the twentieth century.Footnote 14
The second moment of mass enfranchisement of minority voters occurred in the 1960s when the Civil Rights Movement fought to dismantle the Jim Crow system of racial segregation and exclusion. A landmark success of this movement was the VRA of 1965, which aimed to eliminate racial discrimination in voting by prohibiting literacy tests and authorizing federal oversight of electoral rules and procedures in areas with a history of discriminatory practices. Over the years, Congress has passed various acts to strengthen and expand the VRA, though parts of it have faced challenges, most notably the 2013 Supreme Court decision in Shelby County v. Holder, which eroded key VRA provisions concerning federal oversight of electoral constituencies based on historical demographic data.
Ultimately, despite federal reforms to expand suffrage—particularly for Black voters—the U.S. Constitution still does not guarantee a universal right to vote, thus by and large preserving state authority over election rules. Contemporary debates over voter ID laws, mail-in voting, redistricting, and felon disenfranchisement underscore America’s enduring struggle to reconcile decentralized control of electoral rules with democratic inclusivity.
3. Vote repression: toward a more comprehensive framework
The history of voting rights in America reveals a recurring pattern: federal expansions of suffrage were routinely followed by state-level contraction of rights, particularly for African American voters.Footnote 15 This dynamic, enabled by electoral federalism, allowed dominant groups to curtail rights through systematic vote repression.Footnote 16 Federal efforts to enfranchise Black voters during Reconstruction and the Civil Rights era were systematically undermined by state and local political actors, reflecting a broader project to maintain racial hierarchies within America’s “racial caste system.”Footnote 17 These struggles epitomize the persistent tension between white-supremacist and egalitarian racial orders in American political development and underscore how electoral federalism aided the survival of “authoritarian enclaves” within American democracy.Footnote 18
However, the nature of counter-mobilization to mass enfranchisement of racial minorities varied substantially over time. What strategies have dominant political actors employed to suppress minority electoral power? And what determines which tactics are deployed and when? I will begin by reviewing the existing literature on specific repressive tactics to develop a synoptic typology of “repertoires of vote repression,” defined here as the set of tactics available to political actors for vote suppression purposes.Footnote 19 Specifically, I differentiate between non-institutionalized (mass-level) and institutionalized (elite-level) tactics, as well as violent and nonviolent forms of vote repression. I then develop a more comprehensive framework to understand under which conditions we would expect political actors to rely on certain tactics over others.
3.1. Repertoires of vote repression: counter-mobilization to enfranchisement
Dynamics of social status threat are usually seen as the underlying driver of counter-mobilization to enfranchisement and rights expansion.Footnote 20 In the United States, racial threat theory in particular predicts that dominant racial groups will employ both private and state-sponsored means of social control when they perceive racial status hegemony as threatened, especially during periods of institutional empowerment for previously subordinate groups.Footnote 21
White political hegemony is often most threatened in jurisdictions where recently enfranchised minority voters make up a larger share of the population and therefore carry significant electoral weight. However, minority enfranchisement can increase perceptions of racial threat, even when the actual threat to electoral outcomes is limited (i.e. when the share of the minority population is modest). This is because in highly racially stratified societies (like the United States South), enfranchisement of minority voters threatens longstanding racial orders more broadly. I therefore treat “racial threat” that arises from minority enfranchisement as both material (affecting actual electoral outcomes) and symbolic (threatening existing racial hierarchies), and I argue that either can serve as a potent driver of minority vote repression.
Counter-mobilization to minority enfranchisement has operated both on the mass and the elite level and involved institutionalized and non-institutionalized strategies. Non-institutionalized vote repression often emerges from the bottom up, though political elites may sanction or encourage it. Counter-mobilization to enfranchisement can occur in the form of extra-legal violence against and intimidation of voters of the minority group.Footnote 22 Recent empirical research has similarly shown that lynching violence in the South during the 1870s and 1880s corresponded with electoral cycles—at least until the legal disenfranchisement of African Americans under Jim Crow was near complete, which lessened the need to rely on vigilante violence as a form of voter intimidation.Footnote 23 And civil rights activism during the 1950s and 1960s was also met with violent resistance on the part of local white constituencies in the South.Footnote 24 Ultimately, while intimidation and vigilante violence can reduce minority voting power, their effectiveness as vote repression tools will depend on the relative size of the minority population.Footnote 25
Fraud occupies a related position: like violence and intimidation, fraud is an extra-legal (but typically nonviolent) mechanism for diluting minority voting power—it operates outside or at the margins of formal legal authority rather than through it. Highly systematized fraud can shade toward an institutional repression mechanism, but its essential character remains extra-legal (illegal). Indeed, fraud and ballot manipulation in the post-Reconstruction period were effective at reducing Black turnout long before formal legal restrictions—poll taxes and literacy requirements—were put in place.Footnote 26
Minority enfranchisement can also result in nonviolent mass-level efforts to “dilute votes” by increasing electoral mobilization among members of the dominant group in an effort to diminish the impact of newly enfranchised voters on electoral outcomes.Footnote 27 Notably, mobilizing white voters strategically as a repressive tactic to dilute the impact of minority votes typically requires considerable coordination and resources and is thus often at least somewhat elite-driven.Footnote 28 And once again, its success ultimately depends on the relative size of the minority voter base in a given jurisdiction.Footnote 29
Political elites might pursue vote repression when electoral prospects and political power constellations change once previously excluded groups gain suffrage.Footnote 30 If party leaders cannot expect (or are unwilling) to incorporate new voters into their base, and if the franchise expansion is sizable enough such that other parties stand to gain electorally from enfranchisement, political elites of the party that stands to lose from suffrage expansion have an incentive to engage in strategic voter suppression tactics. That said, counter-mobilization by political elites can also serve constitutive ends: parties may appeal to dominant group voters by symbolically marginalizing voters from lower status groups, thus reasserting the dominant group’s hegemony and strengthening its members’ identification with the party.Footnote 31
Elite-level tactics of vote repression are typically implemented within institutional frameworks and may range from formal legal disenfranchisement to more covert administrative stratagem to outright violent repression using the state’s coercive apparatus. In the context of the United States South, elites have relied on all three of these tactics to varying degrees. During Jim Crow, Southern state governments relied heavily on legal disenfranchisement to walk back voting rights that freedmen had gained during Reconstruction.Footnote 32 While Jim Crow-era voter restrictions were supposedly “race neutral” (and thus not initially considered in conflict with the Fourteenth and Fifteenth Amendments of the Constitution), their discriminatory application had disproportionate effects on Black communities in the South, leading to a near-total disenfranchisement of African Americans in the region by the early twentieth century.Footnote 33
More recently, elites have engaged in subtler forms of vote suppression through administrative stratagem that serve the purpose of “electoral protectionism.”Footnote 34 When political elites can no longer restrict the right to vote for minority groups, they might instead seek to undermine the value of their vote through administrative changes in order to stay in power. Protectionist strategies range from racial gerrymandering to changing electoral rules to eliminating elected public offices altogether. In the United States, such strategies have gained prominence in the aftermath of the 1960s rights revolution.Footnote 35
Violent state repression includes practices such as harassment, surveillance, torture, and mass killings by government officials in an attempt to marginalize or eliminate political challengers.Footnote 36 However, the strategic use of state coercion and violent repression to disenfranchise marginalized groups by state actors will depend on whether or not the benefits of repression (i.e. the elimination of political challengers) outweigh the costs (both material and reputational). For that reason, the most violent forms of state repression, even though they can be effective at marginalizing subordinate groups,Footnote 37 are generally less likely to occur in democracies relative to autocratic regimes because “[d]emocratic institutions are believed to increase the costs of using repressive behavior because, if state actions are deemed inappropriate, authorities can be voted out of office.”Footnote 38
More recently, incarceration and the criminal legal system at large have been recognized as an important tool in the state’s coercive apparatus that political actors might use for the purpose of disenfranchisement.Footnote 39 Scholars have considered both mass- and elite-level mechanisms through which mass enfranchisement and carceral expansion could be causally linked. On the mass level, minority enfranchisement could heighten punitive attitudes toward racial minorities among members of the dominant group, thus increasing support for punitive policies that ultimately translate into increased imprisonment. On the elite level, a carceral response to mass enfranchisement of minority groups could serve an instrumental purpose: as felons continue to be legally disenfranchised in many states, incarcerating a growing number of racial minorities ultimately reduces the size of their electorate, thus allowing dominant political elites to stay in power.Footnote 40 The observed outcome tends to be observationally equivalent: incarceration rates differentially increase in areas where the political hegemony of dominant groups is threatened more by minority enfranchisement.Footnote 41
***
In sum, the existing literature outlines various tactics used by political actors on the mass and elite levels to suppress voting rights of marginalized groups. However, by focusing on individual tactics, existing studies fail to explain why and when certain methods are chosen over others. My typology organizes these tactics into a broader repertoire of vote repression, distinguishing between violent and nonviolent as well as institutionalized and non-institutionalized tactics that political actors who seek to repress minority votes potentially have at their disposal (see Table 1), and my aim in the next section is to propose a framework that outlines conditions under which repressive repertoires expand or contract over time.
Repertoires of Vote Repression

Table 1 Long description
Two columns label forms of vote repression as, Institutionalized and, Non Institutionalized. Rows group tactics by violence level. In the violent row, Institutionalized lists, State Repression, and Non Institutionalized lists, Extra Legal Violence. In the non violent row, Institutionalized lists, Legal Disenfranchisement, and Non Institutionalized lists, Fraud. Two additional items appear only under the Institutionalized column: Administrative Stratagem and Electoral Mobilization. One final item, Incarceration, appears without a column heading or row label.
3.2. Constraints matter: toward a more comprehensive framework for understanding vote repression strategies
How do political actors who seek to repress votes choose repressive tactics?Footnote 42 I argue that, when choosing from their repressive repertoire, political actors aim to maximize both effectiveness (achieving vote repression) and efficiency (doing so economically). Legal vote restrictions are typically the most efficient and effective because they exclude large groups of voters at low cost. Administrative stratagem is reasonably efficient but less effective, as it is aimed at devaluing votes rather than outright excluding voters. Extra-legal violence is “economical” from a fiscal perspective, but it comes with potentially high reputational costs for the regimeFootnote 43 and is generally less effective, as it relies on intimidation by private actors rather than formal exclusion of voters. Violent state repression, while highly effective at suppressing voters, is both fiscally costly as it requires the development of a substantial coercive apparatus and reputationally costly as it invites scrutiny from other democratic actors, in particular when embedded in broader democratic regimes. Fraud can be quite effective at tilting elections in favor of dominant groups, but much like state repression, it comes with potentially high reputational costs while also requiring substantial coordination between political actors and localities, which makes it less efficient as a suppression strategy. Similarly, incarceration can effectively remove voters from the electorate, but it is overall much less efficient due to its high fiscal cost. Lastly, strategic electoral mobilization of voters of dominant groups requires costly coordination and how effective it is at offsetting minority votes will depend on the relative size of the minority voter base (see Table 2).
Effectiveness vs. Efficiency

Table 2 Long description
Entries are organized by effectiveness, with rows labeled less effective and more effective, and by efficiency, with columns labeled less efficient and more efficient. In the less effective row, the less efficient column lists electoral mobilization and administrative stratagem. In the less effective row, the more efficient column lists extra legal violence. In the more effective row, the less efficient column lists fraud. In the more effective row, the more efficient column lists legal disenfranchisement, incarceration, and violent state repression.
All else equal, political actors therefore likely prefer legal vote restrictions to other less efficient and less effective forms of vote repression. Why then would political actors ever choose anything other than legal disenfranchisement? I argue that the relative constraints that political actors face with respect to political conditions, state capacity, and the political economy can expand or contract the size of the repressive repertoire over time such that their preferred method of vote repression may be unavailable. Notably, beyond distinguishing between mass- and elite-level vote repression, my framework intentionally abstracts from specific political actors: institutional and structural constraints shape available repressive repertoires regardless of which specific actors make decisions or how coordinated they are. As such, my framework emphasizes the historical context specificity of the nature of voter repression in the United States.
Political constraints—the political limitations political actors face in implementing vote suppression strategies—arise from both lack of state-level control over political institutions and federal oversight of subnational politics. To enact institutionalized vote repression tactics such as legal restrictions or administrative stratagems, political actors typically need state-level control over political and administrative institutions—especially in the United States, where electoral federalism by and large delegates the authority to determine voting rights and implement elections to state legislatures and governments as well as local authorities. Scaling incarceration to suppress votes likewise requires state-level legislation to disenfranchise felons and changes to penal codes, alongside coordination between local law enforcement and state actors. Without control over these subnational political processes, political actors cannot effectively use institutionalized vote repression tactics.
Federalism can impose further limits on local political actors’ ability to repress votes, especially when antidemocratic political actors operate within a larger democratic system. Even when dominant political actors are in control at the local or state level, federal oversight can block both institutional and non-institutional vote repression efforts on the state level. In the United States, while states largely determine voting rights, the federal government has intervened to enforce constitutional rights at various historical junctures. Even non-institutionalized repression that is seemingly localized, like extra-legal violence, can lead to reputational costs for local elites as national political actors may scrutinize such actions.Footnote 44 Even if vigilante violence is outside the formal control of institutional actors, such scrutiny can impose normative constraints that force political elites to curtail violence.Footnote 45 However, how effective federal oversight is in constraining vote repression will depend on both the federal enforcement architecture and sustained political will of national political actors to protect voting rights durably.Footnote 46
In the United States, federal enforcement of voting rights has operated through three distinct mechanisms, each with different strengths and vulnerabilities. Military enforcement—the direct deployment of federal armed forces to protect voting rights and suppress violent resistance—is the most immediately powerful mechanism but the least sustainable over time. It requires ongoing resource commitment and political will to maintain, generates fiscal and reputational costs, and is vulnerable to redeployment pressures and shifting national priorities.
Judicial enforcement depends on favorable court interpretations of federal authority to protect voting rights.Footnote 47 Broad judicial support can provide durable constitutional protections, but this mechanism is inherently fragile: narrow court interpretations can hollow out the legal foundations of enforcement even when the underlying statutes remain nominally in place, as the history of Reconstruction-era jurisprudence illustrates.Footnote 48
Administrative enforcement—the institutionalization of voting rights protection in statutory mechanisms and the federal bureaucracy—is potentially the most durable of the three, because it does not require the ongoing political will to deploy military forces or favorable judicial interpretation at every turn. Statutory mechanisms can survive changes in presidential administration, and bureaucratic enforcement routines can persist even under adverse political conditions. However, administrative enforcement remains vulnerable to legislative revision and to court challenges to statutory authority.Footnote 49
Even when free of political constraints, dominant political actors may face variable state capacity constraints when choosing different vote repression tactics. Legal vote restrictions need local election officials to administer them but do not typically require expansions of administrative resources. Likewise, administrative strategies that serve the purpose of “electoral protectionism” typically require minimal bureaucracy (beyond what is already in place) and might even reduce fiscal costs.Footnote 50 Extra-legal violence, often carried out by members of the mass public rather than institutional actors, also requires little in the way of state capacity. By contrast, repressing votes through incarceration necessitates a carceral infrastructure that can handle a growing number of prisoners. Likewise, violent state repression typically requires substantial investments in the state’s coercive apparatus.
Constraints within the political economy arise when vote repression conflicts with broader objectives within the local political economy, for example when purging voters simultaneously removes them from the labor market. In political economies where labor is racially segmented, such as in the agrarian economy of the postbellum South, labor market dynamics potentially shape the cost–benefit calculus for various vote repression tactics. The most obvious illustration of this dynamic is mass incarceration: while imprisonment is potentially effective at shrinking the electorate, it can simultaneously lead to labor shortages if the politically targeted group also constitutes a primary workforce.Footnote 51
But even other repressive tactics can impact local political economies in the long run. Both extra-legal violence and legal voter restrictions, for example, can lead to displacement of minority voters, prompting labor shortages in local industries. This can be of particular concern when vote repression is localized within a larger democratic polity, which potentially allows voters to “vote with their feet” by moving to localities with relatively more political freedoms.Footnote 52 Hence, I would expect political actors to steer away from repressive tactics that disrupt labor supply and ultimately upend the local political economy.
***
In sum, political actors likely prefer repressive tactics that maximize both efficiency and effectiveness, such as legal disenfranchisement. However, as we will see, at various points in time, dominant political actors in the United States have been constrained in their ability to employ legal voter restrictions. At those moments, political actors had to resort to other—less efficient and/or effective—tactics. I argue that which tactics they chose at those moments depended on which strategies faced relatively fewer constraints—politically, with respect to state capacity, and within the local political economy. In the following section, I use two historical case studies—the Reconstruction era and the Civil Rights era—to illustrate how my framework can help us reach a better understanding of vote repression efforts throughout American political development.
4. Empirical approach: comparative historical case studies
Existing research in American Political Development has demonstrated that a systematic comparison between Reconstruction and the Civil Rights era can be fruitful in understanding dynamics of (dis-)enfranchisement in the American context.Footnote 53 This paper follows in that tradition, using these two pivotal episodes as the empirical foundation for illustrating and assessing the repertoires-of-vote-repression framework. The case studies serve two complementary analytical purposes.
First, and primarily, the cases serve as illustrations of the framework. Reconstruction and the Civil Rights era constitute the two most prominent and well-documented moments of racial mass enfranchisement in American political history. As such, they provide exceptionally rich empirical material for demonstrating how the framework’s core tenet—that constraint constellations expand and contract vote repression repertoires—operates in practice. The analytical goal is not to produce causally identified estimates of the effects of individual tactics on voter participation and representation, but rather to construct causal narratives Footnote 54 that illuminate the historically specific conditions under which political actors selected particular repressive strategies over others.
Second, the cases function as a most-similar-systems comparison designed to investigate a clear empirical puzzle: why did racial mass enfranchisement—driven by the same basic dynamic of grassroots mobilization and federal intervention into the American South—produce divergent patterns of counter-mobilization across the two periods? Both episodes share significant structural similarities. In both cases, sustained grassroots activism by Black communities prompted substantial federal intervention into state-level electoral administration. In both cases, the federal government temporarily overrode the system of electoral federalism to extend formal political rights to African Americans. And in both cases, enfranchisement provoked intense counter-mobilization from white constituents and elites on the state level. Yet the nature of that counter-mobilization differed dramatically: widespread extra-legal violence during Reconstruction gave way to administrative stratagem and carceral expansion in the aftermath of the Civil Rights era. By holding constant the region, the racial hierarchy, the basic structure of federal intervention, and the motivation of dominant groups to repress, this comparison allows me to examine variation in the constellation of institutional constraints as the key explanatory factor for repression choices.
A distinctive feature of both cases that strengthens their analytical value is that enfranchisement in each instance was exogenously determined with respect to the subnational political actors whose choices I seek to explain. During both time periods, the federal government imposed franchise expansion on resistant Southern states from the outside—through the Reconstruction Acts and the Fifteenth Amendment in the first case, and through the VRA of 1965 in the second. While actors within Southern states, in particular Black communities, influenced the federal decision-making process in both instances, the timing and scope of enfranchisement were not primarily determined within the Southern states themselves.Footnote 55 This exogeneity is analytically valuable: it allows me to treat enfranchisement as a somewhat exogenous shock that triggered counter-mobilization, rather than as an endogenous outcome of the same political processes that produced the repressive responses I seek to explain.Footnote 56
My analysis centers on political developments in the American South. While vote repression is a nationwide issue, the South’s legacy of racial authoritarianism—rooted in the institution of slavery—has accorded it a distinct place in American political history.Footnote 57 Major federal interventions into state politics—from the Civil War and Reconstruction to the Civil Rights era—specifically targeted the South in an effort to dismantle its authoritarian enclaves. Even today, Southern states display more racially conservative tendencies,Footnote 58 reflecting historical patterns of racial exclusion and resistance to Black civil rights advancements. Consequently, the region serves as a compelling backdrop for examining how electoral federalism can enable minority vote repression in broader democratic contexts.
Using a comparative historical analysis approach,Footnote 59 I construct causal narratives for each historical period. I begin by demonstrating how bottom-up mobilization from marginalized groups, coupled with federal intervention into state-level election administration, produced a far-reaching expansion of voting rights for African American communities across the South. I also show that enfranchisement had tangible consequences for political power balances on the local and state level—in other words, however briefly, Black enfranchisement posed a threat to white political hegemony across the region. I then examine white counter-mobilization to rights expansion during both time periods. For each period, I carefully examine which repressive tactics were available (or not), and why political actors ultimately came to rely on diverging tactics to undermine and curtail voting rights for Black communities.
I rely on a variety of sources to support my argument, ranging from Census and other historical data, to primary sources such as Congressional reports and historic newspapers, to secondary historical literature. Whenever I present quantitative analyses, I use them to support macro-level causal narratives rather than to test specific causal claims.Footnote 60
5. Mass enfranchisement and vote repression in the post–civil war era
Reconstruction, the period following the American Civil War (1865–circa 1877), marked the first time since the Founding that the United States moved toward a more racially inclusive democracy as African American men gained voting rights. Thus, this period constitutes the first of two major moments of racial mass enfranchisement in American political history. In the following, I will first trace what led to Black enfranchisement during Reconstruction and document how it shifted political power across the United States South. Using the repertoire-of-repression framework, I will then discuss what factors shaped the nature of white counter-mobilization to enfranchisement during this era.
5.1. Black mass enfranchisement during Reconstruction
5.1.1. Mass mobilization for political rights during Reconstruction
The end of the Civil War freed nearly four million enslaved individuals, but Emancipation initially offered little more than freedom from bondage. Lincoln’s 1863 Proclamation and the Thirteenth Amendment, ratified in December 1865, abolished slavery but did not grant African Americans equal citizenship or political rights. Thus, emancipation resolved the issue of slavery, but left many other questions unanswered. As Republican lawmaker and future President James A. Garfield noted in July 1865,
What is freedom? Is it the bare privilege of not being chained, of not being bought and sold, branded and scourged? If this is all, then freedom is a bitter mockery, a cruel delusion.Footnote 61
For freedpeople, however, Emancipation promised not only autonomy from former enslavers, but also the chance for political inclusion, with voting rights seen as crucial to equal citizenship. As Frederick Douglass argued in February 1866,
If I were in a monarchial government (…) where the few bore rule and the many were subject, there would be no special stigma resting on me because I did not exercise the elective franchise (…) but here, where universal suffrage is the fundamental idea of Government, to rule us out is to make us an exception, to brand us with the stigma of inferiority.Footnote 62
During Presidential Reconstruction (1865–early 1867), however, hopes for political equality were met with disappointment. Denied the ballot, only a few Black politicians won state or local office in the 1865–1866 elections held across the South. Consequently, Southern state governments were dominated by white ex-Confederates, and Black political power remained limited. President Andrew Johnson, concerned about his 1868 election prospects, pursued a racially conservative “restoration” policy that favored Southern Democrats, welcomed ex-Confederates into political roles, and showed little concern for the political rights of freedmen.Footnote 63
Despite formal exclusion, freedpeople across the South mobilized bottom-up for political rights through local gatherings and statewide conventions in 1865 and 1866. The Bureau of Refugees, Freedmen, and Abandoned Land received countless letters and petitions from Black organizations and individuals, reflecting a strong “belief that the political order was at least partially open to black influence.”Footnote 64 By 1867, politics and universal suffrage had become “the principal focus of black aspirations.”Footnote 65
5.1.2. Federal intervention into state politics
Nationally, Republicans were concerned about their future, especially in the South. While the Thirteenth Amendment abolished slavery, it did not grant explicit political or civil rights. As such, freedpeople remained for the most part disenfranchised during Presidential Reconstruction, benefiting white Conservatives who dominated Southern politics with President Johnson’s support. Republicans recognized that, without Black citizenship and suffrage, their electoral prospects in upcoming elections would be bleak—both regionally and nationally.Footnote 66
In early 1867, after nearly 2 years of conflict with President Johnson, the Republican-led Congress ended his “restoration” agenda, ushering in the era of Radical Reconstruction (1867–1877). Congress implemented a progressive Reconstruction program, enacting the Fourteenth and Fifteenth Amendments to secure equal protection, citizenship, and universal suffrage for Southern freedmen. When the Fourteenth Amendment was passed, granting African Americans citizenship, their political weight increased at once by 66 percent as they would henceforth be counted as full persons for the purposes of apportionment in the House and the Electoral College.Footnote 67
For the Republican Party, it thus became all the more important to couple citizenship with Black suffrage in order to stay electorally competitive. Congress therefore redeployed the military to the South, charging it with dissolving Southern legislatures that had formed in 1865/1866 and replacing sitting governors with military appointees. In a large-scale effort, the military registered Black and white voters across the South, organized conventions to draft new state constitutions that granted universal manhood suffrage, and supervised new gubernatorial and legislative elections, mainly held in 1868.Footnote 68
5.1.3. Franchise expansion and shifts in political power
As a consequence of this unprecedented federal intervention into state politics, African American men were allowed to formally participate in elections for the first time. Hundreds of thousands of freedmen were registered to vote across the South (see Panel a) in Figure 1. Indeed, Black voters were in the majority in five Southern states, and made up 45 percent of registered voters in three more (Panel b) in Figure 1. Over the course of Congressional Reconstruction, Black people also held over 2,000 political offices on the local, state, and federal level for the first time ever.Footnote 69
State-Level Voter Registrations in 1868. (a) State-Wide Voter Registration Numbers and (b) Black vs. White Voter Registration Rates.

Figure 1 Long description
The stacked bar graph A includes a legend, Black Voters and White Voters. The x axis lists Alabama, Arkansas, Florida, Georgia, Louisiana, Mississippi, North Carolina, South Carolina, Texas, Virginia. The y axis label is Number of Registrations in 10000s, with tick labels 0, 5, 10, 15, 20. Percent labels above the bars read: Alabama 82.1 percent, Arkansas 54.0 percent, Florida 72.1 percent, Georgia 81.5 percent, Louisiana 81.5 percent, Mississippi 64.5 percent, North Carolina 83.9 percent, South Carolina 86.9 percent, Texas 64.5 percent, Virginia 84.7 percent. The stacked bar graph B includes a legend, Black Voters and White Voters. The x axis lists Alabama, Arkansas, Florida, Georgia, Louisiana, Mississippi, North Carolina, South Carolina, Texas, Virginia. The y axis label is Percentage of Total Registrations, with tick labels 0, 25, 50, 75, 100. Each bar contains two percentage labels. Alabama 63.0 percent and 37.0 percent. Arkansas 39.1 percent and 60.9 percent. Florida 57.5 percent and 42.5 percent. Georgia 49.7 percent and 50.3 percent. Louisiana 65.1 percent and 34.9 percent. Mississippi 56.7 percent and 43.3 percent. North Carolina 40.6 percent and 59.4 percent. South Carolina 63.2 percent and 36.8 percent. Texas 45.4 percent and 54.6 percent. Virginia 46.6 percent and 53.2 percent.
However, the impact of Black political power on local and state politics depended on the geographic concentration of Black communities. The higher the share of Black voters was in a given county, the more their vote would have affected the political power balance during Congressional Reconstruction.Footnote 70 Indeed, as panels (a) and (b) in Figure 2 illustrate, areas with a larger Black share of the population saw higher voter registration rates and reported higher turnout rates during the first gubernatorial elections held during Radical Reconstruction. These shifts in the mass electorate translated into significant gains for the Republican Party. Counties with more Black voters reported higher Republican vote shares in the 1868 gubernatorial race (panel c) in Figure 2.
Enfranchisement and Political Power in 1868. (a) Voter Registrations, (b) Turnout (Gubernatorial), (c) Republican Vote Share (Gubernatorial), and (d) Black Officeholders (1868).

Figure 2 Long description
A scatter plot with a fitted line and the text, Correlation: 0.41. The horizontal axis label is, Percent Black (1870), with values from 0 to 75. The vertical axis label is, Percent (Voting-age Males Registered in 1868), with values from 0 to 100. The plotted points form a cloud across the full horizontal range, with many points between 0 and 100 on the vertical axis. The fitted line slopes upward from left to right. The image B showing a scatter plot with a fitted line and the text, Correlation: 0.45. The horizontal axis label is, Percent Black (1870), with values from 0 to 75. The vertical axis label is, Gubernatorial Turnout, with values from 0 to 100. The plotted points form a cloud across the full horizontal range, with many points between 0 and 100 on the vertical axis. The fitted line slopes upward from left to right. The image C showing a scatter plot with a fitted line and the text, Correlation: 0.39. The horizontal axis label is, Percent Black (1870), with values from 0 to 75. The vertical axis label is, Republican Vote Share, with values from 0 to 100. The plotted points form a cloud across the full horizontal range, with many points between 0 and 100 on the vertical axis. The fitted line slopes upward from left to right. The image D showing a scatter plot with a fitted line and the text, Correlation: 0.33. The horizontal axis label is, Percent Black (1870), with values from 0 to 75. The vertical axis label is, Black Officeholders, with values from 0 to 30. Many plotted points lie on or near 0 on the vertical axis across the horizontal range. Additional points appear at higher vertical values, including points above 20. The fitted line slopes upward from left to right.
Black voters ultimately helped the Republican Party gain control over state-level political institutions in the first years of Congressional Reconstruction. All states of the former Confederacy elected Republican governors in the first gubernatorial election held after their state constitutional conventions. As Table 3 shows, the Republican Party also gained control of Southern state legislatures after the first elections held during Congressional Reconstruction. With the exception of Virginia and the Georgia House of Representatives, Republicans won majorities, and often super-majorities, in both lower and upper chambers all across the South.
Republican Share of State Legislative Seats, 1867–1869

Table 3 Long description
State by state counts list total seats and Republican seats, with percentages, for the Senate and the House in years 1867 to 1869. Alabama in 1868 has 33 Senate seats with 32 Republican and 100 House seats with 97 Republican. Arkansas in 1868 has 26 Senate seats with 21 Republican and 82 House seats with 79 Republican; Florida in 1868 has 24 Senate seats with 16 Republican and 52 House seats with 37 Republican. Georgia in 1868 has 44 Senate seats with 26 Republican and 170 House seats with 84 Republican; Louisiana in 1868 has 36 Senate seats with 20 Republican and 101 House seats with 56 Republican. Mississippi in 1869 has 33 Senate seats with 26 Republican and 107 House seats with 82 Republican; North Carolina in 1868 has 50 Senate seats with 38 Republican and 120 House seats with 82 Republican. South Carolina in 1868 has 31 Senate seats with 25 Republican and 124 House seats with 110 Republican; Tennessee in 1867 has 25 Senate seats with 25 Republican and 83 House seats with 83 Republican. Texas in 1869 has 30 Senate seats with 19 Republican and 90 House seats with 54 Republican; Virginia in 1868 has 43 Senate seats with 13 Republican and 138 House seats with 41 Republican.
Counties with larger shares of Black voters also produced more Black legislators following 1868, thus effectively translating minority votes into minority representation on the elite level (see panel d) in Figure 2. And indeed, Black descriptive representation led to substantive policy changes in the form of increased spending on Reconstruction policies such as expanding access to primary education—one of the key demands of Black communities.Footnote 71
In sum, at least temporarily, the franchise expansion that Congressional Reconstruction brought on dramatically shifted the political power balance in favor of the Republican Party and accorded greater representation—both descriptive and substantive—to Black voter groups.
5.2 White counter-mobilization during Reconstruction
Both Emancipation and Black enfranchisement during Reconstruction caused a seismic shift in Southern race relations. Most Southern whites rejected the very notion of Black equality, echoing the sentiments expressed by the Speaker of Virginia’s House of Representatives in 1866 before Congress:
There is no unkind feeling towards the negro in a position where he is not asserting equality; but the best friend a negro ever had in the world, the kindest friend he ever had, a young boy or girl raised by a negro mammy, and devotedly attached to her, would become ferociously indignant if the old mammy were to claim equality for a moment.Footnote 72
The racially progressive agenda put forward by Congress under Radical Reconstruction only intensified whites’ perceived status loss and led to ferocious outrage. In August 1867, a few months before the first racially inclusive elections were to be held in Alabama, the state’s leading Democratic newspaper, the Mobile Advertiser and Register, proclaimed in an editorial:
If a colored man joins and votes and acts with a party that proposes to disfranchise me, a white man, and threatens not only to degrade me from my political freedom, but to rob me of my property and means of earning a living, (…) there are a thousand instincts of human nature to cause me to hold him as an enemy to be antagonized, opposed, fought and overcome.Footnote 73
These transformations in the Southern racial order therefore led to significant counter-mobilization from white Southerners, both among the masses and elites. However, as they sought to suppress voting rights and Black votes, white political actors initially faced a relatively contracted repertoire of vote repression—until Reconstruction ended and national attention to the South subsided.
5.2.1. Institutional mechanisms for vote repression during Reconstruction
During Congressional Reconstruction, Southern states faced significant political constraints in counteracting federal enfranchisement through institutionalized means. The Reconstruction Acts redeployed the military to the South, dissolved governments formed under Presidential Reconstruction, and mandated new constitutional conventions and re-elections. Southern states had to comply with these measures for readmission to the Union. Many white Southerners begrudgingly saw compliance as the only path forward, hoping cooperation would eventually allow them to restore their political control, as noted by the Charlottesville Chronicle in March 1867:
There are three courses for the Legislature to take: the first is to fight. The second is to fold arms and do nothing. The third is to call a State convention. (…) We are therefore, for a convention—at once. It is not worth while to resist the deluge; (…) The immediate aim of our State should be to get back in the Union as quickly as possible. There we shall be measurably at least shielded from the Radical storm. (…) there we can get control of our State affairs; there we can make another State constitution.Footnote 74
But in many states, it took several years for white supremacists and the Democratic Party to regain power. With support from newly enfranchised Black voters, the Republican Party secured significant electoral victories across the South, winning governorships and legislative majorities in the 1868 and 1869 elections (Table 3).
Republican-controlled governments passed legislation and amended state constitutions to enforce and protect minority voting rights. During Presidential Reconstruction, state constitutions restricted voting to white men—largely a legacy of antebellum voting rules.Footnote 75 Under the Reconstruction Acts of 1867, states were required to hold new constitutional conventions, supervised by the Union military and involving many Black delegates, to define Black men’s voting rights and disqualify some white voters based on war participation and loyalty oaths (see TRAX Annotation A.1). Notably, these rights were initially enforced by military troops across the South,Footnote 76 and attempts to resist Black political power were initially halted by the courts.Footnote 77
Because of this lack of control over state political institutions as well as federal protections through military intervention, Democratic elites were also unable to exploit subtler institutional vote repression mechanisms that fall under the category of “electoral protectionism,” such as manipulating electoral rules or eliminating elected offices altogether. Indeed, under Republican leadership, many states actually expanded the electoral landscape, adding a significant number of local and state-level elected offices that came to benefit the Republican Party, including many Black officeholders.Footnote 78
Notably, early attempts to undermine the meaning of freedom came in the form of legal reforms to state-level criminal codes, which typically occurred during Presidential Reconstruction when Southern governments were dominated by white ex-Confederates. These reforms are often referred to as “Black Codes,” due to their unequal enforcement against freedpeople.Footnote 79 Vagrancy, fencing, and hunting laws were meant to criminalize everyday behaviors and commonly served two purposes. First, they were used to restrict African American labor market mobility. The landed planter class in particular saw their wealth and fortune dwindle with Emancipation, at least temporarily.Footnote 80 In order to keep their land farmed, they were in desperate need of farm hands. Vagrancy laws in particular were used to force Black people into short-term labor contracts as failing to provide proof of employment could land you in jail.Footnote 81 As such, Black Codes became a vehicle for labor control.
Second, the Black Codes were used as a social control mechanism. Emancipation stirred up fears of racial upheaval and retaliation from the freedpeople. Newspapers all over the South warned about potential “negro insurrection,” often instigated by Northern radicals, as “[t]he Jacobins in Congress have succeeded in making the negro believe that the whole of this country is his property, and that the white man is nobody, whom the angelic nigger can destroy at his pleasure.”Footnote 82 Through provisions in the Black Codes, Southern criminal justice systems helped diminish notions of racial equality and undermine the meaning of freedom.
But the extent to which Southern criminal punishment systems could be used for vote repression specifically remained limited, for a number of reasons. First, using incarceration to remove voters would have required political control over the state’s penal system, which ex-Confederate whites had lost at the beginning of Congressional Reconstruction. Indeed, some of the more egregious provisions of the Black Codes were left unenforced by law enforcement or repealed entirely during Congressional Reconstruction.Footnote 83
Second, scaling incarceration to repress votes would have required substantial carceral infrastructure, which many states lacked by the end of the Civil War.Footnote 84 Lastly, a carceral response to mass enfranchisement at this juncture was severely constrained by labor market dynamics in the political economy of the postbellum South as white landowners continued to rely on Black sharecroppers and tenant farmers until well into the twentieth century.Footnote 85
In sum, institutional vote repression via legal, administrative, or coercive means faced severe political constraints at the beginning of Congressional Reconstruction due to lack of local political control as well as federal military intervention. Additionally, institutional coercion through incarceration was limited by state capacity constraints and labor market dynamics. Thus, the institutional repertoire of vote repression available to dominant political actors was significantly contracted, at least for a short period.
5.2.2. Non-institutional mechanisms of vote repression during Reconstruction
Despite these institutional barriers to vote repression, Southern white people recognized power in numbers. As the Charlottesville Chronicle of Virginia wrote in March of 1867,
There are 600,000 whites in Virginia. We can control the State; we can guide, if we cannot arrest, the storm. And the more rapid our movements the more complete will be our master ships of the situation. Wait—and wait—and wait, and the Radicals will organize the negroes against us.Footnote 86
However, attempts to dilute the impact of Black suffrage by mobilizing white voters had limits. In Mississippi and South Carolina, Black people were the majority, and in Louisiana, they matched white numbers. In five other Reconstruction states, they comprised over 40 percent of the population, creating many majority-minority districts where Black voters held significant electoral sway.Footnote 87 As Table 4 illustrates, this concentration of Black voters was particularly consequential at the county level. In Louisiana and South Carolina, over 60 percent of counties had Black majority populations, and Mississippi was nearly evenly split, with just over half of its counties majority-Black. Even in states with lower overall Black population shares, such as Virginia and Georgia, roughly 40 percent of counties were majority-Black. This mattered enormously for the distribution of state political power: because state House seats were closely tied to counties under the apportionment schemes of the era,Footnote 88 majority-Black counties translated—at least in principle—into legislative seats that Black voters and their Republican allies could contest and win.
Distribution of Counties by Black Population Share, 1870 (% of Counties per State)

Table 4 Long description
Percent of counties in each listed state are grouped by Black population share into 0 to 30 percent, 31 to 50 percent, and over 50 percent, with total counties shown. Alabama has 46.9 percent in 0 to 30 percent, 18.8 percent in 31 to 50 percent, and 34.4 percent over 50 percent, total 64 counties. Arkansas has 65.6, 21.3, and 13.1 percent, total 61; Florida has 53.8, 25.6, and 20.5 percent, total 39; Georgia has 36.4, 22.7, and 40.9 percent, total 132. Louisiana has 13.7, 25.5, and 60.8 percent, total 51; Mississippi has 23.0, 26.2, and 50.8 percent, total 61; North Carolina has 41.6, 39.3, and 19.1 percent, total 89. South Carolina has 6.5, 25.8, and 67.7 percent, total 31; Texas has 64.0, 27.3, and 8.6 percent, total 155; Virginia has 33.0, 26.2, and 40.8 percent, total 103.
What is more, the Congressional Reconstruction Acts as well as several of the newly ratified state constitutions put qualifications on white voting rights, either in the form of exclusions based on prior involvement in the rebellion or through loyalty oath requirements. These policies, while temporary, created additional barriers to large-scale white electoral mobilization in the face of Black franchise expansion.Footnote 89
In sum, diluting minority votes through non-institutional and nonviolent channels such as white electoral mobilization also had limited success as voting rights expansion to freedmen and qualified suffrage for white men had tilted the electoral landscape toward the Republican Party.
5.2.3 The last resort: violence and racial terror during Reconstruction
In the end, extra-legal violence became one of the few mechanisms available to white political actors to intimidate newly enfranchised voters. The rise of the Ku Klux Klan (KKK) and White Voter Leagues further escalated racial violence. Founded in December 1865, the Klan initially emerged as a social club for Confederate veterans, but quickly transformed into a violent white supremacist organization.Footnote 90 After 1867, as Congressional Reconstruction took hold, the Klan and similar groups rapidly gained membership, using terror tactics to oppose the changes in the Southern racial order. Their violent actions included systematic efforts to suppress African Americans’ participation in political life, particularly their right to vote.Footnote 91
Data on mob violence during Reconstruction are scarce and unreliable.Footnote 92 Consequently, estimates vary, focusing primarily on severe violence such as lynchings and murders. Historians point to over 50,000 Black murders during this era, while the Equal Justice Initiative has documented approximately 2,000 lynchings between 1865 and 1876.Footnote 93 In addition to lethal violence, harassment and intimidation of freedpeople were widespread throughout the period. This prompted President Grant to warn Congress in early 1871, noting that “a condition of affairs now exists in some of the States of the Union rendering life and property insecure, and the carrying of mails and the collection of revenue dangerous,”Footnote 94 and urging Congress to take action to enforce the law and secure the safety of citizens.
Congress responded with the most ambitious federal civil rights enforcement effort in the nation’s history to that point. Three Congressional enforcement acts, passed between 1870 and 1871, constructed a legal architecture designed to protect Black voting rights from both official discrimination and private violence. The Civil Rights Act of 1870 prohibited race-based interference with the right to vote and authorized federal prosecution of election officials who denied Black citizens access to the ballot. A second act, passed in February 1871, extended federal oversight to the administration of congressional elections. The most sweeping measure—the KKK Act of April 1871—empowered the president to deploy armed forces against those denying equal protection and suspend habeas corpus in areas of open Klan activity. In the early years of this enforcement regime, the federal government achieved some measurable results: hundreds of Klan members were indicted and convicted in federal courts, and the combination of prosecutions and military presence produced a temporary, albeit imperfect, check on organized racial violence.Footnote 95
Along with this act, Congress also created a Joint Select Committee with the express purpose to “inquire into the condition of the late insurrectionary States, so far as regards the execution of laws and the safety of the lives and property of the citizens of the United States.”Footnote 96 In its investigation, detailed in a report over 7,000 pages long,Footnote 97 the Committee found that “the execution of laws and the security of life and property were most seriously threatened by the existence and acts of organized bands of armed and disguised men, known as the Ku Klux.”Footnote 98 In addition, the Congressional inquiry revealed that a great deal of violence was used with the deliberate intent to intimidate voters and deter them from exercising their suffrage rights. As General Howard observed in Georgia as early as 1868:
Numerous outrages have been perpetrated upon freed people in this state, some of them remarkable for atrocity. In this State, also, freedmen have been discharged and driven from their homes for voting contrary to the wishes of their employers. White men have also been abused for the manner in which they have exercised the right of suffrage.Footnote 99
Witness statement after witness statement confirmed the suspicion that politically targeted violence reduced turnout and tilted elections in favor of the Democratic Party. James M. Moss, a white Republican farmer from Madison County, Alabama, summarized this “chilling effect” as follows in his interview with committee members in Huntsville, Alabama, on October 13, 1871:
Question. And [did the Klan seek] to influence negroes to vote for the Seymour and Blair ticket?
Answer. Yes, sir; or to stay away, either to not vote at all or vote that way.
Question. If all persons, black and white, were allowed freedom to express their sentiments at the ballot-box in Madison County, at this time, what in your opinion would be the republican majority?
Answer. From twelve to fifteen hundred.
Question. Do you believe that the colored people at this time are intimidated from voting their real sentiments?
Answer. I don’t doubt it at all.Footnote 100
The Joint Committee’s investigation documented the scale of the crisis and re-emphasized the necessity of the Enforcement Acts for protecting Black suffrage and political power. However, the enforcement machinery Congress had built in the early 1870s was soon to be dismantled by the courts. By the mid-1870s, the Supreme Court had issued a series of rulings that systematically narrowed the constitutional foundations of the Enforcement Acts, hollowing out the voting and civil rights protections they were meant to provide. In 1876 in United States v. Reese (92 U.S. 214), the first major voting rights case under the Fifteenth Amendment, Chief Justice Morrison Waite wrote for an eight-to-one majority that the Fifteenth Amendment “does not confer the right of suffrage upon any one.”Footnote 101 Because the relevant sections of the Enforcement Act punished the wrongful denial of any vote—not only denials motivated explicitly by race—the Court held that Congress had exceeded its constitutional authority. Federal prosecutors were henceforth required to prove, affirmatively, that an official had acted with demonstrable racial motivation; since election officials could simply avoid invoking race explicitly while still discriminating, the ruling made it nearly impossible to prosecute most voting rights violations at the federal level.
The companion ruling issued the same day foreclosed the remaining avenue for federal intervention. United States v. Cruikshank (92 U.S. 542) arose directly from the Colfax Massacre of April 1873, in which a white paramilitary force killed approximately one hundred Black Republicans in Grant Parish, Louisiana. Federal prosecutors charged the perpetrators under the Enforcement Act for conspiring to deprive Black citizens of their constitutional rights. The Supreme Court overturned the convictions entirely. Writing for the Court, Chief Justice Waite held that “[t]he fourteenth amendment prohibits a State from depriving any person of life, liberty, or property, without due process of law; but this adds nothing to the rights of one citizen as against another.”Footnote 102 The constitutional amendments, the Court ruled, protected citizens from government action—not from private individuals. Acts of racial terror perpetrated by privately organized groups were therefore state offenses, not federal ones, and since Southern state governments would not prosecute their own partisans for racial terror, Cruikshank effectively constitutionalized impunity for precisely the kind of politically targeted vigilante violence documented by the Joint Committee a few years earlier.Footnote 103 Taken together, the rulings in Reese and Cruikshank did not merely weaken the Enforcement Acts—they legally expanded the space for non-institutional violence by removing the principal federal constraint on it.
The erosion of judicial protection was accompanied by a parallel collapse of political will within the Republican coalition. Many moderate white Republicans, who had reluctantly supported Black suffrage, came to believe that continued advocacy for civil rights harmed their party, especially in the South. Meanwhile, white Republican yeoman farmers resented the higher taxes that arose from Reconstruction policies.Footnote 104 Even radical reformers feared that reliance on federal protection would render their communities “wards of the nation” and instead promoted self-reliance.Footnote 105 Military occupation, which had initially provided some measure of protection from racial terror, had meanwhile become politically and fiscally untenable. While the Compromise of 1877 formally removed the last remaining federal troops from the South, military withdrawal had in practice begun in the early 1870s as troops were increasingly needed for escalating warfare with Native American nations in the West.Footnote 106
The result was a simultaneous collapse of both enforcement pillars that had, however imperfectly, constrained racial terror during the early Reconstruction years. The Supreme Court had eliminated the legal basis for federally prosecuting discriminatory officials (Reese) and private violent actors (Cruikshank) alike, while the withdrawal of federal troops removed the last material check on organized violence. Constitutional rights without judicial remedy or military protection were, in practice, no rights at all. As federal actors found themselves unable—and increasingly unwilling—to enforce the Reconstruction amendments, the conditions were set for the systematic institutional disenfranchisement that would define the decades to come.
***
In sum, institutional mechanisms for vote repression faced significant political obstacles and state capacity constraints at the beginning of Congressional Reconstruction. Southern white political actors lacked access to the levers of institutional repression along two distinct dimensions. First, Congressional Reconstruction had directly displaced them from the state and local offices through which discriminatory electoral rules are typically designed and enforced—the very institutional positions required to implement legal or administrative vote restrictions. Second, even where residual institutional footholds remained, active federal enforcement foreclosed their use: military occupation provided a direct material check on would-be disenfranchisers, while the Enforcement Acts created federal criminal liability for election officials who denied Black citizens access to the ballot. As such, white political actors who sought to walk back the political gains brought on by Congressional Reconstruction had to resort to non-institutional tactics to suppress votes. Extra-legal violence, perpetrated by white supremacist vigilante groups such as the KKK, became one of the few alternative strategies available. While data limitations make it difficult to determine the overall effect of such violence on electoral outcomes, the historical record nevertheless suggests that targeted voter harassment was quite effective at suppressing votes. As Reconstructions progressed and the federal government found itself unable—and increasingly unwilling—to adequately protect Black communities from white racial terror, the Southern Democratic Party was consequently able to gain electorally once more, thus accelerating the end of Reconstruction.Footnote 107
5.3 The end of Reconstruction and the rise of legal disenfranchisement
Historians view the Compromise of 1877, which settled the disputed 1876 Presidential election, as the formal end of Congressional Reconstruction.Footnote 108 Democrats agreed to concede the presidency to Republican Rutherford B. Hayes on the condition that any remaining federal troops be withdrawn from the South. Left to self-govern, white Redeemer governments worked swiftly to reinstate racial hierarchies and roll back Reconstruction-era policies and civil rights gains.
Restricting the Black franchise was central to these “Redemption” efforts. With the end of direct federal intervention and declining Republican competition, political constraints on vote repression lifted, expanding Southern actors’ repressive repertoire. White Southerners continued to use extra-legal violence to intimidate Black voters during election years.Footnote 109 Similarly, in the years following Reconstruction, vote suppression initially relied on voter fraud and ballot box laws.Footnote 110 The relationship between extra-legal violence and fraud on the one hand and the rise of legal disenfranchisement on the other can be best described as co-constitutive during this time period: extra-legal violence and voter intimidation, in conjunction with voter fraud, allowed would-be disenfranchisers to reclaim power over the very political institutions that were critical to passing more efficient legal vote restrictions.Footnote 111
By the 1890s, Southern states moved to lock in these gains through constitutional revision, encoding literacy tests, poll taxes, grandfather clauses, and residency requirements into state constitutions that were facially race-neutral but designed in practice to eliminate Black electoral participation. The Supreme Court provided the decisive judicial sanction for this project in Williams v. Mississippi (170 U.S. 213) in 1898. Henry Williams, a Black man convicted for murder by an all-white jury in Mississippi, challenged the state’s 1890 constitutional provisions on the grounds that their administration systematically excluded Black citizens from voting and jury service in violation of the Fourteenth Amendment. The Court, in a unanimous opinion, held that the provisions did not discriminate on their face, and that the mere possibility of discriminatory administration was not grounds for invalidating them.Footnote 112 By ruling that facially neutral restrictions were constitutionally permissible even when their discriminatory intent and effect were openly acknowledged, the Court effectively completed what Reese had begun two decades earlier: closing off every viable avenue of federal challenge to the emerging Jim Crow electoral order.
The Williams ruling was immediately understood as a template, and Southern states moved swiftly to replicate Mississippi’s constitutional provisions.Footnote 113 By the late 1890s, legal measures like literacy tests, poll taxes, grandfather clauses, and other supposedly “race-neutral” Jim Crow laws had effectively disenfranchised the majority of Black voters (as well as a significant number of white voters).Footnote 114 Any remaining hope that the federal judiciary might intervene to remedy this systematic disenfranchisement was extinguished in Giles v. Harris (189 U.S. 475) in 1903. Jackson Giles, president of the Colored Men’s Suffrage Association of Alabama, brought suit on behalf of more than five thousand Black residents of Montgomery County who had been arbitrarily refused voter registration despite meeting all constitutional qualifications. Justice Oliver Wendell Holmes, writing for a six-to-three majority, declined to order relief. While accepting that Alabama’s registration scheme was a fraudulent conspiracy to disenfranchise Black citizens, Holmes concluded that judicial remedy was futile: “[t]he bill imports that the great mass of the white population intends to keep the blacks from voting. … If the conspiracy and the intent exist, a name on a piece of paper will not defeat them.”Footnote 115 Relief from a political wrong of such scale, Holmes wrote, “must be given by them [state governments] or by the legislative and political department of the government of the United States”—the very institutions that had by then abandoned any commitment to enforcing Black voting rights. Giles thus completed a judicial arc stretching from Reese and Cruikshank in 1876 through Williams in 1898: a Supreme Court that had first gutted the legal tools for protecting Black voters, then blessed the instruments of their legal disenfranchisement, and finally declined to remedy even an openly acknowledged constitutional violation.
Simultaneously, political constraints on other repressive tactics had also vanished by the 1890s. Beyond legal suffrage restrictions, the new Jim Crow constitutions weakened local authorities and converted many local elected offices into appointed ones, which gave state legislatures and governors more control.Footnote 116 Indeed, centralizing power to the state level required policymakers in majority-minority counties to seek approval from racially conservative state legislatures for local policy changes. White elites also pursued what Greenberger calls “compartmentalized authoritarianism,”Footnote 117 selectively diluting minority voting power in localities where Black voters carried more political weight, while leaving others more democratic. For example, new apportionment schemes for state and federal offices often accorded outsized weight to rural Black Belt counties—localities with large Black populations where minority disenfranchisement benefited white planter elites.Footnote 118
Constraints on incarceration also began to ease as Southern Democrats regained control over political institutions and scaled carceral capacity through convict leasing, which was more cost-effective than conventional prison systems.Footnote 119 However, a carceral response to mass enfranchisement remained constrained by labor market demands in the postbellum political economy across the South. While Emancipation had ended chattel slavery, planters across the South continued to rely on Black labor to farm their land through new labor arrangements such as sharecropping or tenant farming, thus reasserting co-dependence between white capital and Black labor in the postbellum decades.Footnote 120 This helps explain why incarceration was not strategically used as a vote repression tactic at this juncture—even after political and state capacity constraints eased: Incarceration would have removed not just voters from the electorate, but also workers from the labor market. Indeed, as Figure 3 shows, while incarceration increased in the decades following the Civil War, Southern Black imprisonment rates remained notably lower throughout this time period—both relative to Northern states at the time and certainly by today’s margins.Footnote 121
Black Imprisonment Rates per 100,000: North vs. South (1870–1940).

***
In sum, while the demise of Reconstruction and the rise of Redeemer governments shifted the political opportunity structure in favor of a number of potential vote repression tactics, political actors in the post-Reconstruction era eventually came to rely on the most efficient strategy in their expanded repression repertoire: legal vote restrictions that were codified by statutes and constitutional reforms.Footnote 122
6. Mass enfranchisement and vote repression during the Civil Rights era
After Reconstruction had ended and Jim Crow had taken roots, nearly a century passed before voting rights for Black Americans would become a national issue once more. The Civil Rights movement of the 1960s spurred a second moment of racial mass enfranchisement, supported once again by federal intervention into state politics that significantly expanded voting rights. As in the Reconstruction case study, I will first document what gave rise to Black enfranchisement in the mid-twentieth century and show how it once again upended existing political power constellations. I will then examine what shaped the nature of white counter-mobilization during this era.
6.1. Black mass enfranchisement during the Civil Rights era
6.1.1. The Civil Rights movement and grassroots mobilization for voting rights
By the early 1900s, civil rights activists had begun to mobilize against the system of racial segregation and political exclusion that white Redeemer and Jim Crow governments had put in place across the South. The National Association for the Advancement of Colored People (NAACP) formed in 1909, followed by the American Civil Liberties Union (ACLU) in 1920. While it would take six decades for their efforts to come to full fruition, these organizations grew steadily. By the end of WWII, the NAACP counted over 1,000 branches and close to 400,000 members.Footnote 123
Led by civil rights lawyers, these organizations sought to dismantle Jim Crow through both advocacy in Washington, DC, and legal action in the Courts. Initially, NAACP activism was focused on anti-lynching campaigns, but over time discriminatory voter restrictions, commonplace across much of the South, became a primary target of the organization.Footnote 124 In 1944, in a significant victory for the NAACP, the Supreme Court struck down the white primary system in Smith v. Allwright (321 U.S. 649), which led to the first gradual expansion in voting access for Black Southerners.Footnote 125
By the 1960s, legal organizations were joined by grassroots groups, such as the Southern Christian Leadership Conference (SCLC), the Voter Education Project of the Southern Regional Council, and the Student Nonviolent Coordinating Committee, which in 1964 sent college students from across the country into Mississippi to register voters during what would become known as the “Freedom Summer.” Together, these groups mounted an intensive local campaign to expand minority access to the voting booth.
In November 1964, shortly after Lyndon B. Johnson’s landslide victory, the SCLC, led by Reverend Martin Luther King, decided to concentrate efforts on Selma, Alabama, where white resistance to Black voter registration was particularly intense. Tensions between grassroots activists and white officials escalated in March 1965 when protesters planned a voting rights march from Selma to Montgomery. Alabama Governor George Wallace banned the march and ordered state troopers to stop it with all means necessary. On March 7, defying the ban, 600 protesters set off and were forcefully driven back by law enforcement on the Edmund Pettus Bridge in an event known as “Bloody Sunday.”Footnote 126 The brutal spectacle of Selma, which had been broadcast across the nation, shifted national focus to voting rights reform, creating a window of opportunity for passing the first comprehensive voting rights legislation in nearly a century.
6.1.2. The VRA of 1965: federal oversight of state election procedures
Congressional action on Civil Rights between the two Reconstructions had focused primarily on anti-lynching initiatives.Footnote 127 Most anti-lynching bills failed, but they nevertheless brought federal attention to racial oppression in the region and helped raise the profile of civil rights organizations like the NAACP and ACLU in Washington.
By the 1950s, Congress began to turn its attention to voting rights and enacted several laws to protect suffrage and enhance voting access in the South. In 1957, President Eisenhower signed the first major civil rights legislation since Reconstruction, establishing a federal Commission on Civil Rights and authorizing the U.S. Attorney General to seek court injunctions to protect voting rights.Footnote 128 The Civil Rights Act of 1960 allowed for the appointment of voting referees and required local registrars to maintain voting records.Footnote 129 The 1964 Civil Rights Act, primarily aimed at ending segregation, also banned unequal voter registration practices.Footnote 130 Although these laws expanded voting access, they remained haphazard as they put the burden on voters to file individual court complaints for voting rights violations, which were often delayed or ignored in Southern courts with racially conservative judges.
On March 15, 1965, a week after the violent crackdown on protesters in Selma, President Lyndon B. Johnson proposed sweeping federal voting rights legislation to Congress. In an address later that night, President Johnson emphasized the historical significance of this moment:
At times, history and fate meet at a single time in a single place to shape a turning point in man’s unending search for freedom. So it was at Lexington and Concord. So it was a century ago at Appomattox. So it was last week in Selma, Alabama.Footnote 131
Reformers in Congress were well aware of the shortcomings of the first Reconstruction, in particular when it came to the protection of voting rights through the Fifteenth Amendment, and were determined to make the 1965 VRA “impervious to all legal trickery and evasion.”Footnote 132 As such, the VRA not only abolished legal barriers to voting such as literacy tests or similar devices. Section 5 of the VRA also required certain jurisdictions—the vast majority of them Southern states and counties—to clear any changes to electoral rules and voting requirements with the U.S. Department of Justice (see Appendix B.5 for an overview of covered jurisdictions). The preclearance provision thus accorded the federal government unprecedented and prophylactic oversight of Southern electoral rules.
6.1.3. Franchise expansion and shifts in political power
Similar to the first Reconstruction, the franchise expansion brought on by the VRA of 1965 transformed the electorate across the South. Voter registrations jumped sizably within just a few years (see Figure 4). In Mississippi, for example, where less than 50 percent of the voting-age population was registered to vote in 1964, registration rates had increased to nearly 80 percent during the 1968 election cycle (see Panel a) in Figure 4.
State-Level Voter Registrations, Pre- vs. Post-VRA. (a) State-Wide Voter Registration Numbers and (b) Black Voter Registration Rates.

Figure 4 Long description
A grouped bar graph with the legend text, race, Black Voters, White Voters. The vertical axis label reads, Number of Registrations (100,000s), with tick labels 0, 10, 20, 30. The horizontal axis lists paired categories for each state: Alabama Pre, Alabama Post, Arkansas Pre, Arkansas Post, Florida Pre, Florida Post, Georgia Pre, Georgia Post, Louisiana Pre, Louisiana Post, Mississippi Pre, Mississippi Post, North Carolina Pre, North Carolina Post, South Carolina Pre, South Carolina Post, Tennessee Pre, Tennessee Post, Texas Pre, Texas Post, Virginia Pre, Virginia Post. Percentage labels above the bars read, 55.1 percent, 79.6 percent, 60.7 percent, 70.6 percent, 71.2 percent, 78.7 percent, 53.7 percent, 73.1 percent, 66.4 percent, 83.3 percent, 47.0 percent, 79.5 percent, 85.9 percent, 76.1 percent, 64.4 percent, 72.8 percent, 72.4 percent, 79.3 percent, 54.3 percent, 57.4 percent, 61.9 percent. The bars are grouped by state and period, with two bars per category corresponding to the legend entries Black Voters and White Voters. The image B showing a grouped bar graph with the legend text, Period, Pre, Post. The vertical axis label reads, Registration Rate (percent), with tick labels 0, 25, 50, 75, 100. The horizontal axis labels read, Alabama, Arkansas, Florida, Georgia, Louisiana, Mississippi, North Carolina, South Carolina, Tennessee, Texas, Virginia. Value labels above the paired bars read: Alabama 19.3 percent and 51.6 percent; Arkansas 40.4 percent and 62.8 percent; Florida 51.2 percent and 63.6 percent; Georgia 27.4 percent and 52.6 percent; Louisiana 31.6 percent and 58.9 percent; Mississippi 6.7 percent and 59.8 percent; North Carolina 46.8 percent and 51.3 percent; South Carolina 37.3 percent and 54.0 percent; Tennessee 69.5 percent and 71.7 percent; Texas 61.4 percent and 61.8 percent; Virginia 38.3 percent and 55.6 percent. The bars are paired by state, with one bar for Pre and one bar for Post. Across the two graphs, the state categories match and the period labels Pre and Post appear in both. In the registration rate graph, Post is higher than Pre for Alabama, Arkansas, Florida, Georgia, Louisiana, Mississippi, North Carolina, South Carolina, Tennessee and Virginia and is close in value for Texas. The lowest Pre value shown is Mississippi at 6.7 percent and the highest Post value shown is Tennessee at 71.7 percent. In the registration count graph, percentage labels range from 47.0 percent to 85.9 percent, with 85.9 percent appearing over North Carolina Post and 47.0 percent appearing over Mississippi Pre.
While the VRA also lifted voting restrictions for the white electorate, thus leading to increases in white registration rates, Black communities experienced the most dramatic gains in registrations. Black registration rates increased between 2.2 percentage points in Tennessee and 53.1 percentage points in Mississippi between 1964 and 1968. In Mississippi, the changes were particularly stark as only 6.7 percent of the Black voting-age population was registered to vote in 1964.
Still, one might argue that minority enfranchisement in the 1960s posed a less pertinent threat to white political hegemony than it did in the 1860s. The Great Migration—the mass movement of Black Southerners to Northern cities across the first half of the twentieth century—had reduced Black population shares in ex-Confederate states by an average of nearly 18 percentage points between 1870 and 1960.Footnote 133 Yet, as Table 5 illustrates, state-level averages obscure substantial county-level variation in Black political weight: in Mississippi, nearly a third of counties remained majority-Black in the 1960s; in five other states, more than 40 percent of counties retained Black population shares above 30 percent. As counties remained the relevant political unit for the purposes of state and federal legislative apportionment up until the 1960s, minority enfranchisement remained highly consequential for political power balances—in particular in Black Belt counties where white elites had benefited the most from Black political exclusion (see also Appendix B.6).Footnote 134
Distribution of Counties by Black Population Share, 1968 (% of Counties per State)

Table 5 Long description
Percent of counties per state are grouped by Black population share in three categories, 0 to 30 percent, 31 to 50 percent, and above 50 percent, with a total county count for each state. Alabama lists 56.1 percent in 0 to 30 percent, 28.8 percent in 31 to 50 percent, and 15.2 percent above 50 percent, total counties 67. Arkansas lists 73.0, 23.0, and 4.1, total 75; Florida lists 90.6, 6.2, and 3.1, total 67; Georgia lists 44.7, 40.9, and 14.5, total 159. Louisiana lists 49.2, 37.7, and 13.1, total 70; Mississippi lists 32.9, 36.6, and 30.5, total 82; North Carolina lists 60.0, 35.0, and 5.0, total 100. South Carolina lists 30.4, 43.5, and 26.1, total 46; Tennessee lists 92.6, 5.3, and 2.1, total 95; Texas lists 94.5, 5.1, and 0.4, total 254; Virginia lists 65.5, 25.0, and 9.5, total 130. Across states, the 0 to 30 percent category is the largest share for most states, while the above 50 percent category reaches its highest values in Mississippi and South Carolina.
Moreover, the broader transformation of Southern politics in the mid-twentieth century rendered Black enfranchisement potentially consequential for electoral coalitions. The white Southern electorate was fracturing along class and racial lines by the 1960s, with economic modernization driving upper-income whites toward the Republican Party while racial conservatism pulled working-class whites toward Wallace-style insurgent politics.Footnote 135 This fragmentation meant that a newly mobilized Black electorate, even at somewhat reduced population shares, could prove pivotal in an increasingly competitive electoral environment.Footnote 136 This prospect for cross-class coalitions likely contributed to new vote repression attempts in the aftermath of the VRA.
Indeed, the empirical record shows exactly how consequential these changes in the electorate were for Southern politics. The addition of newly enfranchised African Americans affected turnout rates in elections following 1965. As Panel (a) in Figure 5 shows, counties with a larger share of African Americans saw larger increases in turnout in the 1968 Presidential elections, relative to the 1964 elections. Over time, these increases in Black political participation led to gains in descriptive representation for Black communities. As shown in Panel (b) of Figure 5, Southern counties with a larger share of Black voters elected more Black politicians into local, state, and national offices in the decades following the VRA.
Enfranchisement and Political Power after 1965. (a) Change in Presidential Turnout (1964/1968) and (b) Average Black Officeholders (1965–1990).

Ultimately, these shifts in the electorate and in elite representation translated into substantive policy changes for Black communities. Consistent with models of distributive politics and electoral accountability, Black enfranchisement on the state level had significant effects on state-to-county transfers of public funds after the passage of the VRA.Footnote 137 Similarly, on the national level, members of Congress representing districts subject to the preclearance provision became substantially more supportive of civil rights-related legislation in the decades following the Civil Rights era.Footnote 138 In other words, when the composition of local electorates changed with the addition of newly enfranchised Black voters, elected officials on the state and national level had to become more responsive to the preferences of these voters to stay electorally competitive.
6.2. White counter-mobilization during and after the Civil Rights era
Echoing the challenges of the first Reconstruction, Black enfranchisement during the 1960s encountered staunch resistance from white Southerners. When the VRA was passed, Senator Strom Thurmond of South Carolina warned of an impending “totalitarian state,” while Senator Herman E. Talmadge of Georgia condemned the act as “grossly unjust and vindictive.”Footnote 139
However, the VRA-induced enfranchisement proved more resilient compared to the franchise expansion during Reconstruction, in part because the preclearance provision allowed for sustained federal oversight of Southern electoral systems.Footnote 140 Nonetheless, while the VRA closed legal avenues for disenfranchisement, political actors turned to administrative stratagem and the prison system to limit the impact of Black voters—strategies, which, although less effective than legal restrictions, ultimately undermined Black political power and representation.
6.2.1. Limits on legal vote restrictions
After the passage of the VRA in 1965, Southern states found themselves severely constrained in their ability to restrict African American voting rights through institutionalized legal means. The VRA not only repealed specific Jim Crow-era voter restrictions such as literacy tests; more consequentially, Section 5 placed jurisdictions covered under Section 4(b) under a preclearance requirement, effectively reversing the burden of proof: states now had to demonstrate to the U.S. Department of Justice that any proposed change to electoral rules would not worsen minority voting strength before that change could take effect.
The Supreme Court initially validated this enforcement architecture broadly. In South Carolina v. South Carolina (383 U.S. 301), Chief Justice Warren upheld the preclearance mechanism as a valid exercise of Congress’s enforcement authority under the Fifteenth Amendment,Footnote 141 and in Allen v. State Board of Elections (393 U.S. 544), the Court interpreted Section 5 expansively—covering not only formal voting requirements but any electoral change capable of affecting minority political power, including the adoption of at-large voting schemes.Footnote 142 This early judicial validation set a broad precedent for federal oversight of the full range of Southern electoral arrangements, not just formal voting restrictions.
When the VRA faced more sustained judicial pressure in the mid-1970s and 1980s, the response was legislative repair rather than collapse—reflecting the depth of the political coalition behind the law. Civil rights had become deeply embedded in the organizational infrastructure of the labor-liberal Democratic coalition well before 1965, in ways that made sustained enforcement politically costly to abandon.Footnote 143 This institutional depth proved consequential. In Beer v. United States (425 U.S. 130) in 1976, the Court imposed a non-retrogression standard under Section 5, limiting preclearance review to changes that would worsen minority representation rather than those that failed to affirmatively improve it—a meaningful narrowing of the law’s reach.Footnote 144 More consequentially, in City of Mobile v. Bolden (446 U.S. 55) in 1980, the Court held that establishing a Fourteenth or Fifteenth Amendment violation required proof of purposeful racial discrimination rather than disparate impact, threatening to gut the enforcement tools available under Section 2 of the VRA.Footnote 145 Congress responded directly: the 1982 VRA Amendments—passed with bipartisan support—restored the results test, allowing plaintiffs to challenge practices with the effect of diluting minority voting strength regardless of whether discriminatory intent could be established. In Thornburg v. Gingles (478 U.S. 30) in 1986, the Supreme Court gave the amended Section 2 broad application, establishing a workable framework for challenging racial vote dilution through redistricting.Footnote 146 Congress reauthorized the VRA again in 2006 for an additional 25 years, compiling an extensive legislative record documenting continued patterns of discrimination in covered jurisdictions.Footnote 147
The contrast with Reconstruction is instructive. Where the Enforcement Acts collapsed under judicial pressure with no legislative repair—the Reese and Cruikshank rulings of 1876 were never remedied by Congress, which by then lacked the political will to respond—the VRA coalition demonstrated a capacity for institutional self-renewal across four decades of constitutional challenge. In Northwest Austin Municipal Utility District No. 1 v. Holder in 2009, the Court signaled growing skepticism about the preclearance formula while stopping short of invalidating it—a warning shot that Congress failed to heed.Footnote 148 Ultimately, the preclearance requirement remained in place until 2013, when the Supreme Court ruled Section 4(b) of the VRA unconstitutional in Shelby County v. Holder (570 U.S. 529).Footnote 149
6.2.2. Violence and its limitations
Grassroots activists advocating for voting rights in the South faced routine intimidation and racial terror throughout the 1950s and 1960s. During the 1964 Mississippi Freedom Summer alone, historical sources documented “35 shooting incidents with 3 injured; 30 bombings; 35 church burnings; 80 beatings and 6 murders.”Footnote 150 Yet, racial violence during the Civil Rights era operated under fundamentally different constraints than it had during Reconstruction: it was visible. Broadcast television carried the footage of the violent crackdown on peaceful protestors on Selma’s Edmund Pettus Bridge into living rooms across the country, shifting public opinion decisively in favor of civil rights activists and raising the reputational costs of organized racial violence to levels that Reconstruction-era perpetrators had not faced.Footnote 151 Efforts to maintain political exclusion through violence thus ironically catalyzed the very legislative changes they were meant to prevent: the spectacle of state-sanctioned brutality against peaceful marchers furnished Congress with both the political mandate and the moral urgency to pass comprehensive voting rights legislation.Footnote 152
The VRA, in turn, restructured the legal terrain on which violence operated. The constitutional barrier to federal prosecution of private voter intimidation had stood since United States v. Cruikshank (1876), which confined the Reconstruction amendments to state action and placed vigilante violence against Black voters entirely beyond federal reach. Section 11(b) of the VRA closed this gap directly: by prohibiting any person “whether acting under color of law or otherwise” [emphasis added] from intimidating, threatening, or coercing any person for voting or attempting to vote, Congress extended federal criminal jurisdiction to precisely the private violence Cruikshank had insulated from federal prosecution for nearly a century.Footnote 153 The Department of Justice has, at least on occasion, used this provision to bring federal charges against those who sought to intimidate Black voters and civil rights workers. Beyond prosecution, the provision’s significance lay in its structural deterrence effect: private actors seeking to use violence to suppress Black votes now faced federal criminal liability in courts whose jurisdiction no longer depended on the cooperation of the Southern state governments that had long sanctioned such violence.
6.2.3. White electoral mobilization
Black political gains also triggered white electoral counter-mobilization. For one, the elimination of voter restrictions had not only benefited Black communities but also expanded voting access for many white constituents across the South. But more importantly, Black enfranchisement increased white political participation due to dynamics of racial threat—especially in Southern preclearance counties with sizable Black populations, where Black enfranchisement risked upending white dominance.Footnote 154 These areas saw not only heightened white voter engagement but also surging support for racially conservative candidates, reflecting strategic mobilization to preserve political power.
White turnout was likely catalyzed by conservative political elites who sought to maintain racial hierarchies across the South. Many Dixiecrat-segregationists, who had remained in the Democratic Party up until the early 1960s (despite its growing focus on civil rights reform), bolted to the candidacy of Alabama Governor George Wallace, who ran on a strict segregationist platform as a third-party candidate in 1968. The Republican Party, too, recognized an inroad with Southern white voters as Richard Nixon secured the Republican Presidential nomination (and eventually the White House) with his infamous “Southern Strategy.”Footnote 155
Overall, white counter-mobilization was largely reactionary in nature, and thus less strategic than other vote repression efforts during this time. Still, in the short run, electoral mobilization helped offset some of the impact of minority enfranchisement in the immediate aftermath of the passage of the VRA.Footnote 156
6.2.4. Institutional responses: electoral protectionism and vote dilution
When violent and legal voter suppression failed, Southern elites pivoted to diluting Black political influence through administrative stratagem. One such strategy included dismantling elected offices altogether. Post-VRA, white incumbents in preclearance jurisdictions—exploiting vague implementation rules in the early years following the passage of the law—converted elected roles to appointed positions or abolished them altogether, ensuring state-controlled appointments could override local Black majorities.Footnote 157 This form of “electoral protectionism,” though less potent than outright disenfranchisement, evaded federal scrutiny by circumventing VRA preclearance requirements, which allowed political actors to preserve white dominance through bureaucratic subterfuge.
Racial gerrymandering emerged as another post-VRA tool to dilute Black electoral influence. After the Supreme Court in Reynolds v. Sims (377 U.S. 533) mandated population-balanced districts in 1964,Footnote 158 Southern states weaponized redistricting to concentrate or fragment Black voters—via packing (crowding them into few districts) or cracking (dispersing them to dilute minority influence)—thus limiting their political weight. Though Congress later curbed these tactics in the 1982 VRA Amendments,Footnote 159 racially discriminatory gerrymandering initially allowed states to sidestep federal oversight and neutralize Black voting power through map manipulation rather than overt disenfranchisement.
6.2.5. Carceral responses to mass enfranchisement
With formal voter restrictions off the table, political actors also began to turn to the state’s coercive apparatus to undermine civil and voting rights gains. Some have argued that the carceral state in particular became the “new Jim Crow.”Footnote 160 Indeed, the United States witnessed unprecedented growth in incarceration in the second half of the twentieth century, incarcerating its population at a higher rate than any other OECD country.Footnote 161
Notably, post-1960s incarceration surged disproportionately in the American South, reversing historical trends. While the region’s agrarian economy had long relied on exploitative Black labor—depressing imprisonment rates to avoid disrupting labor supply—agricultural mechanization eroded this dependency in the mid-twentieth century. Between 1940 and 1970, the rate of mechanization in the cotton industry increased from 5 to 90 percent,Footnote 162 severing the century-old co-dependence between white capital and Black labor across the region. By the 1980s, the South became a hotbed for carceral expansion as Southern states consistently reported the highest imprisonment rates in the nation. What is more, severe racial disparities in imprisonment trends emerged. While Southern Black incarceration rates had historically been lower than Northern ones in the late nineteenth and early twentieth century, Black imprisonment rates in the South would now consistently be the highest in the country (see Figure 6).
Black Imprisonment Rates per 100,000 (1980–2020).

Because individuals convicted of felonies remain legally disenfranchised in many states,Footnote 163 the rise in mass incarceration has impacted the size of the electorate. In 2024 election cycle alone, the Sentencing Project estimated that about four million Americans, or about 1.7 percent of the voting-age population and 4.5 percent of the voting-eligible Black population, were disenfranchised due to felony convictions nationwide. Black felon disenfranchisement figures are often considerably higher among Southern states. In 2024, one in eight as well as one in six Black Americans were denied the franchise due to felony convictions in Florida and Tennessee, respectively.Footnote 164
While late twentieth-century mass incarceration is a complex phenomenon,Footnote 165 American Political Development scholars have highlighted the constitutive role that carceral expansion has played in post-1960s governance. Indeed, conservative political actors began to foreground crime policy in an attempt to limit the impact of the VRA and other civil rights legislation. As such, racially charged “law and order” rhetoric was used strategically by conservative issue entrepreneurs to shift the political agenda away from civil rights and to activate white constituents—in the South and elsewhere—who had been alienated by the rights revolution of the 1960s.Footnote 166
More recent studies link post-1960s carceral growth in the American South specifically to Black enfranchisement following the VRA. Recent research reveals disproportionate Black incarceration growth in VRA preclearance jurisdictions compared to white rates, suggesting that incarceration increased precisely in those localities where federal oversight obstructed legal vote repression.Footnote 167 It remains somewhat unclear whether incarceration increased due to heightened punitive attitudes among the white mass public or because political elites sought to reduce the size of minority electorate through imprisonment (or both).Footnote 168 Whether mass or elite-driven—by the end of the twentieth century, incarceration had emerged as a potent disenfranchisement alternative in areas most impacted by voting rights gains.
***
In sum, grassroots activism during the Civil Rights era had once again led to significant federal intervention into Southern politics, in particular with respect to electoral rules and voting rights. The VRA of 1965 put an end to discriminatory voting practices and established legal mechanisms that allowed the federal government to enforce and protect voting rights for Black communities in the South. As such, legal disenfranchisement as a formal, institutionalized vote repression mechanism was, at least temporarily, taken off the table.
Given that, political actors had no choice but to resort to other (less efficient) strategies to suppress and dilute Black votes. Heightened white electoral mobilization helped offset the impact of minority voting in the immediate aftermath of the VRA. Similarly, administrative stratagem became an avenue that allowed political elites to manipulate the electoral landscape without changing formal electoral rules or voting laws. Ultimately, the prison system became a powerful tool that allowed states to suppress Black voters as felons continue to be denied the franchise in almost all states.Footnote 169
7. Conclusion
I have argued that vote repression within U.S. electoral federalism is a dynamic process shaped by the interplay of subnational authoritarian objectives and shifting institutional constraints. By situating individual repression strategies within a broader “repertoire of vote repression,” I have suggested that, all else equal, political actors will prefer the most efficient disenfranchisement mechanism—namely, legal voter exclusions—to other tactics. However, shifting institutional constraints—political, administrative, and political-economic—alter the size of the repressive repertoire over time, such that not all options are viable at all times. Analyzing the historically specific constellations of these constraints clarifies when and why subnational political actors prioritize certain repressive tactics over others.
I employed historical case studies from the American South following Reconstruction and the Civil Rights era to demonstrate the utility of this framework. During Reconstruction, the Fifteenth Amendment and federal enforcement of minority rights imposed significant political constraints on Southern elites, temporarily blocking formal voter exclusion methods. In response, Southern whites resorted to extra-legal violence to intimidate Black voters and manipulate election outcomes—until the withdrawal of federal oversight post-1877 allowed Southern states to implement more efficient, supposedly “race-neutral” legal barriers such as literacy tests and poll taxes. During the Civil Rights era, the VRA reintroduced strong federal oversight of subnational actors, effectively closing pathways for legal disenfranchisement. Consequently, Southern states had to shift their focus to subtler administrative workarounds, such as racial gerrymandering and the elimination of elected offices, and also began to lean on their carceral systems to dilute Black political power within the constraints imposed by the VRA.
This framework advances the study of vote repression by revealing how suppression strategies are contingent on institutional constraints. When federal oversight of state-level electoral systems is robust, as in the early years of Congressional Reconstruction and after the VRA, repression shifts to other—less efficient—tactics, such as extra-legal violence, fraud and administrative subterfuge, or carceral workarounds. Conversely, when federal oversight diminishes, actors revert to historically entrenched and more efficient exclusion methods, such as legal restrictions. What drives this pattern is not a linear progression from “old” to “new” tactics but rather a cost–benefit logic operating under shifting constraints: the same basic motivation to repress minority political participation persists, while institutional openings and closures determine which tactics are viable at any given moment. The two U.S. cases examined here are particularly well-suited for isolating this mechanism because federal imposition of enfranchisement—rather than enfranchisement negotiated by domestic elites—determined the timing and scope of franchise expansion exogenously, creating analytical clarity that would be harder to achieve in cases of endogenous democratization.Footnote 170 Whether the same cost–benefit logic operates similarly when elites themselves control the pace and terms of enfranchisement remains a productive direction for future comparative research.
My framework also offers useful insights for understanding contemporary voting rights developments in America. Beginning with Shelby County v. Holder (570 U.S. 529) in 2013, the Supreme Court has issued a succession of rulings that have progressively dismantled the institutional architecture that constrained vote repression during the Civil Rights era—and the pattern of post-Shelby repression closely tracks the framework’s predictions. By invalidating the VRA’s preclearance formula, Shelby removed the critical prophylactic constraint on formal legal barriers, and previously covered states moved with striking speed to reinstate them. Within hours of the ruling, Texas announced it would implement a strict voter identification law that had been blocked under preclearance; North Carolina likewise passed omnibus legislation curtailing early voting, eliminating same-day registration, and instituting photo ID requirements within months of the decision.Footnote 171 The broader pattern is consistent with what the framework would predict: states with larger minority populations and more competitive electoral environments are disproportionately more likely to adopt restrictive voting laws when federal constraints are weakened, mirroring the logic of vote repression driven by racial threat that the historical cases illustrate.Footnote 172
The removal of preclearance has demonstrably reopened the door to formal legal barriers to voting access in formerly covered jurisdictions—including accelerated voter purges, the rise of new strict voter identification requirements, and increased racial disparities in Election Day wait times.Footnote 173 Whether these barriers will ultimately translate into rising racial turnout gaps remains an open empirical question.Footnote 174
In Brnovich v. Democratic National Committee (594 U.S. 647) in 2021, the Court further weakened the remaining statutory line of defense by narrowing Section 2 of the VRA, the principal tool for challenging discriminatory voting rules absent preclearance. Writing for a six-to-three majority, Justice Alito held that Arizona’s restrictions on out-of-precinct voting and third-party ballot collection did not violate Section 2, articulating interpretive “guideposts” that imposed substantially higher burdens on plaintiffs challenging facially neutral voting rules.Footnote 175 The decision echoed Reese and Williams v. Mississippi in its core logic: restrictions that disproportionately burden minority voters do not, by that fact alone, constitute discrimination.
Alongside these restrictions on vote access, the Court has simultaneously foreclosed federal judicial oversight of the district-drawing processes through which minority political power is diluted. In Rucho v. Common Cause (588 U.S. 684) in 2019, a five-to-four majority held that partisan gerrymandering claims present political questions beyond the reach of the federal courts.Footnote 176 Because racial and partisan gerrymandering are empirically difficult to disentangle in a racially polarized electorate, Rucho effectively insulated a wide range of racially motivated redistricting from federal review by providing a ready-made alternative rationale. Most recently, in Louisiana v. Callais (608 U.S.—), the Court completed what Brnovich had begun: in a six-to-three opinion issued in April 2026, the Court struck down Louisiana’s majority-Black congressional district, which had been drawn to remedy a Section 2 violation, and in so doing substantially reworked the framework that had governed Section 2 redistricting claims for four decades.Footnote 177 In the dissent, Justice Kagan observed that the majority had rendered Section 2 “all but a dead letter”—a characterization that, from the perspective of this paper’s historical framework, echoes developments in the 1870s and 1890s when the Court narrowed the tools of federal enforcement, sanctioned the instruments of legal exclusion, and declined to rectify even openly acknowledged disparate impact of voting rules and procedures.
Although this paper does not formally analyze the post-Shelby era, the framework offers a clear interpretive lens: the Court’s dismantling of the VRA’s institutional architecture since 2013—and Congress’ inability and unwillingness to respond to these Court rulings—has not produced fundamentally new forms of repression but rather, a return to historically familiar ones, as the constraint constellation shifts back toward conditions that prevailed in the Jim Crow era. The resurgence of formal, facially neutral legal barriers underscores the paper’s core argument that suppression tactics neither disappear nor evolve in a linear direction—rather, they reemerge and adapt whenever institutional protections are weakened sufficiently to make them viable.
In conclusion, this paper reorients the study of vote repression toward systemic, historically grounded analysis. It reveals that mechanisms of voter exclusion are neither static nor random but are strategically reconfigured in response to institutional opportunities and constraints. The framework’s emphasis on political, state capacity, and labor market constraints invites scholars to interrogate today’s voting rights battles as part of a recurring pattern, in which the defense of democracy requires vigilance not only against specific tactics but against the structural conditions that allow distinct modes of repression to thrive.
Supplementary material
The supplementary material for this article can be found at https://doi.org/10.1017/S0898588X26100418.
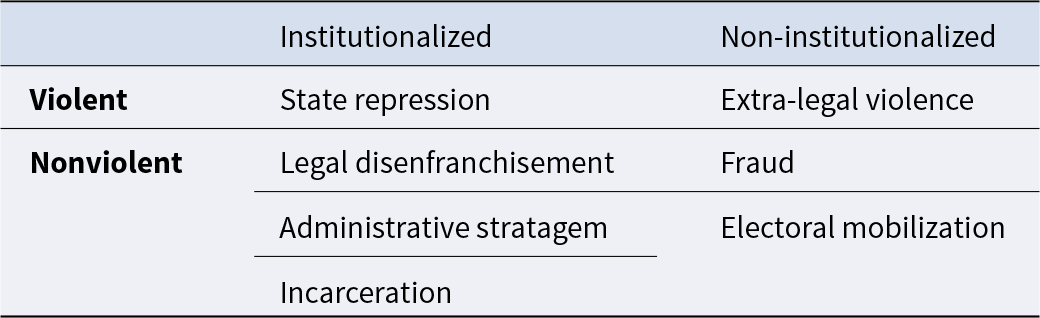
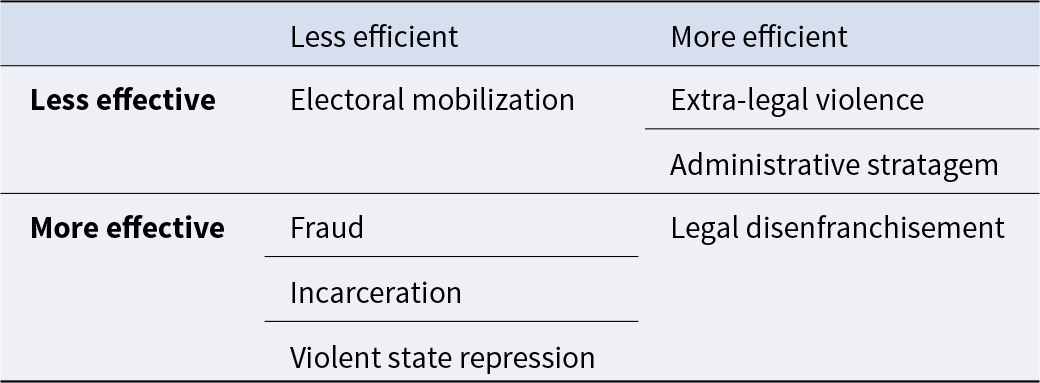
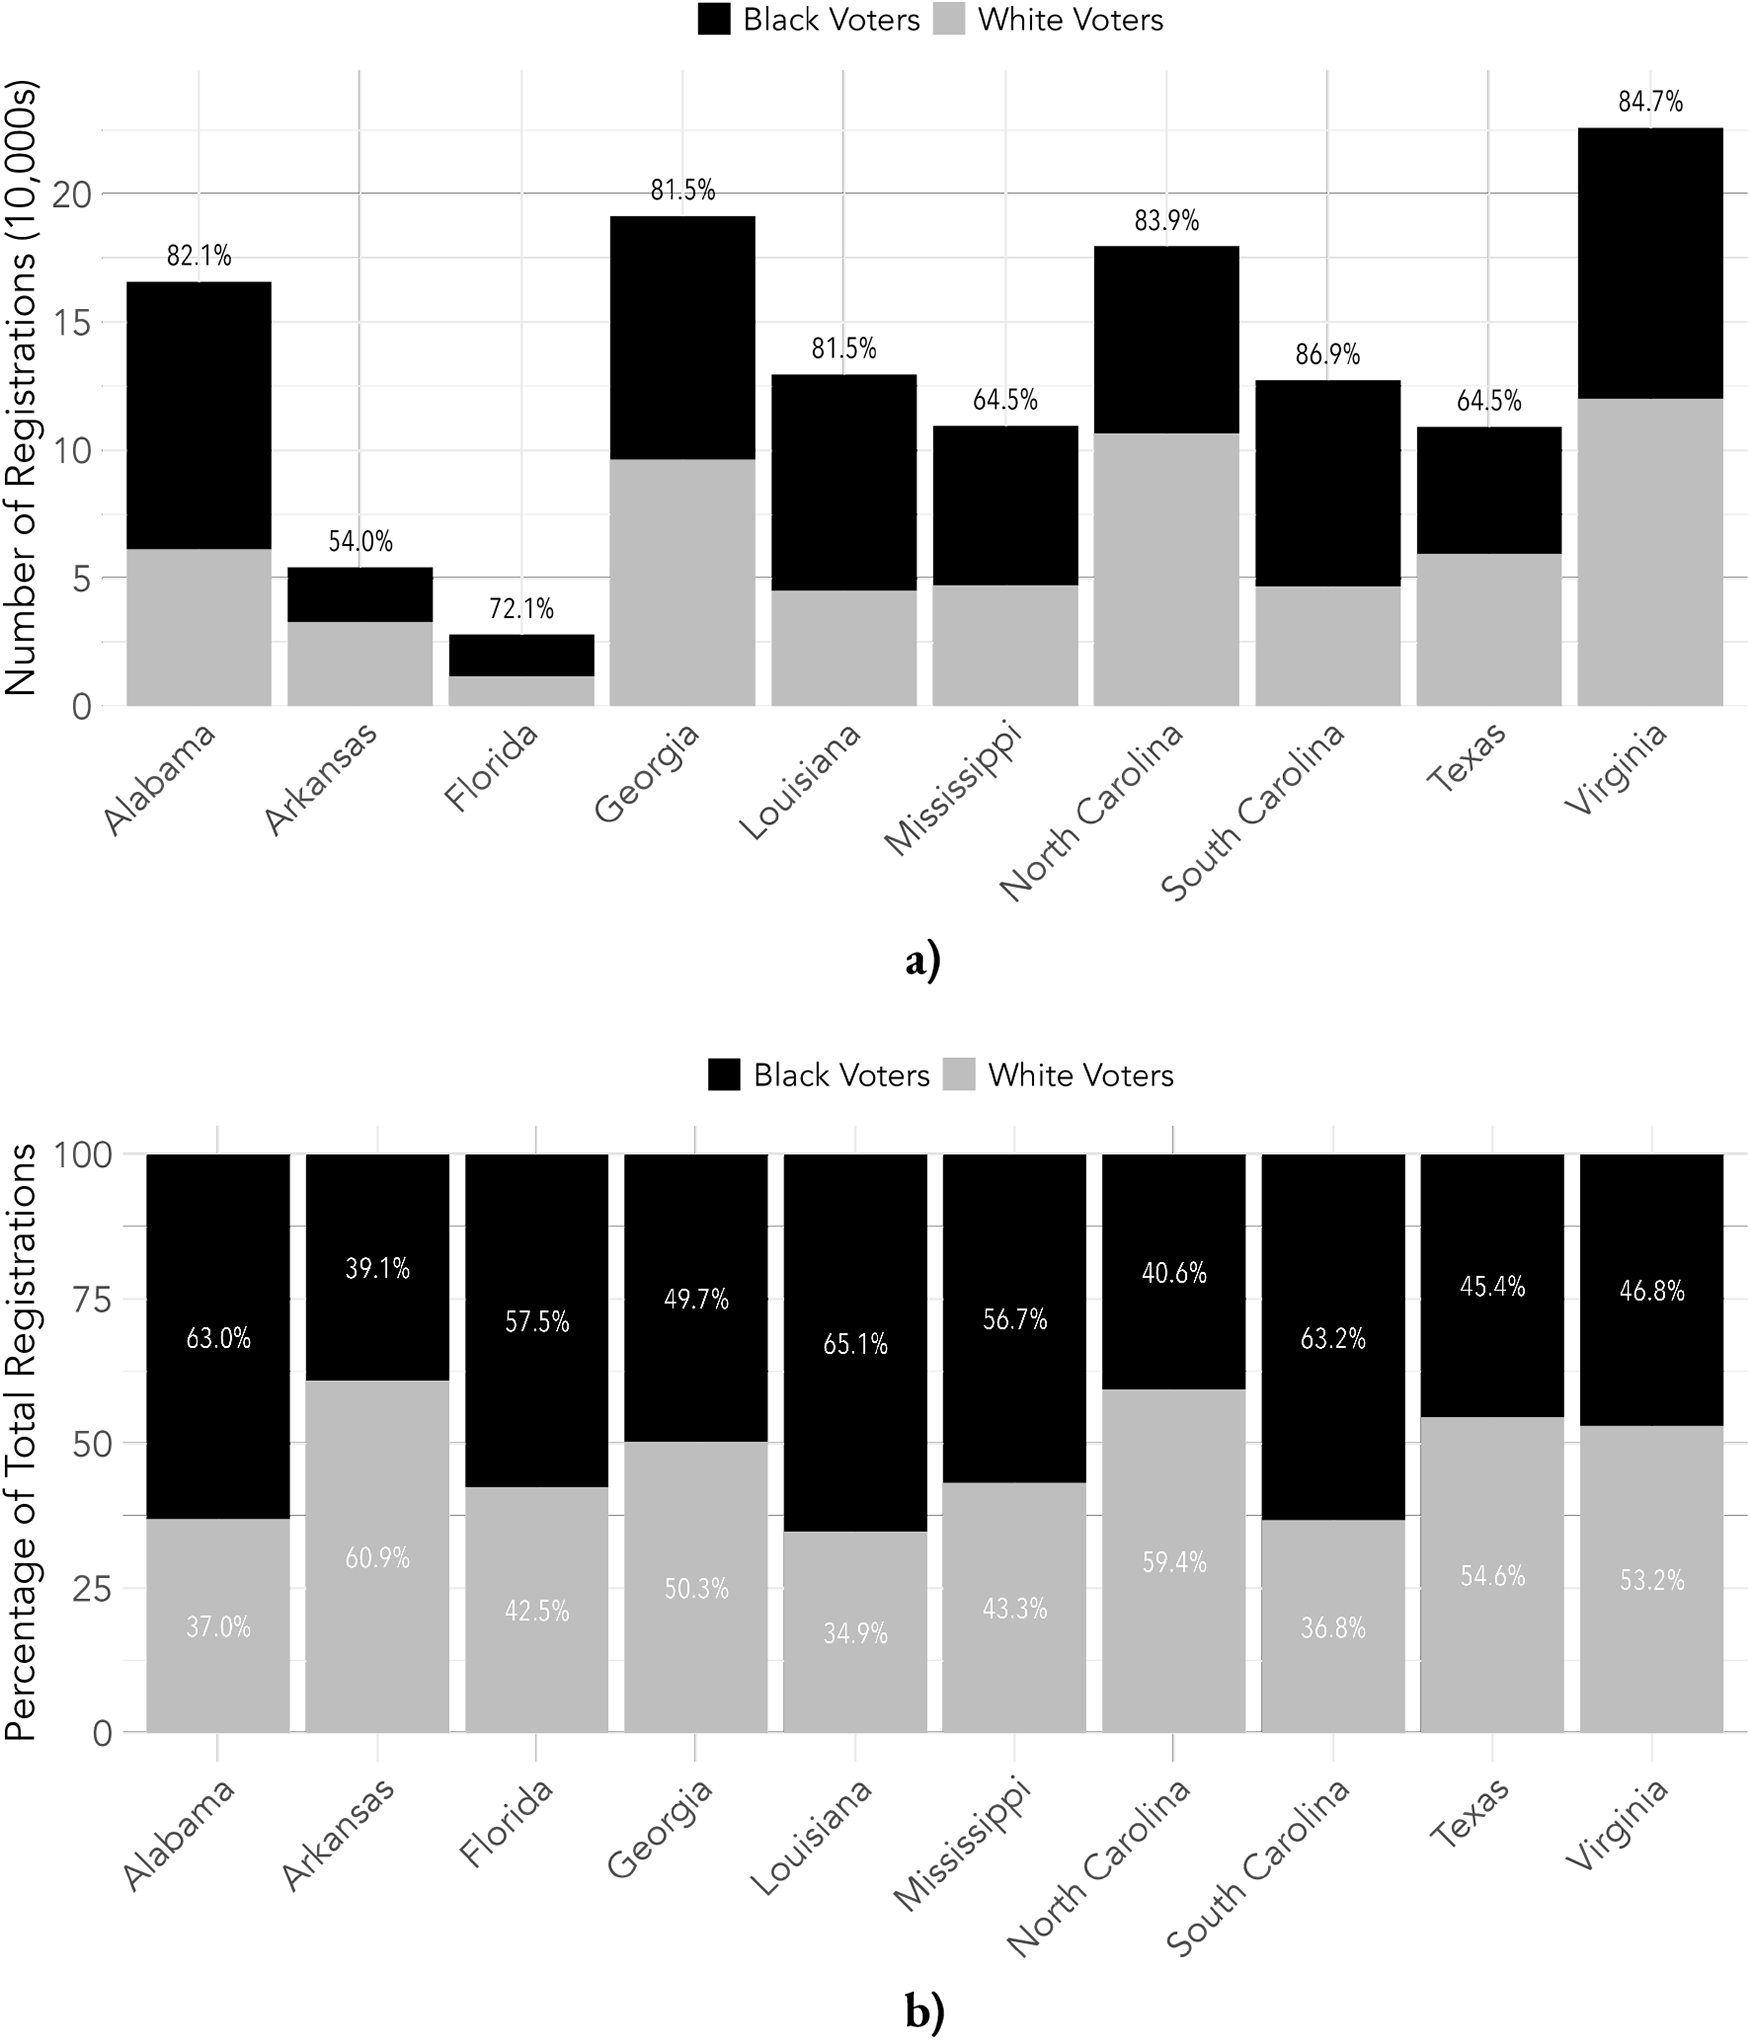
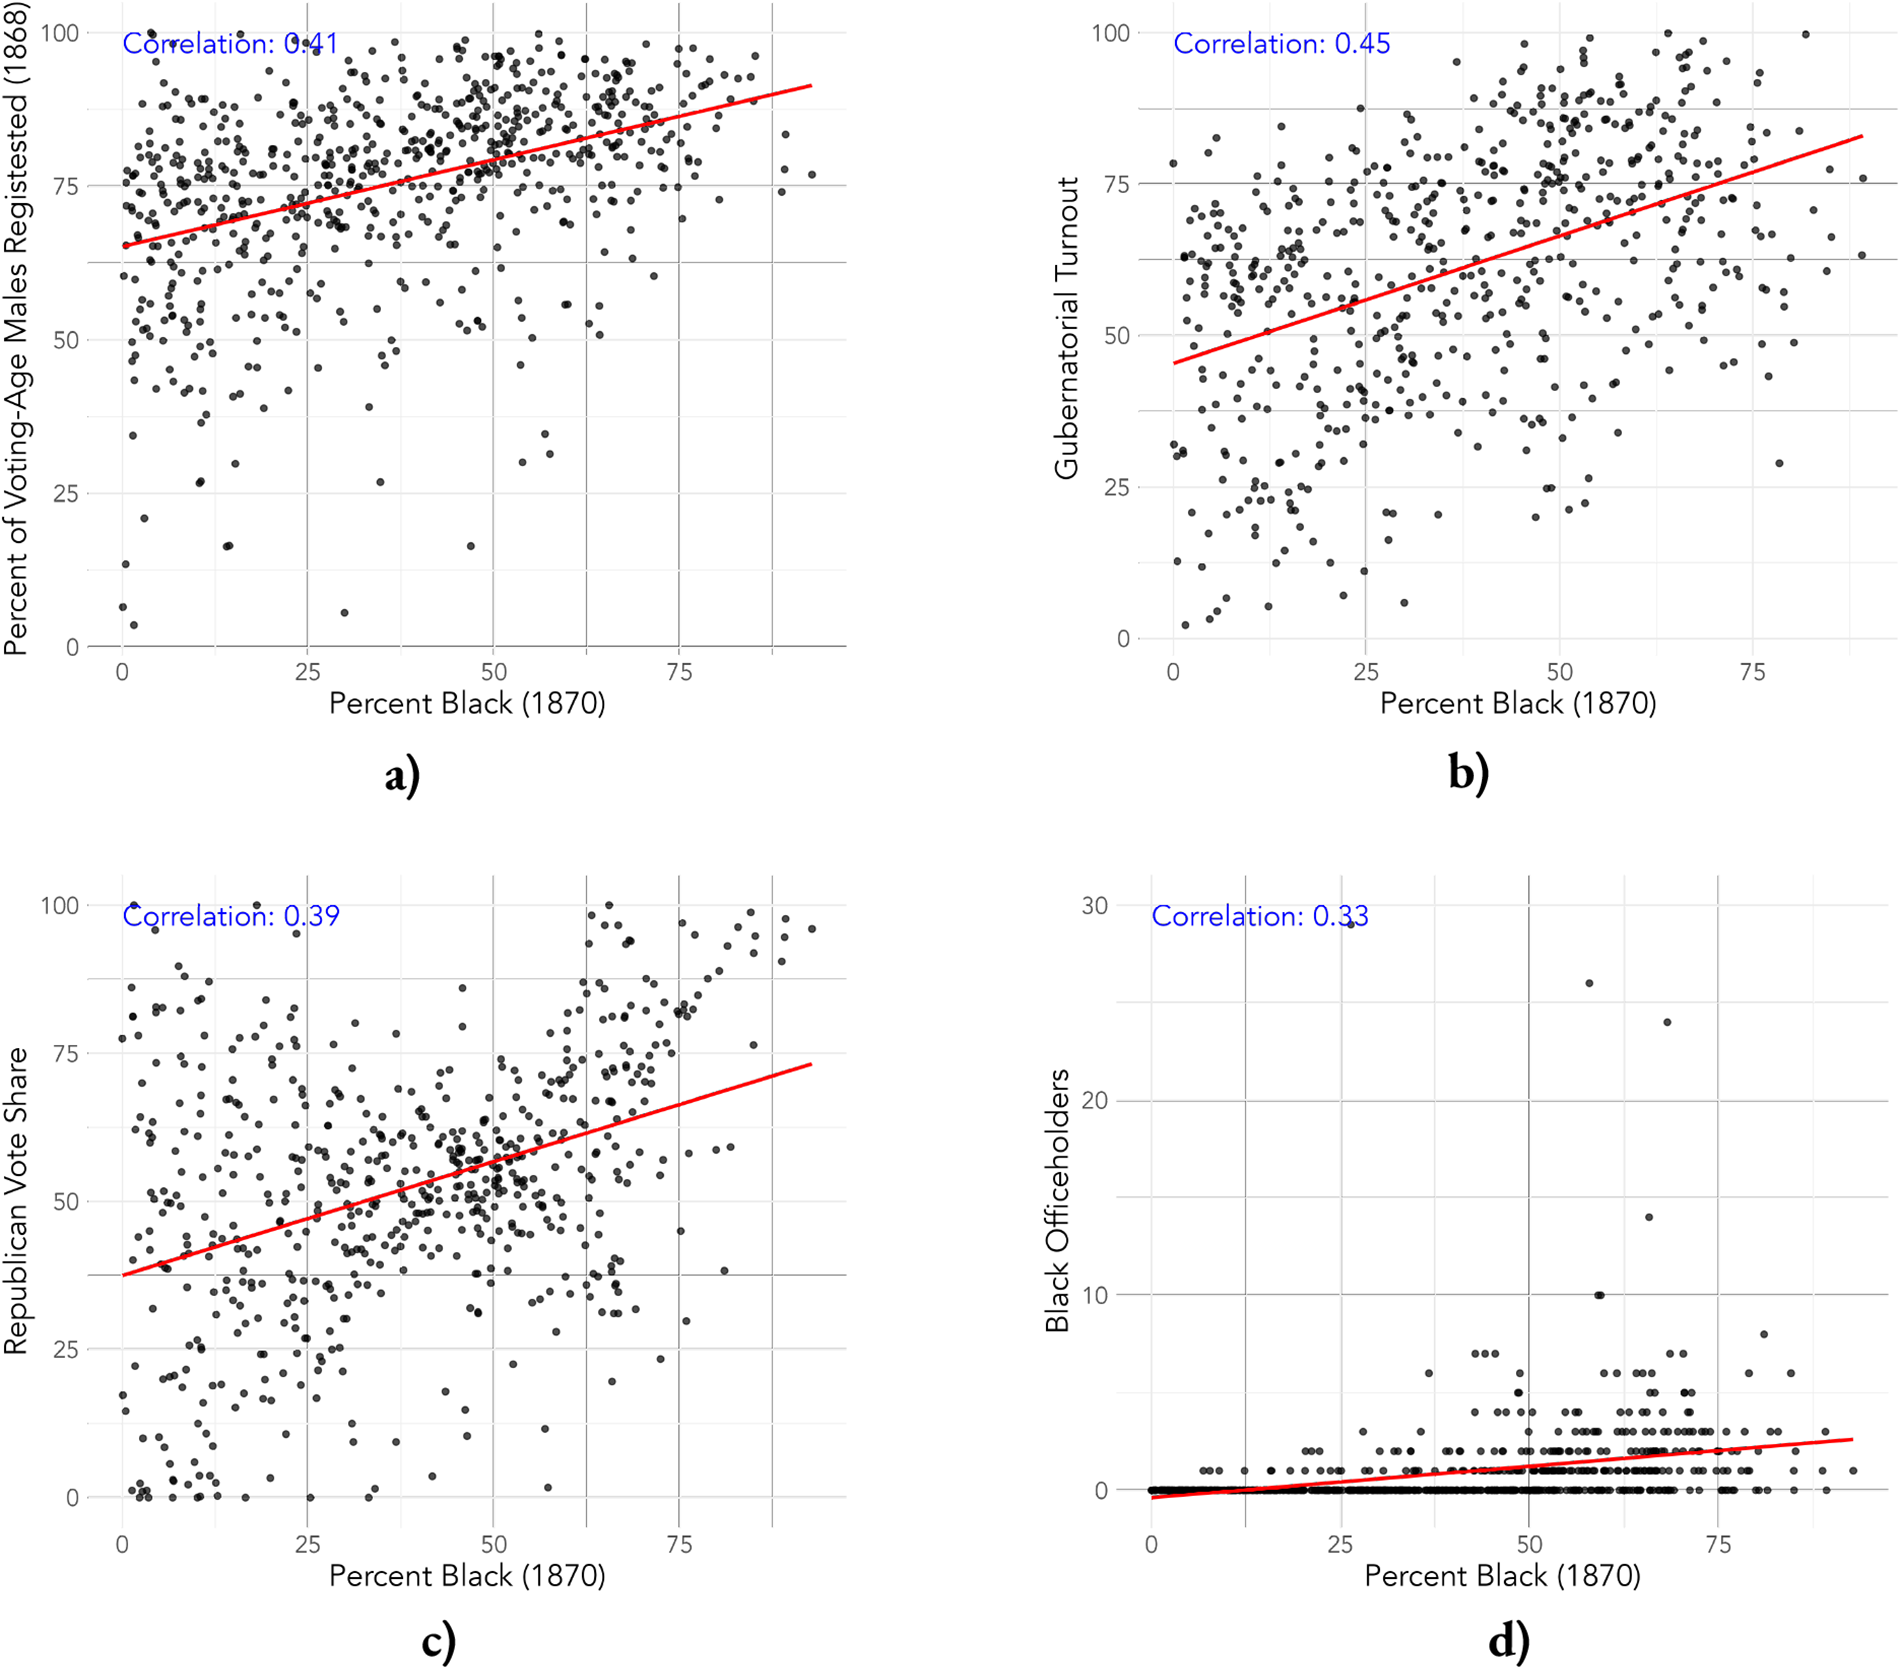
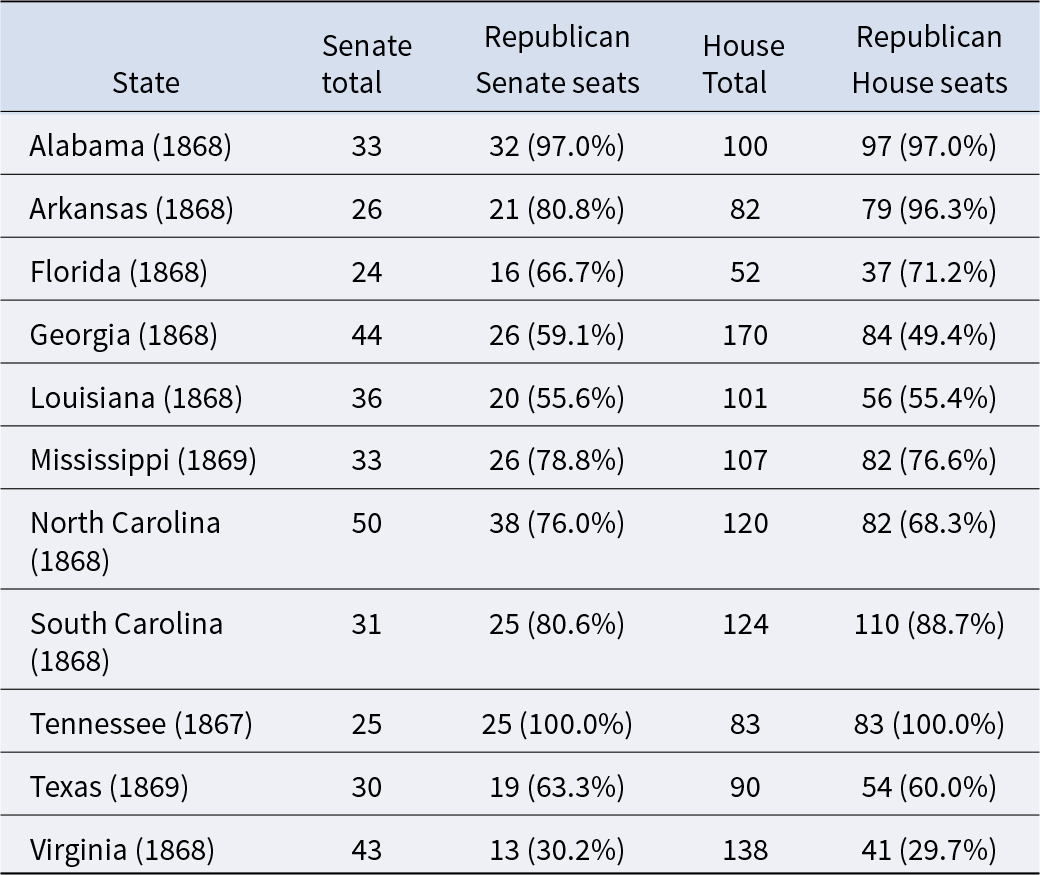
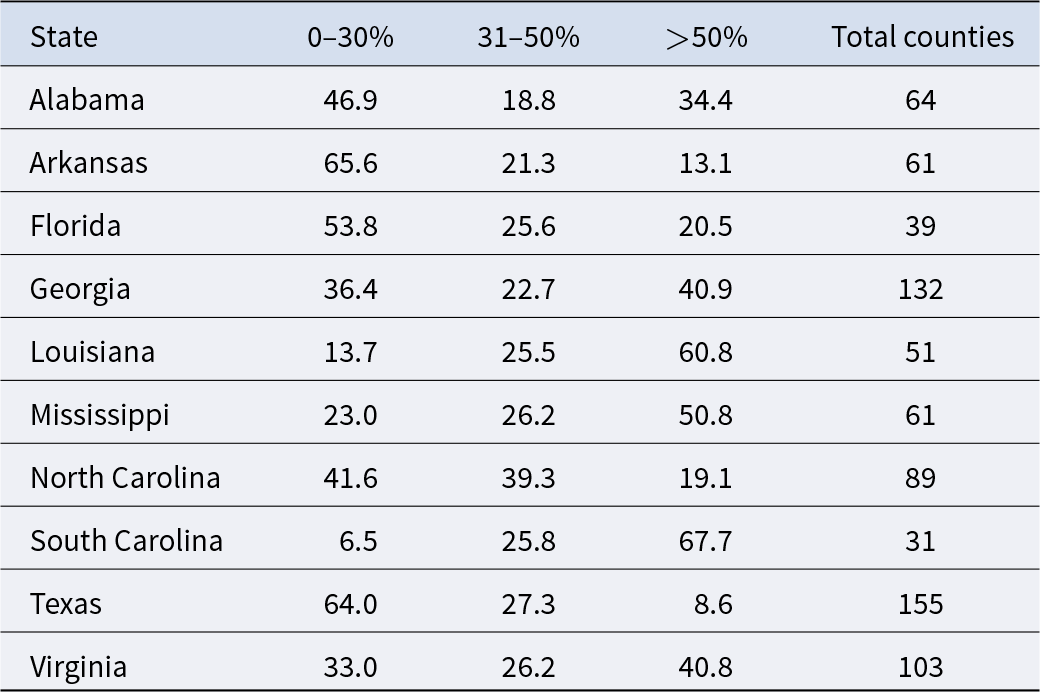
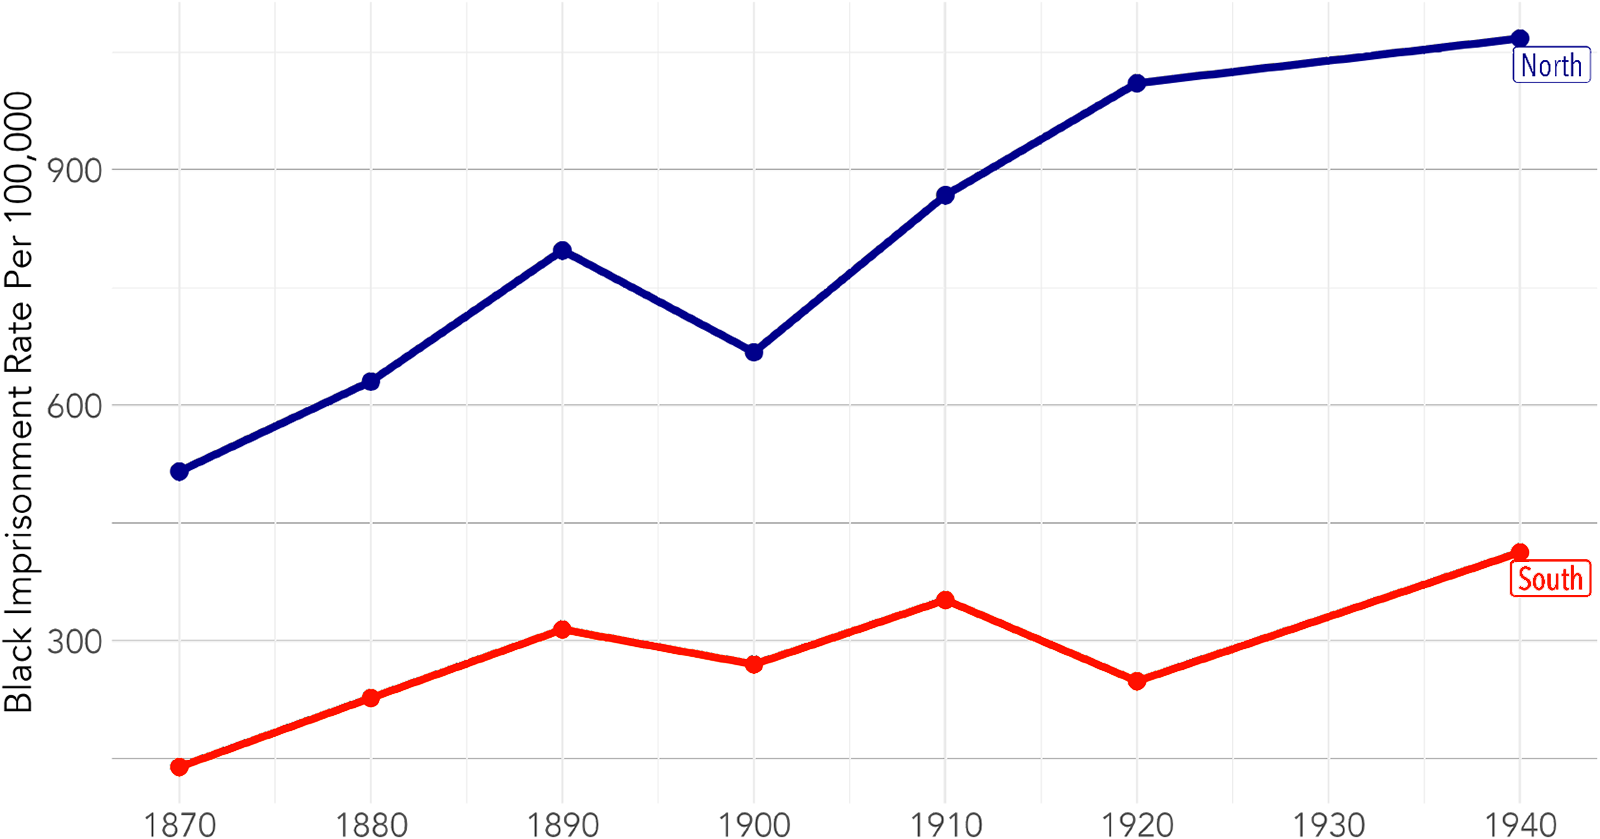
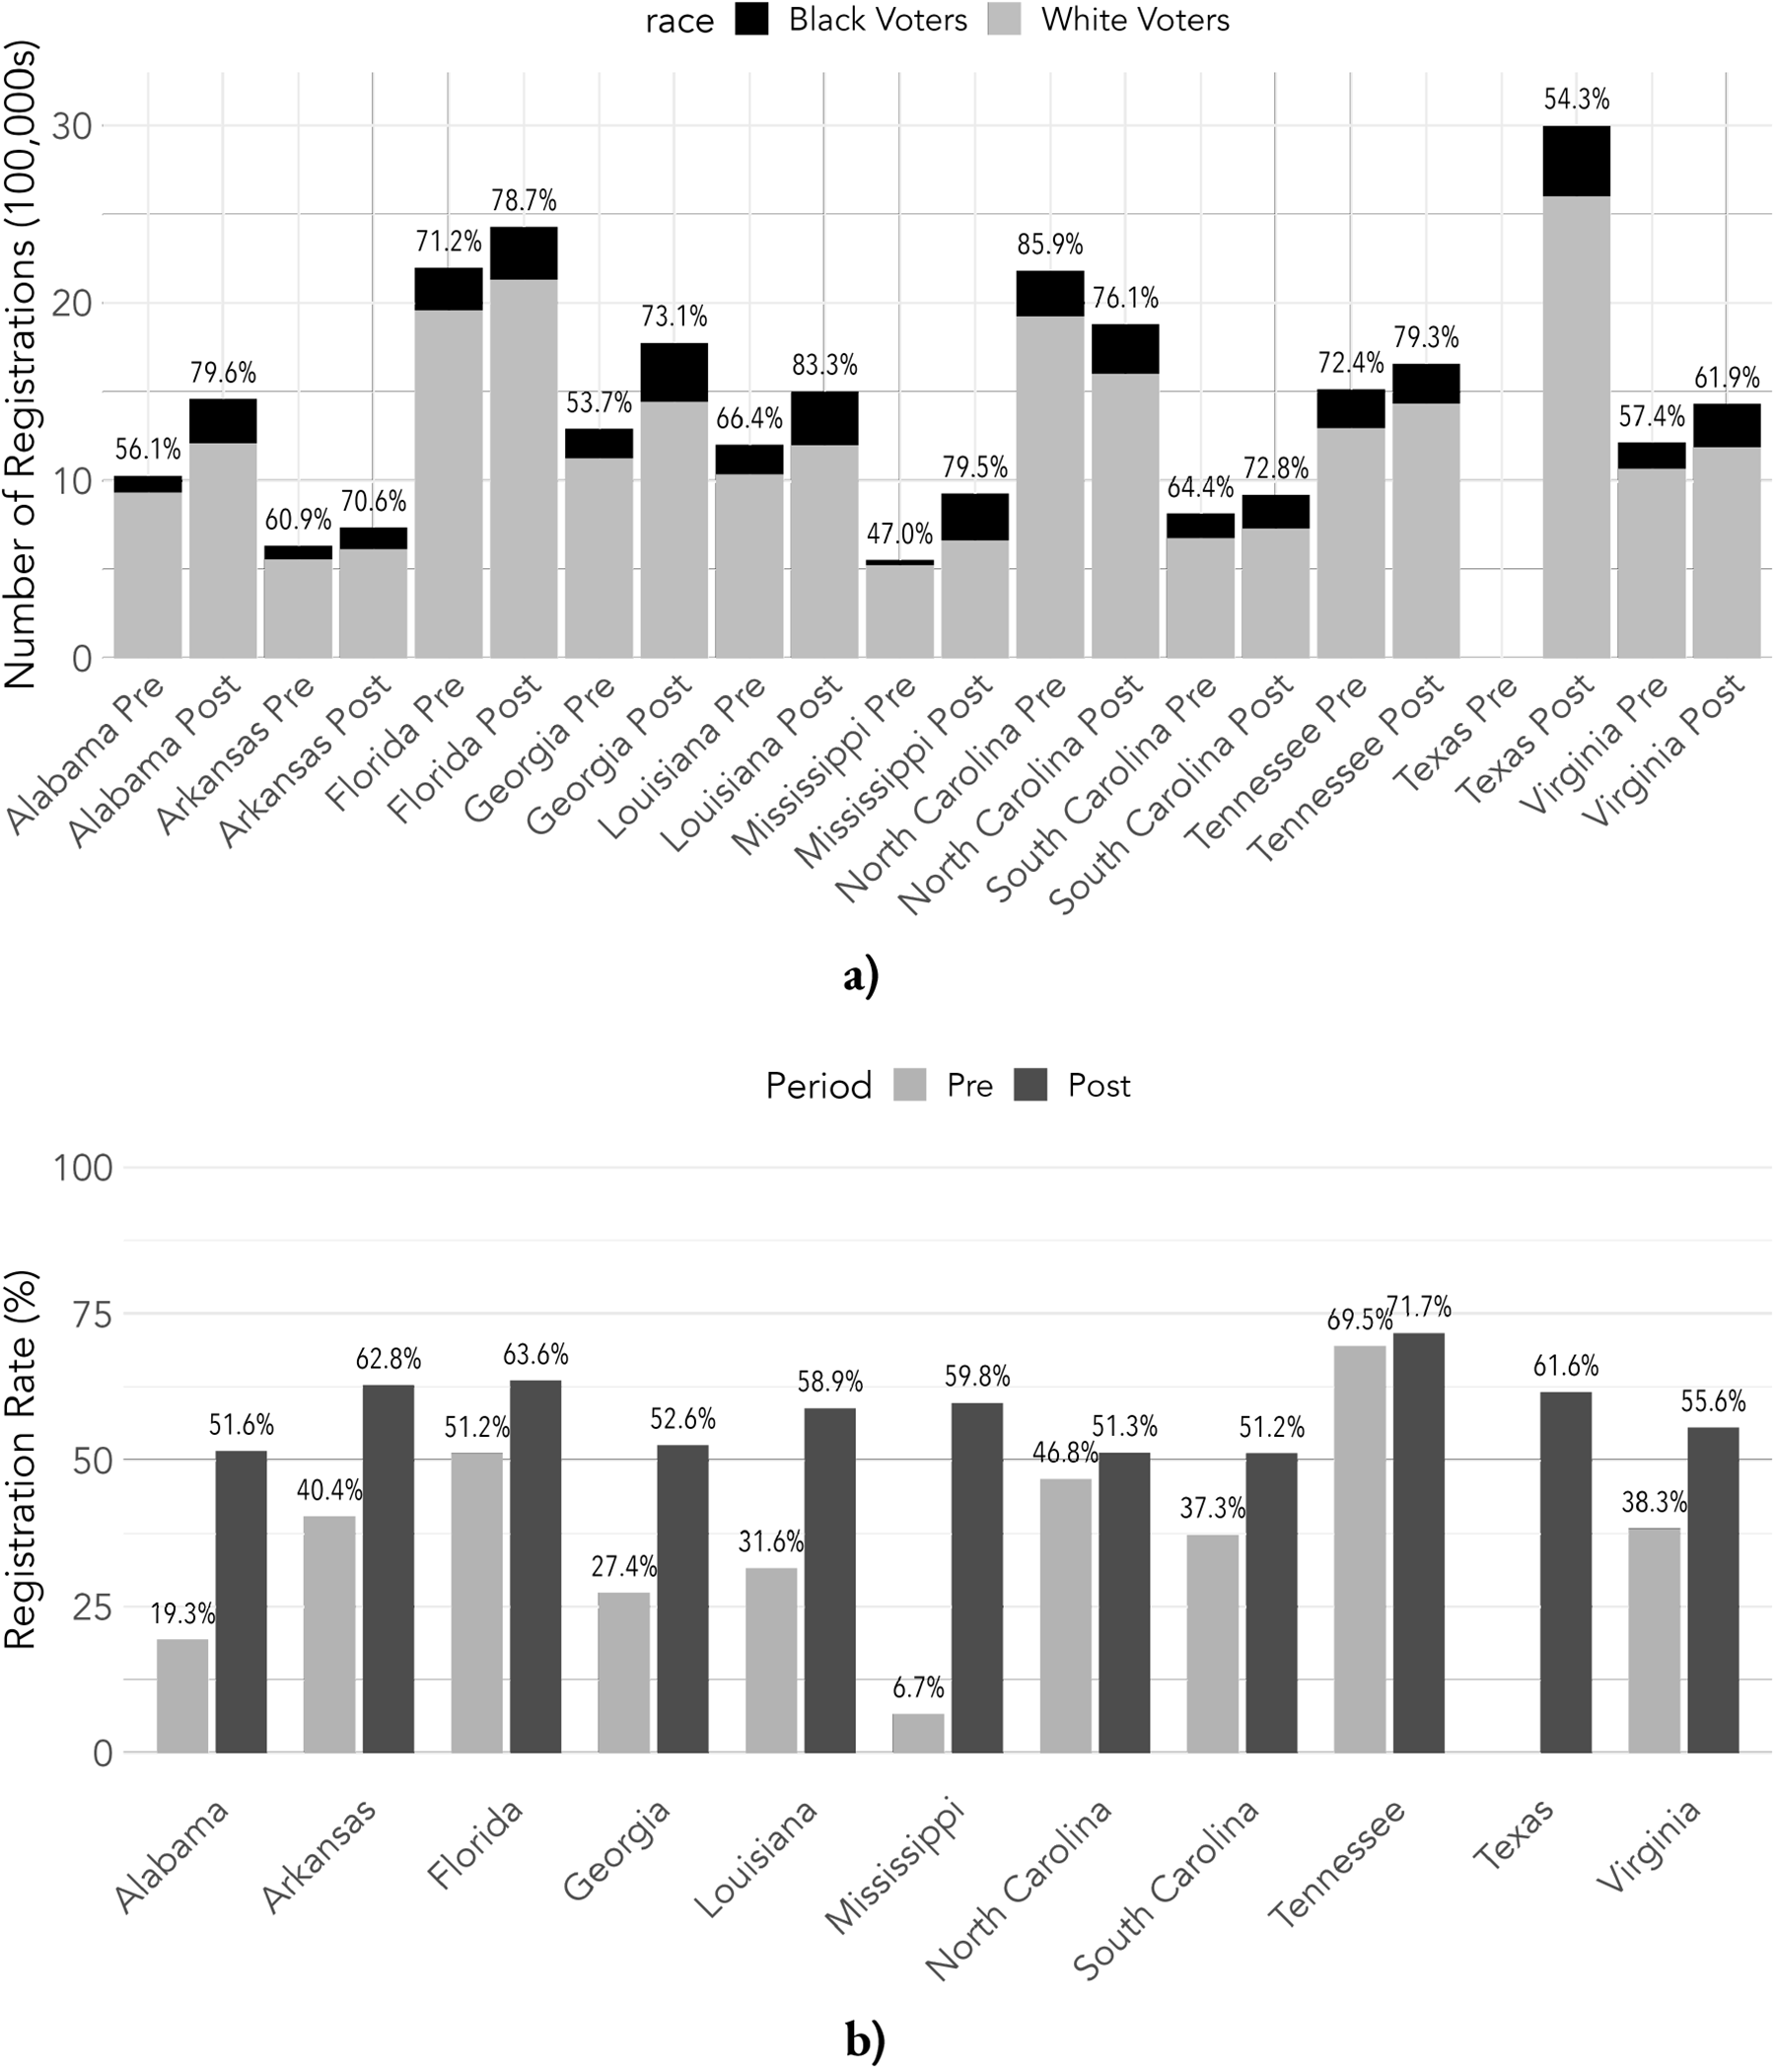
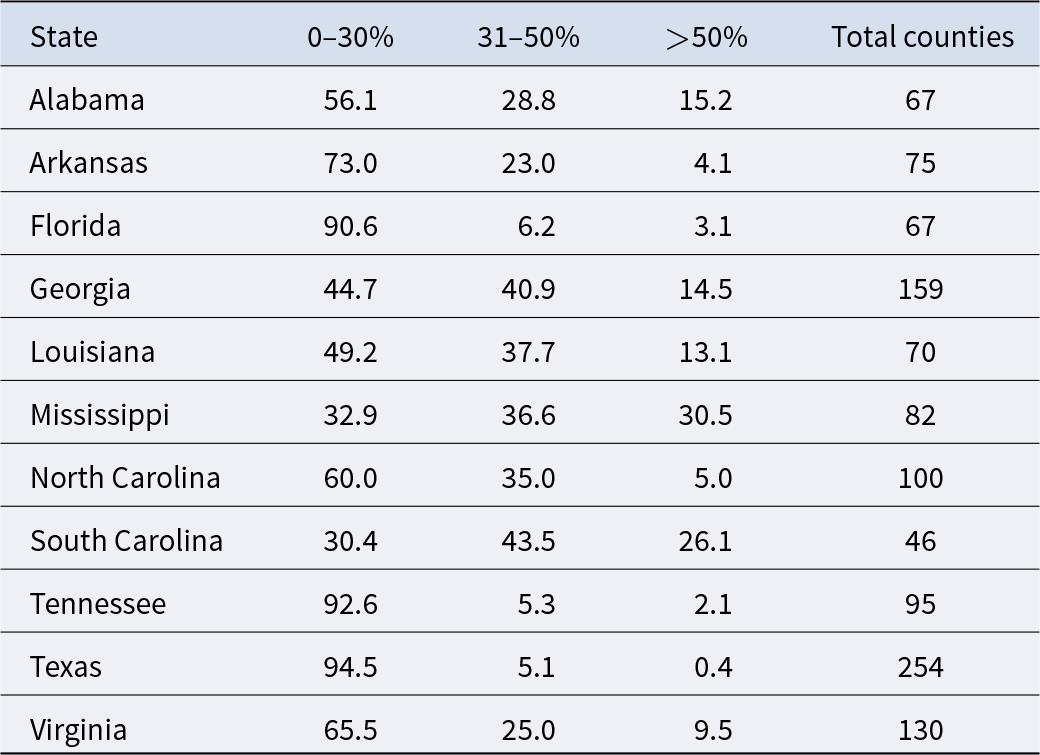
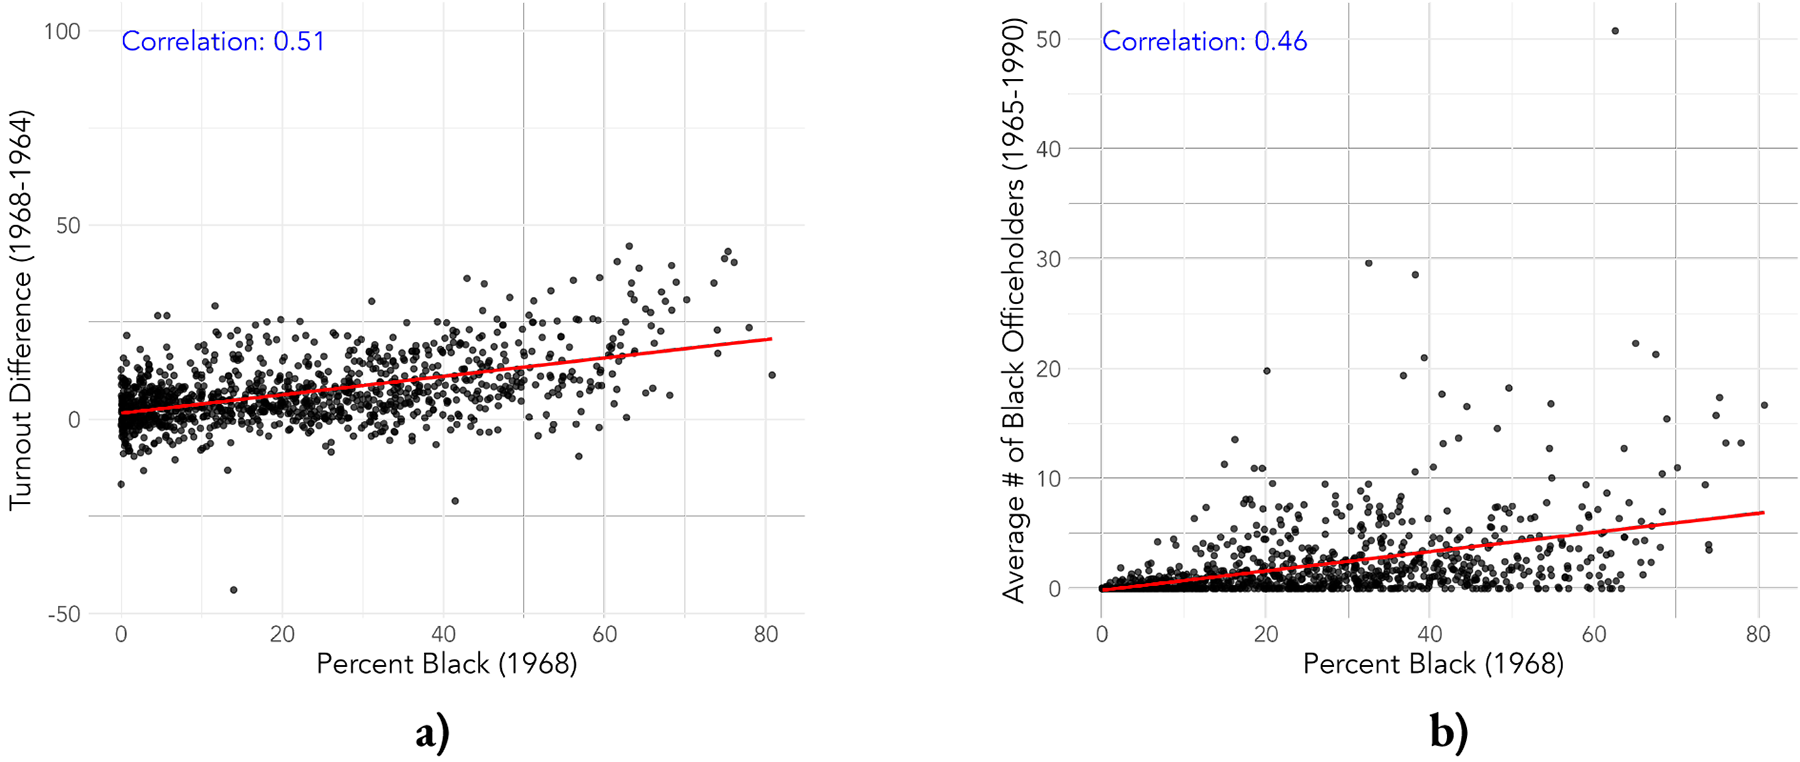
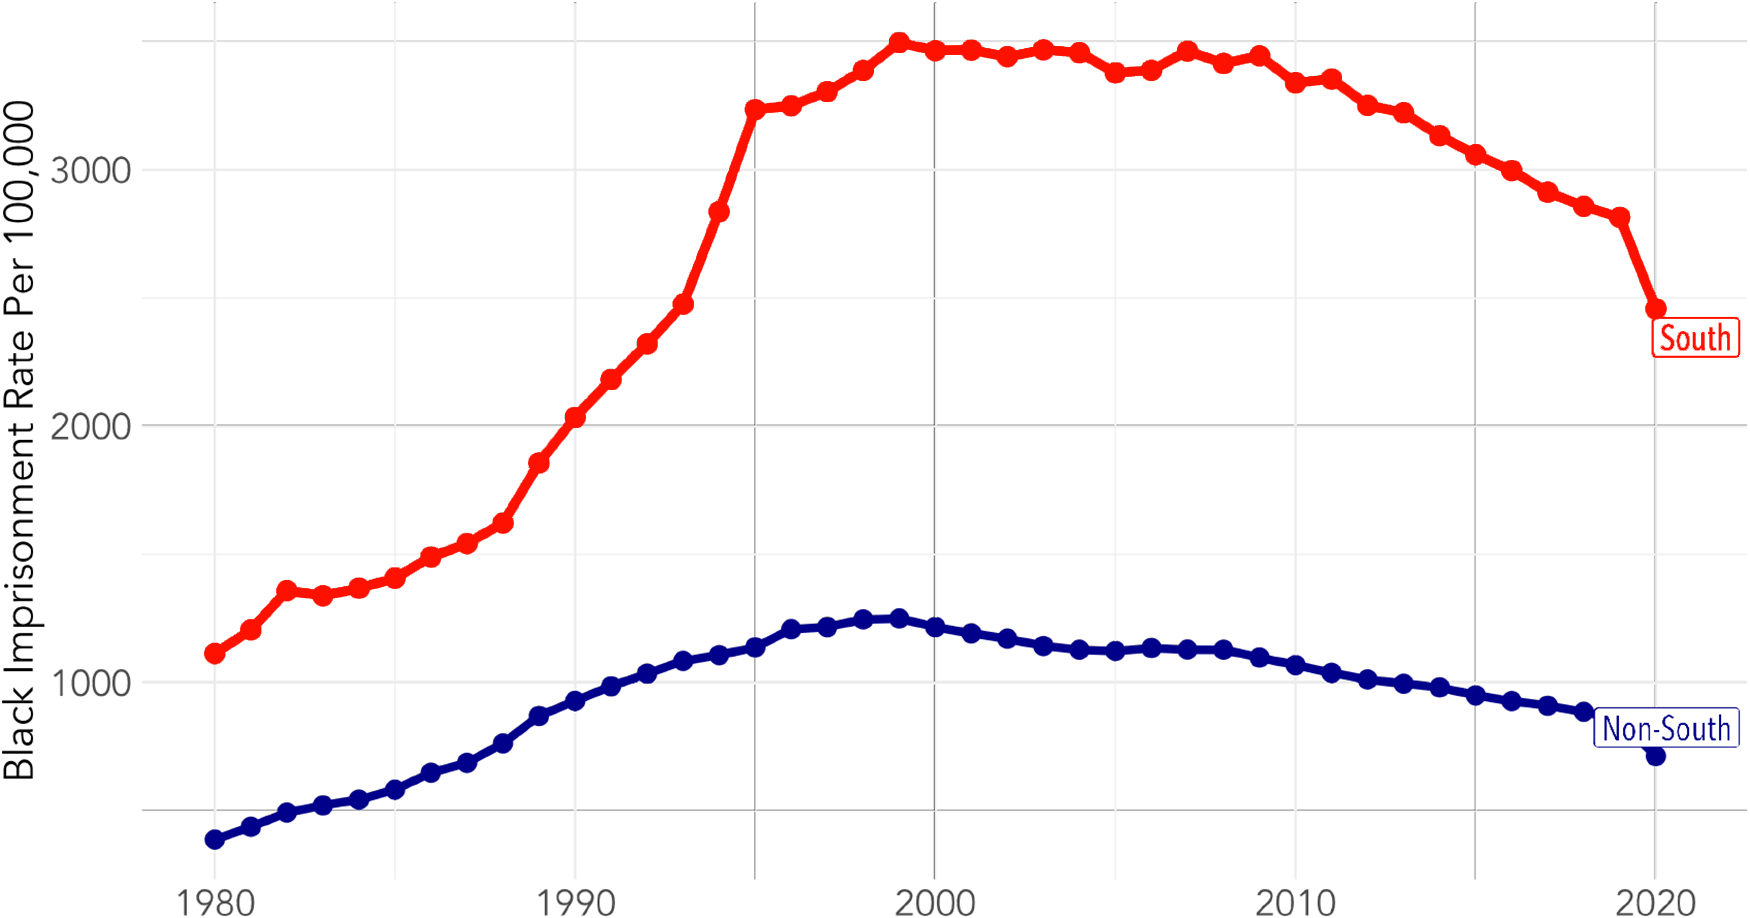


 Open access

