Implications
High-protein (HP) diets with a decreased carbohydrate level reduce body fat and mass. Studies in rodents and pigs suggest that HP diets cause intrauterine growth retardation. However, the impact of HP diets during gestation and lactation for the dam and early postnatal growth of the offspring is largely unknown. HP diet fed during gestation and lactation resulted in lower maternal body and fat mass, and was detrimental for birth litter size and pre-weaning offspring growth. This was related to a reduction in mammary gland mass, functional tissue, abundance of lactational genes and milk lactose content.
Introduction
Many studies addressed the consequences of maternal under-nutrition during pregnancy (i.e. low protein, restricted energy intake) on pregnancy outcome in humans (Godfrey et al., Reference Godfrey, Robinson, Barker, Osmond and Cox1996) and animals (Ozanne et al., Reference Ozanne, Lewis, Jennings and Hales2004; Rees et al., Reference Rees, Hay and Antipatis2006; Fagundes et al., Reference Fagundes, Moura, Passos, Oliviera, Toste, Bonomo, Trevenzoli, Garcia and Lisboa2007). High-protein (HP) diets have been shown to cause weight loss by inducing longer postprandial satiety and increase dietary thermogenesis that led to a lower subsequent energy intake (Johnston et al., Reference Johnston, Day and Swan2002; Halton and Hu, Reference Halton and Hu2004). In obese and diabetic individuals, a higher utilization of fat reserves and improved glucose homeostasis was reported while subjected to diets containing higher protein contents (Farnsworth et al., Reference Farnsworth, Luscombe, Noakes, Wittert, Argyiou and Clifton2003; Layman et al., Reference Layman, Boileau, Erickson, Painter, Shiue, Sather and Christou2003). Similar results were obtained in rats fed HP diets with reduced carbohydrate content (Jean et al., Reference Jean, Rome, Mathé, Huneau, Aattouri, Fromentin, Achagiotis and Tomé2001; Lacroix et al., Reference Lacroix, Gaudichon, Martin, Morens, Mathé, Tomé and Huneau2004). Reports on the impact of an increased dietary protein intake during gestation and lactation on maternal and foetal/offspring health and development are scarce and the results obtained are inconsistent (Daenzer et al., Reference Daenzer, Ortmann, Klaus and Metges2002; Zhang et al., Reference Zhang, Wang, Terroni, Cagampang, Hanson and Byrne2005; Thone-Reineke et al., Reference Thone-Reineke, Kalk, Dorn, Klaus, Simon, Pfab, Godes, Persson, Unger and Hocher2006). However, there seems to be a similarity with the effects of a low-protein diet that also causes decreased birth weight and altered body mass (BM) development of the offspring during lactation (Fagundes et al., Reference Fagundes, Moura, Passos, Oliviera, Toste, Bonomo, Trevenzoli, Garcia and Lisboa2007; Desai et al., Reference Desai, Crowther, Lucas and Hales1996and Reference Desai, Byrne, Meeran, Martinez, Bloom and Hales1997). Excess of nutrients can lead to altered milk volume (King et al., Reference King, Toner, Dove, Atwood and Brown1993; Del Prado et al., Reference Del Prado, Delgado and Villalpando1997), lactose (Pine et al., Reference Pine, Jessop and Oldham1994) as well as milk fat concentrations (Aoki et al., Reference Aoki, Yamaguchi, Ohira and Matsuda1999; Tilton et al., Reference Tilton, Muller, Lewis, Reese and Ermer1999) subsequent to changes in mammary gland (MG) structure and gene expression (Flint et al., Reference Flint, Travers, Barber, Binart and Kelly2005; Rudolph et al., Reference Rudolph, Neville and Anderson2007). To our knowledge, the effects of a high dietary protein intake during gestation and lactation on murine MG histology and mRNA abundance have not been determined before.
Our previous studies have shown reduced birth weight and altered BM development in rat, mouse and swine offspring when dams received an HP diet during gestation and/or lactation (Daenzer et al., Reference Daenzer, Ortmann, Klaus and Metges2002; Langhammer et al., Reference Langhammer, Derno, Dietrich, Renne, Nürnberg, Hennig and Metges2006; Metges et al., Reference Metges, Lang, Goers, Junghans, Hennig, Stabenow, Schneider, Otten and Rehfeldt2009). We hypothesized that reduced early growth of the offspring is associated with impaired lactation subsequent to a structural or functional disorder of MG. We therefore examined the effects of an HP diet during gestation and/or lactation on maternal food intake, organ mass, and BM, as well as offspring growth rate until weaning. In addition to MG development and gene expression, the milk composition of the mouse dams was investigated.
Material and methods
Animals and diets
The study followed German guidelines for the protection of animals used for experimental purposes and was conducted with approval of the Animal Care Committee of the Ministry of Nutrition, Agriculture, Forestry and Fishery, State Mecklenburg-Vorpommern, Germany (LALLF M-V/TSD/7221.3-1.1-033/06). Unselected, nulliparous female mice (line DUK; n = 247, mean BM 29.2 ± 0.2 g) bred at the Leibniz Institute for Farm Animal Biology (FBN), Dummerstorf, Germany were mated at 9 weeks of age. The initial population was derived from a crossing of four outbred (NMRI orig., Han:NMRI, CFW, CF1) and four inbred (CBA/Bln, AB/Bln, C57BL/Bln, XVII/Bln) populations (Schüler, Reference Schüler1985). This mouse line was bred by random mating for 129 generations. Female mice were randomly allocated to two feeding groups receiving one of two experimental isoenergetic diets with control (C) and HP levels, respectively. The diets were similar to those used earlier (Daenzer et al., Reference Daenzer, Ortmann, Klaus and Metges2002) and consisted of casein (Molkereigesellschaft Lauingen mbH, Lauingen, Germany; C, 222; HP 426 g/kg) supplemented with DL-methionine (8.0 g/kg; LAH GmbH & CO. KG, Cuxhaven, Germany), wheat starch (Ferdinand Kreutzer Sabamühle GmbH, Nürnberg, Germany; C, 439.9; HP 217.9 g/kg), sucrose (Nordzucker GmbH, Hamburg, Germany; 160 g/kg), soy oil (Sedina ADM, Hamburg, Germany; 50 g/kg), microcellulose (50 g/kg), vitamin mixture (20 g/kg; SSNIFF Spezialdiäten GmbH, Soest, Germany), mineral mixture (50 g/kg; SSNIFF Spezialdiäten GmbH) and butylhydroxytoluene (0.1 g/kg; LAH GmbH & CO. KG). Crude protein content in dry matter was 24.8% and 44.2%, and the protein-to-carbohydrate ratio was 0.37 and 1.15 in C and HP diets, respectively.
One male and one female were put in the same cage to mate. During this time they were fed the respective experimental diets to allow adaptation of the dam to the food. The appearance of vaginal plug was examined daily. Males were withdrawn immediately after the vaginal plug appeared, which was considered day 1 of gestation. Conception rate was calculated as the percentage of dams who gave birth to the total number of dams mated and was 90.3% for the HP diet (n = 124 dams) and 91.9% for the C diet (n = 123 dams). Pregnant dams were housed individually in plastic cages (Macrolon, Type II, EBECO, Castrop-Rauxel, Germany) in a controlled environment of 21°C with 12 : 12 h light/dark cycle. Water was available ad libitum.
Food intake was monitored individually three times a week throughout the whole study. At selected time points (vaginal plug appearance, 6 and 14 days of gestation, parturition, 3, 14, 18, 21 and 23 days of lactation) BM of dams was measured. At day 1 after parturition a randomly selected equal number of dams (n = 40) was either kept on the diet fed during gestation or were switched to the other diet, which resulted in four dietary groups: CC (C diet during gestation and lactation), CHP (C diet during gestation and HP diet during lactation), HPHP (HP diet during gestation and lactation) and HPC (HP diet during gestation and C diet during lactation). The litters were standardized to 10 pups immediately after birth and stayed with their mothers. Total litter mass was monitored on lactation days 3, 14, 18 and 21. Mouse dams were killed on day 6 and 14 of gestation, and days 3, 14 and 23 of lactation (i.e. 2 days after weaning) and masses of the right inguinal MG, the liver, right kidney and right abdominal fat pad were recorded. To determine relative kidney mass in the offspring three weaning pups (aged 21 days) per litter were randomly selected.
Milking procedure and milk analysis
Different dams were mechanically milked on days 3, 14 and 18 of lactation between 0900 and 1200 h, and the milk was analysed following the procedures recently described (Görs et al., Reference Görs, Kucia, Langhammer, Junghans and Metges2009). Briefly, after injection with oxytocin milk from all 10 teats was collected and then stored at −20°C for later analyses. Dry matter was determined in duplicate in 10 μl of milk (5 h at 55°C), whereas nitrogen was determined in dried milk by elemental analysis and converted to protein (N × 6.38). Fat determination was carried out by a miniaturized Röse-Gottlieb procedure in 100 μl of milk. Lactose measurement in 20 μl of clear diluted whey was carried out by HPLC.
MG histology
Subsets of nulliparous females, and dams on day 14 of gestation and lactation, respectively, and day 2 after weaning (eight to nine dams per dietary group) were anaesthetized by subcutaneous injection with ketamine hydrochloride (87 mg/kg of BM, Ursotamin®, Serum-Werk-Bernburg AG, Bernburg, Germany) and xylazine hydrochloride (13 mg/kg of BM, Xylazine® 2%, Riemser Arzneimittel AG, Greifswald, Insel Riems, Germany) before decapitation. Subsequently, two pairs of abdominal and inguinal MG were removed. Part of the right MG was fixed to a cork with Tissue-Tek® (Jung Tissue Freezing Medium®, Leica, Bensheim, Germany) and frozen in liquid nitrogen for histological analyses. Residual MG tissue was cut, quickly frozen in liquid nitrogen, and stored at −80°C for later measurement of mRNA abundance. Liver, kidneys and abdominal fat pads were excised, weighed, rapidly frozen in liquid nitrogen and stored at −80°C.
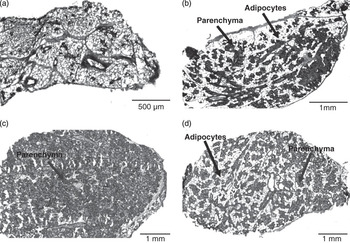
Three sections (16 μm in thickness) of the inguinal MG per histological slide (Superfrost® L75 × W25 × 1 mm, Carl Roth GmbH, Karlsruhe, Germany) were cut using a Leica CM 3050S cryostat microtome (Leica, Bensheim, Germany; inner temperature −26°C). When the MG was high in fat, the freeze spray Solidofix® (T200.1, Carl Roth GmbH, Karlsruhe, Germany) was used to prevent sections from smudging. The slides were stored at −80°C until staining and analyses. Standard hematoxyline and eosin (H&E) staining was performed and the fat-to-parenchyma ratio of the MG slices was analysed by image analysis. The system was equipped with a light microscope (Jenaval, Carl Zeis Jena, Göttingen, Germany), a digital camera (Altra 20, Olympus Soft Imaging Solutions GmbH, Münster, Germany), a computer, and image analysis software CellD (2006, Olympus Soft Imaging Solutions GmbH, Münster, Germany). Using the ‘Multiple Image Alignment’ function, high-resolution images of the complete slices were generated. The colour image was converted to a monochrome image using the green channel to obtain better contrast. A region of interest (ROI) covering the whole slice was defined. The monochrome images were subjected to interactive thresholding where the white area within the ROI represented adipose tissue and the grey area represented parenchymal tissue (Figure 1). The Phase Analysis function was used to evaluate area fractions according to the threshold settings. Every slide was treated in the same way and a mean value of parenchyma percentage from triplicate cuts per one dam (slide) was calculated using the following equation:

where ROI1, ROI2, ROI3 = areas of each cut per one slide (μm2), A1, A2, A3 = % parenchyma in ROI.
Representative micrographic pictures of the fourth inguinal mammary gland tissue of mouse dams fed a C diet: Pre-mating (A), day 14 of gestation (B), day 14 of lactation (C), 2 days after weaning (D). H&E staining, light areas correspond to adipose tissue, dark areas correspond to parenchyma. Magnifications × 40, scale bars are set according to the cutting area (cut thickness 16 μm).

Abundance of MG mRNA
β-Casein, whey acidic protein (WAP), α-lactalbumin and xanthine oxidoreductase (XOR) were chosen to reflect lactational status of the dams (Robinson et al., Reference Robinson, McKnight, Smith and Hennighausen1995; McManaman et al., Reference McManaman, Palmer, Wright and Neville2002; Anderson et al., Reference Anderson, Rudolph, McManaman and Neville2007). Aliquots of MG tissue (100 mg) were powdered in liquid nitrogen and the total RNA was extracted using TRIzol® Reagent (Invitrogen™, Invitrogen GmbH, Karlsruhe, Germany) according to the manufacturer’s protocol with an additional washing step and were re-suspended in 50 μl of water treated with diethyl pyrocarbonate. The integrity and purity of mRNA electrophoretic bands were visualized using ethidium bromide staining and checked at A260 nm/280 nm (Implen NanoPhotometer™, Implen GmbH, Munich, Germany). Total RNA was reverse transcribed into cDNA using random primers (Random Primers, Invitrogen, Karlsruhe, Germany; Hammon et al., Reference Hammon, Sauter, Reist, Zbinden, Philipona, Morel and Blum2003). Using High Pure PCR product Purification Kit (Roche Diagnostics GmbH, Mannheim, Germany) cDNA was purified according to the manufacturer’s protocol with an additional 10 min at room temperature before the last centrifugation. The pellet was stored at −20°C for further analyses. For the primers’ design the Primer3 web-based software (http://primer3.sourceforge.net/) was used. All primers were purchased from Sigma Genosys, Sigma-Aldrich Chemie GmbH, Taufkirchen, Germany: β-actin (165 bp), forward TGTTACCAACTGGGACGACA, reverse GGGGTGTTGAAGGTCTCAAA; β-casein (230 bp), forward AGAGGATGTGCTCCAGGCTA, reverse TAAGGAGGGGCATCTGTTTG; α-lactalbumin (214 bp), forward CTTGAATGGGCCTGTGTTTT, reverse TCTTCTTGGCACACGCTATG; WAP (179 bp), forward AACATTGGTGTTCCGAAAGC, reverse AGGGTTATCACTGGCACTGG; XOR (218 bp), forward TCCAGCTAACGT CCAGCTTT, reverse TGGCTTCTGAAGTGTCGATG.
Quantitative real-time reverse transcriptase (RT-PCR) was performed using the LightCycler® FastStart DNA Master SYBR Green I kit (Roche Diagnostics GmbH) according to the manufacturer’s instructions with the exception that final volume of the master mix was 9 μl. In all 1 μl of purified cDNA sample with master mix were loaded (eight to nine animals per each dietary group, measured in duplicates) into LightCycler® capillaries (20 μl, Roche Diagnostics GmbH). Thermal cycling conditions included the denaturation step at 95°C for 10 min, 40 cycles of amplification with 95°C for 15 s, 59°C for 10 s and 72°C for 30 s, melting curve (95°C for 2 s, 60°C for 10 s and 95°C) and cooling step for 1 min (40°C). Melting temperatures demonstrated specific PCR products. Upon agarose gel electrophoresis, all PCR products showed one single band of the expected size. Quantification of mRNA was carried out by relative expression using β-actin as reference gene transcript and calculated by the ΔΔcrossing point method (Pfaffl, Reference Pfaffl2001; Rasmussen, Reference Rasmussen2001; Hammon et al., Reference Hammon, Sauter, Reist, Zbinden, Philipona, Morel and Blum2003). The PCR efficiency was calculated based on the slope (10 × [−1/slope]) using LightCycler® software 4.05 (Roche Applied Science, Mannheim, Germany). Efficiency of PCR was between 1.8 and 1.9. Expression of β-actin in our study was not affected by different treatments. Inter- and intra-assay coefficients of variation for RT-PCR of target and reference genes were below 1%, respectively.
Statistical analyses
Data were analysed with the SAS statistical package (SAS® version 9.1, SAS Institute, Cary, NC, USA). To analyse the data sets, the MIXED procedure for separate time points of the experiment was applied. A one-factorial ANOVA (diet) was carried out for data obtained between mating and birth (two diets C, HP). For the comparison of offspring data obtained from day 1 after birth until after weaning (four dietary groups) the ANOVA model contained the fixed factors ‘gestation diet’ (G) and ‘lactation diet’ (L), interaction between ‘Gestation diet’ and ‘Lactation diet’, and random factor dam for the evaluation of the pup data. As ‘food intake’ (amount of food eaten) was significant for the variables maternal abdominal fat pad, liver, kidney and maternal BM, as well as litter mass and size, it was included in the model as a covariable. For the evaluation of the pup individual birth BM the main factor litter size was included in the model. Comparison of milk composition data between dietary groups was carried out for pooled samples of lactation days 3, 14 and 18 because of the small sample number for some of the individual time points. With the exception of food intake results are presented as LSM ± s.e. (least square means ± s.e.) adjusted for food intake unless indicated otherwise. The Tukey–Kramer correction for the post-hoc test of LSM was used to control the Type I experiment wise error rate. Significance was defined at P ⩽ 0.05 and trends if 0.05 < P ⩽ 0.10.
Results
Food intake, body and organ mass development in dams
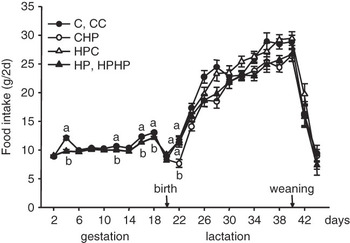
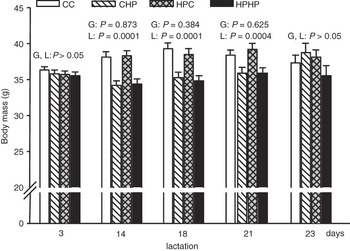
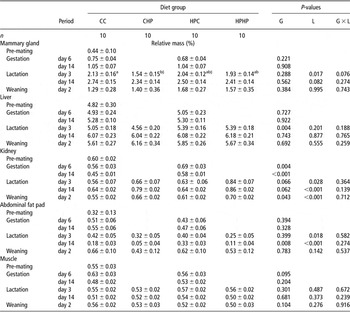
The total amount of food eaten during the gestation period, that is, 19.4 ± 0.5 days, was different with 93.6 ± 1.1 g and 98.6 ± 1.1 g in the HP and C groups, respectively (P < 0.01). During the whole lactation period (21 days) mice fed an HP diet ate less (230.0 ± 2.2 g v. 218.9 ± 2.1 g; P < 0.001). Overall, mouse dams fed an HP diet during gestation and/or lactation responded with a small but significant reduction (∼5%) of food intake during specific periods of gestation and lactation (Figure 2). The HP dams in comparison to the dams fed a C diet showed a tendency for a lower BM on day 14 of gestation (38.9 ± 0.3 g v. 39.8 ± 0.3 g; P = 0.074). In dams fed an HP diet during lactation BM was lower (P < 0.005; Figure 3). Throughout gestation up to day 14 of lactation BM was affected by maternal food intake (all P < 0.05). Feeding an HP diet during gestation was related to higher relative kidney mass of dams; during lactation relative kidney mass tended (P < 0.07) to be higher in dams fed an HP diet during gestation as compared to dams fed a C diet during gestation (Table 1). In dams fed an HP diet during lactation relative kidney mass was higher during lactation and after weaning in comparison to mice fed a C diet (Table 1). Liver mass was lower on day 3 of lactation in dams fed an HP diet during gestation.
Food intake (g/2 days) of mouse dams fed a C and an HP diet during gestation and lactation. Symbols represent LSM ± s.e.; C (during gestation), CC (filled circles); CHP (open circles); HPC (open triangles); HP (during gestation), HPHP (filled triangles). Symbols with different letters differ within day (P < 0.05). The data were analysed by two-way ANOVA (‘gestation diet’ and ‘lactation diet’) and interaction. Number of dams diminished during the study: gestation (n = 225–167), lactation (n = 160–77), weaning (n = 46).

Body mass of lactating mouse dams fed a C and an HP diet during gestation and/or lactation. Bars represent LSM ± s.e.; CC (white bars), CHP (white, hatched bars), HPC (grey, checked bars), HPHP (black bars). The P-values of main effects (gestation (G) and lactation (L) diet) are presented for each day. Interaction was not significant. The data were analysed by two-way ANOVA (‘gestation diet’ and ‘lactation diet’), interaction and covariable ‘food intake’. Number of dams in parentheses: day 3 (n = 157), 14 (n = 127), day 18 (n = 86), day 21 (n = 85) and day 2 after weaning on day 21 (n = 29).

Relative mammary gland (right inguinal), liver, right kidney, right abdominal fat pad and right thigh muscle (Quadriceps femoris) massFootnote 1 (% BM) at different gestation (G) and lactation (L) days collected from dams fed control (C) or an HP diet during gestation and/or lactation and after weaning

HP = high protein; BM = Body mass; CC = C diet during gestation and lactation; CHP = C diet during gestation and HP diet during lactation; HPC = HP diet during gestation and C diet during lactation; HPHP = HP diet during gestation and lactation.
1 Data were analysed by two-way ANOVA and interaction between ‘gestation diet’ and ‘lactation diet’. Values are least square means with s.e.
a,b Values within a row with unlike superscript letters differ at P < 0.05.
§ Indicates values tending to differ between diets at 0.05 < P ⩽ 0.1.
At day 3 of lactation abdominal fat pad was lower when dams were fed an HP diet, while on day 14 of lactation fat pad mass was higher in dams fed an HP diet during gestation, and was lower when dams were fed an HP diet during lactation.
Litter size and offspring mass at birth and BM development
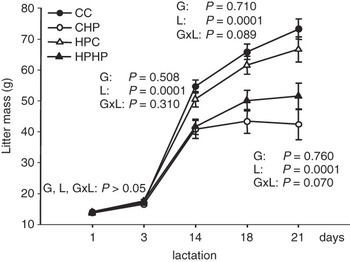
At birth the number of pups per litter was lower in HP dams (10.3 ± 0.3 v. 12.2 ± 0.3; P < 0.0001) and tended to be affected by maternal food intake (P = 0.09). Total litter mass at birth was 14.8 ± 0.3 g in HP and 16.8 ± 0.4 g in C groups, respectively, and was influenced by both gestation diet (P = 0.0002) and food intake of the dams (P = 0.03). Individual birth BM of female pups was affected by litter size (P < 0.0001) but not by maternal diet (C and HP 1.4 ±0.02 g; P = 0.732). Litter mass was affected by maternal food intake on days 1, 3 and 14 of life (all P < 0.05) but not on days 18 and 21. Lactation diet affected growth rates of standardized litters (n of pups = 10; P < 0.001); litter mass of dams fed an HP diet during lactation was lower at lactation days 14, 18 and 21 (Figure 4). Relative kidney mass (% BM) was greater in 21-day-old offspring when suckled by dams fed an HP diet during lactation as compared to their C diet counterparts (0.76% v. 0.63%; P < 0.001).
Development of total litter mass (standardized to 10 pups at birth) until weaning. Pups were exposed to maternal C and HP diet during in utero and/or early post-natal life until weaning. Symbols represent LSM ± s.e. for standardized litter mass; CC (filled circles), CHP (open circles), HPC (open triangles), HPHP (filled triangle). The P-values of main effects (gestation (G) and lactation (L) diet) and interaction are presented for each day. The data were analysed by two-way ANOVA (‘gestation diet’ and ‘lactation diet’), interaction and random factor dam. Number of litters in parentheses: day 1 (n = 165), day 3 (n = 132), day 14 (n = 49), day 18 (n = 33) and day 21 (weaning) (n = 32).

MG development
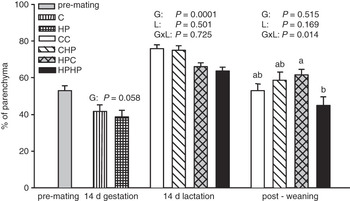
Dams fed an HP diet during lactation showed lower MG mass on day 3 of gestation than dams fed a C diet, whereas on lactation day 14 MG mass tended to be lower (P < 0.082) irrespective of the gestation diet (Table 1). On day 14 of lactation dams fed an HP diet during gestation showed a lower proportion of parenchyma (P = 0.0001; Figure 5). Two days after weaning parenchymal tissue proportion of the HPHP group was lowest (Figure 5; interaction G × L, P = 0.014).
Parenchyma proportion (% area) in mammary gland tissue of pregnant and lactating mouse dams fed a C and an HP diet during gestation and/or lactation. Bars represent LSM ± s.e.; pre-mating (grey bars), C (white, striped bars), HP (white, checked bars), CC (white bars), CHP (white, hatched bars), HPC (grey, checked bars), HPHP (black bars). The P values of main effects (gestation (G) and lactation (L) diet) and interaction are presented for each day. If interaction was significant letters indicate differences according to Tukey–Kramer test (post-weaning). The data were analysed by two-way ANOVA (‘gestation diet’ and ‘lactation diet’), interaction and covariable ‘food intake’. Number of dams in parentheses: pre-mating (n = 12), day 14 gestation (n = 19), day 14 lactation (n = 41) and post-weaning (n = 25). Values are calculated from weighted means (%) of triplicate histological cuts of the mammary gland tissue and expressed as % of total tissue area (100 = parenchyma + adipose tissue).

Milk composition
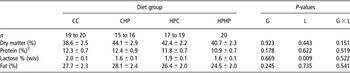
Milk lactose content of dams fed an HP diet during lactation (Table 2) was lower as compared to the group receiving C diet (P = 0.009). No difference in milk dry matter, protein and fat percentage of milk was observed between dietary groups (Table 2).
Dry matter, protein, lactose and fat contents in pooled milk (days 3, 14 and 18 of lactation) of mouse dams fed control (C) or HP diet during gestation (G) and/or lactation (L)Footnote 1
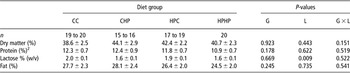
HP = high protein; CC = C diet during gestation and lactation; CHP = C diet during gestation and HP diet during lactation; HPC = HP diet during gestation and C diet during lactation; HPHP = HP diet during gestation and lactation.
1 The data were analysed by two-way ANOVA and interactions between ‘gestation diet’ and ‘lactation diet’. Values are least square means with s.e.
2 Protein (%) = N × 6.38.
Abundance of MG mRNA
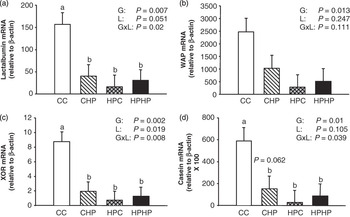
As expected lactogenic gene expression was much higher during lactation as compared to late gestation and post-weaning (data not shown). Transcript levels of WAP, β-casein, α-lactalbumin and XOR in MG on day 14 of lactation were affected by gestation diet (P < 0.05; Figure 6). Xanthine oxidoreductase and α-lactalbumin mRNA levels were also affected by lactation diet (P = 0.019 and P = 0.051). For all measured transcripts interactions between gestation and lactation diet were or tended to be significant (β-casein, α-lactalbumin and XOR levels, P < 0.05; for WAP, P = 0.11; Figure 6). Abundances of MG mRNA were lower by 60% to 90% in CHP, HPC and HPHP dams, respectively, as compared to the CC group (P < 0.01; Figure 6).
Mammary gland mRNA abundance of α-lactalbumin (A), WAP (whey acidic protein) (B), XOR (xanthine oxidoreductase) (C) and β-casein (D) relative to the expression of β-actin on day 14 of lactation in mouse dams fed a C and an HP diet during gestation and/or lactation. Bars represent LSM ± s.e.; CC (open bars), CHP (open, hatched bars), HPC (grey, checked bars), HPHP (closed bars). The P-values of main effects (gestation (G) and lactation (L) diet) and interaction are presented for each day. If interaction was significant letters indicate differences according to Tukey–Kramer test. The data were analysed by two-way ANOVA (‘gestation diet’ and ‘lactation diet’), interaction and covariable ‘food intake’. Number of dams in parentheses: CC (n = 8); CHP (n = 8); HPC (n = 9); HPHP (n = 9).

Discussion
This study provides evidence that an HP diet fed at beginning of mating and throughout gestation reduces litter size and offspring BM at birth in mice. Similar results were reported for rats (Daenzer et al., Reference Daenzer, Ortmann, Klaus and Metges2002), mice (Langhammer et al., Reference Langhammer, Derno, Dietrich, Renne, Nürnberg, Hennig and Metges2006) and pigs (Metges et al., Reference Metges, Lang, Goers, Junghans, Hennig, Stabenow, Schneider, Otten and Rehfeldt2009) exposed in utero to an HP diet, however, others found no differences (Thone-Reineke et al., Reference Thone-Reineke, Kalk, Dorn, Klaus, Simon, Pfab, Godes, Persson, Unger and Hocher2006). As mice dams consumed an HP diet already during the mating period, the reduced litter size probably reflects the detrimental effect of an HP diet during the implantation period as shown by others in mice (Gardner et al., Reference Gardner, Stilley and Lane2004; Mitchell et al., Reference Mitchell, Schulz, Armstrong and Lane2009). However, we found no indications for differences in percentage of successful pregnancies.
The HP diet during lactation was detrimental for pre-weaning pup growth. When dams received an HP diet during the lactation period, MG mass was lower irrespective of the gestation diet, which relates to the observed reduction of milk lactose concentration.
Dams fed an HP diet in gestation had a lower MG parenchyma proportion. Thus, an HP diet during gestation appears to be detrimental for the development of functional MG tissue. We have not measured insulin, prolactin and other hormones possibly acting as signal transducers and related to the MG phenotypes observed but we measured abundance of selected genes in MG to test whether this is related to altered milk composition and poor pups’ growth.
We found transient physiological changes in the abundance of MG lactogenic mRNA levels, with increasing levels for α-lactalbumin, β-casein, WAP and XOR at the onset of lactation as previously described (Robinson et al., Reference Robinson, McKnight, Smith and Hennighausen1995; McManaman et al., Reference McManaman, Palmer, Wright and Neville2002; Anderson et al., Reference Anderson, Rudolph, McManaman and Neville2007). On day 14 of lactation HP dams had a much lower mRNA level of all genes measured regardless whether the HP diet was fed prior or after parturition only or both in gestation and lactation. Among others, the two prolactin activated genes β-casein and WAP play a role in the successful onset and maintenance of lactation in rodents. They are also the most abundantly expressed genes in the MG epithelium and responsible for milk protein content (Robinson et al., Reference Robinson, McKnight, Smith and Hennighausen1995; Anderson et al., Reference Anderson, Rudolph, McManaman and Neville2007). Knock-out of β-casein (Kumar et al., Reference Kumar, Clarke, Hooper, Horne, Law, Leaver, Springbett, Stevenson and Simons1994), WAP (Triplett et al., Reference Triplett, Sakamoto, Matulka, Shen, Smith and Wagner2005), α-lactalbumin (Stacey et al., Reference Stacey, Schnieke, Kerr, Scott, McKee, Cottingham, Binas, Wilde and Colman1995) or XOR (Vorbach et al., Reference Vorbach, Scriven and Capeccchi2002) all resulted in disturbances of MG parenchymal differentiation. This can lead to impaired lactational performance and changes in milk composition that may be responsible for poor offspring growth. In wild-type mice β-casein constitutes about 25% of milk protein. However, in β-casein deficient transgenic mice the total milk protein content was only reduced by 10% (Kumar et al., Reference Kumar, Clarke, Hooper, Horne, Law, Leaver, Springbett, Stevenson and Simons1994). This observation might explain why we found no significantly reduced milk protein content in HP treated mouse dams although β-casein gene abundance in MG was only 10% of that in the CC group. In contrast, reduced milk protein content was reported for dietary protein restricted lactating rats (Pine et al., Reference Pine, Jessop and Oldham1994; Passos et al., Reference Passos, Ramos and Moura2000).
The XOR is an enzyme associated with milk fat globule membranes and plays a role in fat droplet transport into the alveolar lumen (McManaman et al., Reference McManaman, Palmer, Wright and Neville2002; Vorbach et al., Reference Vorbach, Scriven and Capeccchi2002). Female mice heterozygous for a XOR loss-of-function mutation were unable to maintain lactation due to a failure to secrete fat droplets into the milk and pups started to die on lactation day 12 due to malnourishment (Vorbach et al., Reference Vorbach, Scriven and Capeccchi2002). Although, HPC and HPHP lactating dams showed a decreased XOR expression in addition to a decreased parenchyma proportion no change in milk fat content was found. This suggests that XOR mRNA abundance was not limiting for milk fat secretion in lactating mice.
Lactose synthesis depends on α-lactalbumin, and lactose, as the major milk osmole, partly determines milk yield and rearing performance in mice (Stinnakre et al., Reference Stinnakre, Villotte, Soulier and Mercier1994; Stacey et al., Reference Stacey, Schnieke, Kerr, Scott, McKee, Cottingham, Binas, Wilde and Colman1995; Boston et al., Reference Boston, Bleck, Conroy, Wheeler and Miller2001). Thus, our finding of a much reduced MG α-lactalbumin mRNA expression together with reduced MG tissue mass in lactating dams fed an HP diet during lactation suggests that reduced pup growth might be linked to lower milk yield which in turn is possibly due to the observed lower lactose production. Interestingly, in spite of an 80% reduction of MG α-lactalbumin mRNA in dams fed an HP diet during lactation, milk lactose concentration was only reduced by 20%. Furthermore, dams fed an HP diet solely during gestation HPC successfully reared their offspring although MG α-lactalbumin mRNA abundance and parenchymal proportion were reduced. These dams had normal BM and MG mass, and showed only a moderate reduction in abdominal fat between lactation days 3 and 14. These observations suggest, that (i) α-lactalbumin mRNA is expressed in excess for the synthesis of lactose (Stinnakre et al., Reference Stinnakre, Villotte, Soulier and Mercier1994; Stacey et al., Reference Stacey, Schnieke, Kerr, Scott, McKee, Cottingham, Binas, Wilde and Colman1995) and (ii) feeding the control diet during lactation acutely rectifies MG performance by producing enough milk of satisfactory composition to enable pre-weaning catch-up growth.
The HP diet was formulated by isoenergetic substitution of carbohydrate for protein. Thus, the HP group was also exposed to a lower carbohydrate intake (378 v. 600 g carbohydrates/kg diet) as compared to the C group. Generally, a high protein and a low carbohydrate diet was related to lower plasma glucose and insulin levels (Lacroix et al., Reference Lacroix, Gaudichon, Martin, Morens, Mathé, Tomé and Huneau2004). In line with this, in dams fed an HP lactation diet plasma glucose concentrations at day 3 of lactation was lower (16.4 v. CC 20.7 mmol/l; P < 0.043; C. C. Metges et al. (unpublished results)). However, at peak lactation (day 14) plasma glucose was not reduced in dams receiving an HP lactation diet, presumably due to the upregulation of hepatic gluconeogenesis (Kuhla et al., Reference Kuhla, Kucia, Görs, Albrecht, Langhammer, Kuhla and Metges2010). Thus, the lower milk lactose content observed in dams fed an HP diet during lactation is likely independent of the dietary carbohydrate intake due to physiological adaptations in the maternal organism.
The CHP pups in our study had a similarly poor growth than HPHP pups, which is in agreement with the reduced milk lactose concentration of their mothers. In a separate study we found that the pups born to C dams but cross-fostered to dams fed an HP diet during both pregnancy and lactation thrive poorly and remain lighter (Langhammer et al., Reference Langhammer, Derno, Dietrich, Renne, Nürnberg, Hennig and Metges2006). These experiments provide additional evidence that milk of HP dams cannot support the early post-weaning growth as well as with milk of C dams, and leads to persistent growth retardation. Feeding dams the HP diet during gestation and Control diet during lactation resulted in catch up growth of the offspring that was observed also in rats (Daenzer et al., Reference Daenzer, Ortmann, Klaus and Metges2002) and mice (Langhammer et al., Reference Langhammer, Derno, Dietrich, Renne, Nürnberg, Hennig and Metges2006). This is also in line with the observation that gestation diet did not affect milk composition. Thus, acute effects of lactational HP diet were more detrimental for lactation. In contrast, persistent effects of gestational HP diet were observed only for MG parenchymal proportion but not in regard to MG mass, milk composition and the pup growth.
Diets rich in protein can reduce food intake as previously shown in rodents (Lacroix et al., Reference Lacroix, Gaudichon, Martin, Morens, Mathé, Tomé and Huneau2004). This satiating effect of protein might have also played a minor role in our study. However, the values presented in this report are adjusted for food intake and demonstrate a major effect of HP intake on gestational and lactational performance. With HP intake, excess nitrogen needs to be disposed by urea synthesis and glucose must be synthesized de novo (Kuhla et al., Reference Kuhla, Kucia, Görs, Albrecht, Langhammer, Kuhla and Metges2010) which are highly energy consuming processes. Thus, high protein diets provide less net energy than isoenergetic Control diets (Johnston et al., Reference Johnston, Day and Swan2002; Lacroix et al., Reference Lacroix, Gaudichon, Martin, Morens, Mathé, Tomé and Huneau2004; Pichon et al., Reference Pichon, Huneau, Fromentin and Tomé2006), which is reflected in the lower fat pad mass of dams fed an HP diet during lactation. Maternal kidney mass responded to an HP diet with an increase and in particular in the dams fed an HP diet during gestation and lactation. In addition, a higher relative kidney mass was observed in CHP and HPHP offspring which suggests a programming response to the maternal diet. Other authors reported that high dietary protein feeding increased absolute and relative mass of kidneys in rats and pigs due to increased glomerular filtration rate and cell hypertrophy (Schoknecht and Pond, Reference Schoknecht and Pond1993; Hammond and Janes, Reference Hammond and Janes1998; Murray et al., Reference Murray, Brown and Schoenl1998; Lacroix et al., Reference Lacroix, Gaudichon, Martin, Morens, Mathé, Tomé and Huneau2004).
In conclusion, our results provide evidence that HP diets fed during gestation and lactation result in lower maternal body and fat mass, and are detrimental for birth litter size and pre-weaning offspring growth. Reduced offspring growth due to high dietary protein intake during lactation was related to reduction in MG functional tissue and a decreased abundance of lactational genes, in particular a lower abundance of α-lactalbumin mRNA. The lower milk lactose content in the CHP and HPHP groups was possibly related to reduced milk yield and thus rearing success.
Acknowledgements
We thank K. Pilz, S. Dwars, I. Pappermann, S. Sondermann, M. Althaus, C. Reiko and K. Zorn for assistance with animal care, sample collection and gene expression studies. This work was supported by the Commission of the European Community, within the FP 6 priority 5.4.3.1, Food quality and safety (EARNEST, Food-CT-2005-007036). It does not necessarily reflect the views of the Commission and in no way anticipates its future policy in this area. No other financial or contractual agreements might cause conflicts of interest or be perceived as causing conflicts of interest. There are no financial arrangements between an author and a company whose product figures prominently in the paper.