Introduction
Frontal lobe dysfunction has been considered central to biological research in schizophrenia for over 30 years, a view that rests largely on the findings of functional imaging studies. Ingvar & Franzen's (Reference Ingvar and Franzen1974) original study found reduced prefrontal cerebral blood flow/metabolism, or hypofrontality, at rest. Weinberger et al. (Reference Weinberger, Berman and Zec1986) later found that patients with schizophrenia showed only marginal resting hypofrontality but failed to activate the dorsolateral prefrontal cortex (DLPFC) during performance of the Wisconsin Card Sorting Test (WCST). Numerous subsequent studies have reported negative as well as positive findings (e.g. Chua & McKenna, Reference Chua and McKenna1995), but both resting and activation hypofrontality are supported by meta-analysis (Hill et al. Reference Hill, Mann, Laws, Stephenson, Nimmo-Smith and McKenna2004).
More recent studies using voxel-based techniques have indicated a more complicated pattern of abnormality in schizophrenia. Of particular importance are two studies by Manoach et al. (Reference Manoach, Press, Thangaraj, Searl, Goff, Halpern, Saper and Warach1999) and Callicott et al. (Reference Callicott, Bertolino, Mattay, Langheim, Duyn, Coppola, Goldberg and Weinberger2000) that found evidence of increased activation in the PFC during performance of working memory tasks. Further studies have documented either hyperfrontality or a pattern of mixed hypo- and hyperfrontality (e.g. Callicott et al. Reference Callicott, Mattay, Verchinski, Marenco, Egan and Weinberger2003; Hugdahl et al. Reference Hugdahl, Rund, Lund, Asbjornsen, Egeland, Ersland, Landro, Roness, Stordal, Sundet and Thomsen2004; Thermenos et al. Reference Thermenos, Goldstein, Buka, Poldrack, Koch, Tsuang and Seidman2005; Tan et al. Reference Tan, Sust, Buckholtz, Mattay, Meyer-Lindenberg, Egan, Weinberger and Callicott2006; Schneider et al. Reference Schneider, Habel, Reske, Kellermann, Stocker, Shah, Zilles, Braus, Schmitt, Schlosser, Wagner, Frommann, Kircher, Rapp, Meisenzahl, Ufer, Ruhrmann, Thienel, Sauer, Henn and Gaebel2007). This led Glahn et al. (Reference Glahn, Ragland, Abramoff, Barrett, Laird, Bearden and Velligan2005) to conclude in a meta-analysis of studies using n-back tasks: ‘Although we find clear support for hypofrontality, we also document consistently increased activation in anterior cingulate and left frontal pole regions in patients with schizophrenia compared to that in controls.’
According to a leading explanation of this finding, whether hypofrontality or hyperfrontality is seen is related to the poor performance on cognitive tests which is also a feature of schizophrenia. Thus, Weinberger et al. (Reference Weinberger, Egan, Bertolino, Callicott, Mattay, Lipska, Berman and Goldberg2001) proposed that even when schizophrenic patients are able to keep up with processing demands, they do so less efficiently than controls, and this ‘working harder to keep up’ necessitates the recruitment of greater and/or less focused cerebral metabolic activity. Callicott et al. (Reference Callicott, Mattay, Verchinski, Marenco, Egan and Weinberger2003) and Manoach (Reference Manoach2003) have further proposed that there is an inverted U-shaped function between working memory load and PFC activation, such that increasing task demands are first associated with increasing activation, which then falls off after the subject's working memory capacity is exceeded. They argue that this curve is shifted to the left in schizophrenia, causing patients first to show more activation than controls at low task demands, but then to reach their maximum capacity earlier and thereafter show less activation.
A third possibility is that increased PFC activation in schizophrenia reflects a failure of deactivation. This possibility needs to be considered because it is now recognized that certain cortical regions, including two midline regions in particular (the ventral medial prefrontal and anterior cingulate cortex anteriorly and the posterior cingulate cortex/precuneus posteriorly), are active at rest but deactivate during performance of a wide variety of cognitive tasks. Together with some other cortical areas (e.g. the inferior parietal cortex and parts of the temporal lobe including the hippocampus), these are thought to constitute a ‘default mode network’ that is active at rest or when engaging in ‘stimulus-independent’ thought, but which undergoes a reduction in activity when attention-demanding goal-directed cognition needs to be undertaken (Gusnard et al. Reference Gusnard, Raichle and Raichle2001; Raichle et al. Reference Raichle, MacLeod, Snyder, Powers, Gusnard and Shulman2001; Greicius et al. Reference Greicius, Krasnow, Reiss and Menon2003; Gusnard, Reference Gusnard2005).
The aim of this study was to re-evaluate the findings of both increased and decreased PFC activation in schizophrenia. We also used a relatively large sample size to enable us to explore, in more detail than previous studies, the relationship of these findings to performance factors and the issue of task-related deactivation.
Method
Subjects
The patient sample consisted of 32 patients with chronic schizophrenia recruited from two psychiatric hospitals, Benito Menni CASM and Sant Joan de Déu SSM. They all met DSM-IV criteria for schizophrenia, based on interview by two psychiatrists and review of case-notes. Patients were excluded if: (a) they were younger than 18 or older than 65 years, (b) had a history of brain trauma or neurological disease, and (c) had shown alcohol/substance abuse within 12 months prior to participation. The controls consisted of 32 healthy individuals recruited from hospital staff and their acquaintances. They were selected to be age- and sex-matched to the patients and met the same exclusion criteria.
Pre-morbid IQ was estimated using the Word Accentuation Test (Test de Acentuación de Palabras, TAP; Del Ser et al. Reference Del Ser, Gonzalez-Montalvo, Martinez-Espinosa, Delgado-Villapalos and Bermejo1997), a test requiring pronunciation of words whose accents are removed. Patients were also required to have a current IQ in the normal range (i.e. 70+), as measured using four subtests of the Wechsler Adult Intelligence Scale III (WAIS-III) (vocabulary, similarities, block design, and matrix reasoning). All patients were scanned when in a relatively stable condition and all were taking antipsychotic medication (clozapine n=7, other atypicals n=10, typical neuroleptics n=3, combined typical and atypical treatment n=12). The mean daily dose (in chlorpromazine equivalents) was 736.27 mg (s.d.=584.60 mg). All participants gave written informed consent.
n-back task
The participants performed a sequential-letter version of the n-back task (Gevins & Cutillo, Reference Gevins and Cutillo1993). Two levels of memory load (1-back and 2-back) were presented in a blocked design manner. Each block consisted of 24 letters that were shown every 2 s (1 s on, 1 s off) and all blocks contained five repetitions (1-back and 2-back depending on the block) located randomly within the blocks. Individuals had to indicate repetitions by pressing a button. Four 1-back and four 2-back blocks were presented in an interleaved way, and between them a baseline stimulus (an asterisk flashing with the same frequency as the letters) was presented for 16 s. To identify which task had to be performed, characters were shown in green in 1-back blocks and in red in the 2-back blocks. All participants first went through a training session outside the scanner.
Behavioural data analysis
The behavioural measure used was the signal detection theory index of sensitivity, d′ (Green & Swets, Reference Green and Swets1966). Higher values of d′ indicate better ability to discriminate between targets and distractors. Subjects who had negative d′ values in either or both of the 1-back and 2-back versions of the task, which suggests that they were not performing it, were excluded from the study.
Functional magnetic resonance imaging (fMRI) data acquisition
In each individual scanning session 266 volumes were acquired from a 1.5-T GE Signa scanner. A gradient echo echo-planar imaging (EPI) sequence depicting the blood oxygenation level-dependent (BOLD) contrast was used. Each volume contained 16 axial planes acquired with the following parameters: TR=2000 ms, TE=40 ms, flip angle=70°, section thickness=7 mm, section skip=0.7 mm, in-plane resolution=3×3 mm. The first 10 volumes were discarded to avoid T1 saturation effects.
fMRI data analysis
fMRI image analyses were performed with the FEAT module, included in FSL software (Smith et al. Reference Smith, Jenkinson, Woolrich, Beckmann, Behrens, Johansen-Berg, Bannister, De Luca, Drobnjak, Flitney, Niazy, Saunders, Vickers, Zhang, De Stefano, Brady and Matthews2004). At a first level, images were corrected for movement and eventually co-registered to a common stereotaxic space (Montreal Neurologic Institute template). To minimize unwanted movement-related effects, individuals with an estimated maximum absolute movement >3.0 mm or an average absolute movement >0.3 mm were excluded from the study.
General linear models (GLMs) were fitted to generate individual activation maps for three different contrasts: baseline versus 1-back, baseline versus 2-back, and 2-back versus 1-back. Group comparisons between patients and controls were performed within the FEAT module, with mixed-effects GLM models (Beckmann et al. Reference Beckmann, Jenkinson, Woolrich, Behrens, Flitney, Devlin and Smith2006). Statistical tests were performed at the cluster level with a corrected p value of 0.05.
The group analyses were repeated but including the d′ values of each individual as covariates, and also, because differences in reaction time as well as task performance can affect the BOLD signal, including each individual's average reaction time as a covariate. All activation areas reported in the results were derived, at the group level, after applying thresholds to the z statistic images.
Results
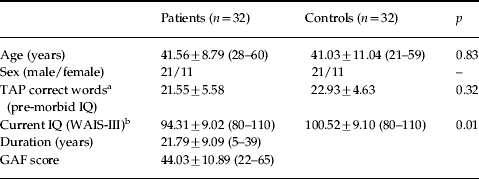
Demographic data on the patients and controls are shown in Table 1. The groups were preselected to be matched for age and sex. Patients were also similar to controls in terms of estimated pre-morbid IQ. However, the patients had significantly lower current IQs than controls.
Demographic characteristics of patients and controls
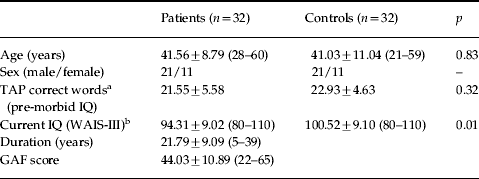
TAP, Word Accentuation Test (Test de Acentuación de Palabras); WAIS-III, Wechsler Adult Intelligence Scale III; GAF, Global Assessment of Functioning.
Values are given as mean±standard deviation (range).
a Missing data for three patients and five controls.
b Missing data for three controls.
Behavioural performance
The patients were significantly impaired compared to the controls on both the 1-back (mean d′=3.46, s.d.=1.06 versus mean d′=4.44, s.d.=0.61, p<0.001) and 2-back (mean d′=2.16, s.d.=0.97 versus mean d′=3.17, s.d.=0.87, p<0.001) versions of the task.
Within-group fMRI findings
The most extensive and relevant patterns of activation were observed in the 2-back versus baseline contrast. Results for the other two contrasts (1-back versus baseline and 2-back versus 1-back) involved similar regions but frequently with less coverage. Therefore, only results concerning the 2-back versus baseline contrast are reported here.
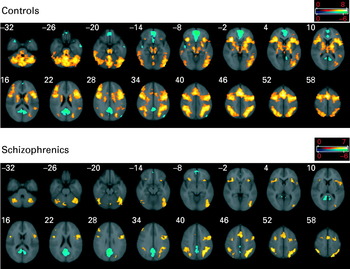
Controls showed mean significant activations in a range of areas (see Fig. 1), all of them belonging to a large contiguous significant cluster with maximum peak activation in Brodmann area 6 (BA 6) [Talairach (4, 6, 54), z score=8.19, p<10−10]. This cluster included the left and right cerebellum, extending bilaterally to temporal and occipital regions, posterior parietal areas, the basal ganglia and both thalami. It also involved parts of the left and right insula, stretching to neighbouring regions of the frontal operculum, and dorsally to the precentral gyrus, with extensions to the left and right DLPFC (middle and superior frontal gyri) and supplementary motor areas.
Brain regions showing a significant effect of the 2-back versus baseline contrast in controls and in patients separately. Yellow colours indicate a positive association (activation) with the 2-back memory task. Blue colours are for areas where the task led to a decrease in the blood oxygenation level-dependent (BOLD) response (areas of deactivation). Numbers refer to Talairach z coordinates of the slice shown. The right side of each image represents the left side of the brain. Colour bars indicate z scores from the group-level analysis.
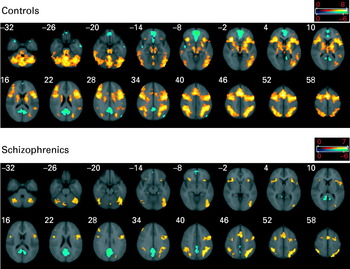
Areas in which performance of the task led to decreases in the BOLD response were also found in the controls (Fig. 1). These areas were characterized by a significant negative coefficient for the 2-back versus baseline contrast. In other words, these areas showed deactivation during performance of the n-back task. They included two large medial clusters, one anterior, extending from the medial orbital regions (gyrus rectus) dorsally to other frontal areas, and reaching a significant portion of the anterior cingulate gyrus [peak activation in BA 10/11, Talairach (−6, 56, 8), z score=6.94, p<10−10]. The other, more posterior, cluster included dorsal medial parts of the occipital cortex (the cunei), extending dorsally to the precuneus and anteriorly to the posterior cingulate cortex [maximum activation in BA 23, Talairach (−0, −50, 30), z score=6.48, p<10−10]. Additionally, deactivation was observed to a lesser extent and with less strength in areas of the temporal poles and the right post-central gyrus.
As shown in Fig. 1, the pattern of activations in the patients was similar but considerably less marked than in the controls. Again, as in the controls, deactivations were seen but these were also less marked, being restricted mainly to the precuneus/posterior cingulate cluster [peak activation in BA 26, Talairach (6, −54, 26), z score=6.9, p<10−10], with only a small area of deactivation being evident in the medial PFC adjacent to the anterior cingulate gyrus [maximum activation in BA 10/11, Talairach (4, 56, −6), z score=4.67, p=8.86×10⁻⁴]. This pattern remained unchanged when neuroleptic dosage, as chlorpromazine equivalents, was entered as a covariate in the analysis.
fMRI findings in patients versus controls
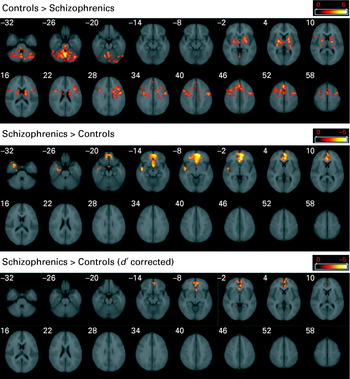
Although the 1-back versus baseline contrast did not reveal any significant differences in activation, the 2-back versus baseline contrasts showed several areas of differential activation between the two groups (see Fig. 2).
Brain regions showing significant differences between patients and controls for the 2-back memory versus baseline contrast. Upper figure depicts areas where controls activate more than patients, middle and lower figures show the converse (areas where patients activate more than controls), without using performance scores as covariates (middle) and when they were included in the model (lower). Numbers refer to Talairach z coordinates of the slice shown. The right side of each image represents the left side of the brain. Colour bars indicate z scores from the group-level analysis.
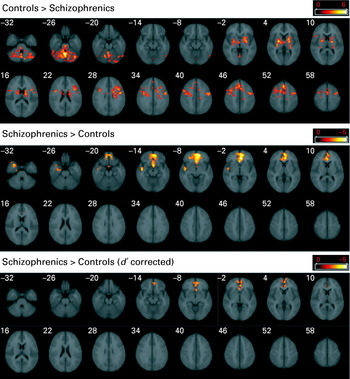
Controls activated more than patients in the cerebellum [peak activation in Talairach (2, −56, −26), z score=6.11, p=5.96×10⁻⁸], basal ganglia and right thalamus [peak activation in the right pallidum, Talairach (24, −4, 2), z score=4.47, p=0.00565] and in a set of connected frontal regions. These stretched bilaterally from areas around the frontal operculum to both precentral gyri and supplementary motor areas, reaching some sections of the right middle lateral PFC [maximum activation in BA 8, Talairach (4, 24, 52), z score=4.45, p<10−10].
As shown in Fig. 2, the patients showed significantly greater activation relative to controls in an area that almost completely matched with one of the regions where there was deactivation in controls. This area extended over the gyrus rectus bilaterally, related frontomedial structures, and the anterior cingulate gyrus [peak activation in BA 11, Talairach (−2, 38, −2), z score=5.02, p=2.38×10⁻⁷]. There was a second, smaller and weaker cluster of significantly greater activation relative to controls affecting parts of the right hippocampal complex and neighbouring anterior temporal regions [BA 21/48, Talairach (48, −8, −14), z score=3.83, p=0.0332], an area where, once again, the controls showed significant deactivation (see Fig. 1).
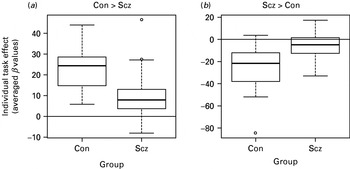
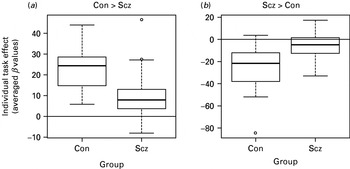
Such coupling between greater relative activation in patients (between-group comparison) and significant deactivation in controls (within-group analysis) suggested a failure to deactivate by the patients in these areas. This was confirmed by obtaining averages from the individual statistical maps of contrast coefficients (β values), over the areas with significant group differences. Box plots (see Fig. 3) show a failure to activate by patients in areas where controls activated significantly more than patients, and a failure to deactivate by patients in areas where patients showed apparent greater activation than controls (note the dominance of positive coefficients in the first plot and of negative values in the second plot).
Boxplots based on averaged levels of activation from each individual in the 2-back versus baseline contrast. (a) Regions of interest including all voxels with significantly higher activation in controls (see upper row of Fig. 2) were used to extract averaged values from individual maps of coefficients (β values) for this contrast (a measure of the absolute effect of the 2-back task in the selected set of regions, comparable between subjects). (b) Values shown are based on regions of interest extracted from all areas where patients activated more relative to controls (middle row of Fig. 2). Although positive coefficients dominate (a), that is controls activate more than patients, the prevalence of negative coefficients in (b) suggests a failure to deactivate in the patients with schizophrenia. Con, Controls; Scz, schizophrenia patients.
Relationship to task performance
Figure 2 (bottom row) shows that, when each subject's d′ score on the 2-back task was entered as a covariate in the 2-back versus baseline contrast between patients and controls, there were no longer any regions where the patients showed significantly less activation than the controls. However, a smaller subset of the voxels, located in the anterior medial brain, where previously there was failure to deactivate, was still significant [peak activation in Talairach (−2, 38, −2), z score=3.52, p=0.013]. Hence, failure to deactivate in the patients was the only remaining differential trait after correcting for task performance. Similar results were obtained when the reaction time was covaried. Most areas where the schizophrenic patients showed less activation than the controls were lost (only some areas of the cerebellum were preserved) but the failure to deactivate in the anterior medial brain remained significant.
Discussion
As in other studies, we found that patients with schizophrenia showed reduced activation in a network of frontal and other brain regions normally activated during performance of a working memory task. These included part of the right DLPFC, the frontal opercular region bilaterally and also the supplementary motor area bilaterally, the basal ganglia, cerebellum and the thalamus on the right. These regions overlap with those identified by Glahn et al. (Reference Glahn, Ragland, Abramoff, Barrett, Laird, Bearden and Velligan2005) in a meta-analysis of studies using the n-back task in schizophrenia, although there are some differences: Glahn et al. (Reference Glahn, Ragland, Abramoff, Barrett, Laird, Bearden and Velligan2005) found that schizophrenic patients showed reduced activation in bilateral DLPFC (BA 9) and the rostral PFC (BA 11), whereas we found DLPFC underactivation only on the right, where it was restricted to a relatively small area.
In addition to areas of reduced activation, the patients in our study showed apparent hyperactivation in an area of the medial and inferior PFC, including part of the anterior cingulate cortex and gyrus rectus. Once again, this finding is similar to that of other studies: Glahn et al. (Reference Glahn, Ragland, Abramoff, Barrett, Laird, Bearden and Velligan2005) identified the anterior cingulate and left frontal polar regions as showing consistently increased activation across studies in their meta-analysis. Where our findings differ from those of other studies, however, is that further analysis indicated that the difference between the patients and controls in this region was due to failure of deactivation. This, rather than any intrinsically greater activation, accounted for the apparent ‘hyperfrontality’ seen in this area.
Only a few functional imaging studies of schizophrenia have reported deactivations. Frith et al. (Reference Frith, Friston, Herold, Silbersweig, Fletcher, Cahill, Dolan, Frackowiak and Liddle1995) found that schizophrenic patients showed less deactivation than controls in the superior temporal gyrus during performance of a verbal fluency task. Here, however, the controls' deactivation was relative, being less than the activation in a control condition of word repetition. This finding was also not replicated by Spence et al. (Reference Spence, Liddle, Stefan, Hellewell, Sharma, Friston, Hirsch, Frith, Murray, Deakin and Grasby2000), although Artiges et al. (Reference Artiges, Martinot, Verdys, Attar-Levy, Mazoyer, Tzourio, Giraud and Paillere-Martinot2000) found less deactivation in the right inferior parietal cortex during a verbal fluency task (and a word production task). Using a memory task, Fletcher et al. (Reference Fletcher, McKenna, Frith, Grasby, Friston and Dolan1998) found that normal controls and memory-unimpaired schizophrenic patients showed deactivation in the medial PFC but memory-impaired patients did not. Three studies reporting deactivations have used working memory tasks: one (Walter et al. Reference Walter, Vasic, Hose, Spitzer and Wolf2007) found that schizophrenic patients failed to deactivate in the superior temporal cortex, but the other two (both of which used the n-back task) had findings comparable with ours. Meyer-Lindenberg et al. (Reference Meyer-Lindenberg, Olsen, Kohn, Brown, Egan, Weinberger and Berman2005) found failure of deactivation of the medial PFC, along with the left parahippocampal gyrus, lateral and inferior temporal cortex bilaterally, the medial parietal lobule bilaterally and both angular gyri. Menzies et al. (Reference Menzies, Ooi, Kamath, Suckling, McKenna, Fletcher, Bullmore and Stephenson2007) used the n-back task in a study whose primary aim was to examine the effects of gamma-aminobutyric acid (GABA)-modulating drugs on brain function in schizophrenia. In the placebo condition, they found that 11 normal controls showed activation in a network of prefrontal, anterior cingulate, premotor and parietal areas, and also a pattern of deactivation in a network that included the medial frontal and anterior cingulate cortex, posterior cingulate and parieto-occipital cortex. Eleven schizophrenic patients showed respectively significantly reduced activation and significantly reduced deactivation in these networks.
Together with these last two findings, our results suggest that the nature of the prefrontal functional imaging abnormality in schizophrenia is not simply one of hypofrontality, task-related hypofrontality or hyperfrontality. Rather, it takes the form of a failure both to activate and to deactivate prefrontal and other regions necessary for the performance of tasks such as the n-back task. Such a view has the potential to simplify increasingly complicated functional imaging findings in schizophrenia, which previously culminated in claims for simultaneous hypo- and hyperfrontality, into an inability to configure, through a combination of activation and deactivation, the right network of active brain regions for performance of frontal or executive tasks. Menzies et al. (Reference Menzies, Ooi, Kamath, Suckling, McKenna, Fletcher, Bullmore and Stephenson2007) also came to a similar conclusion, interpreting their findings of both reduced activation and reduced deactivation in schizophrenia in terms of a relative inefficiency of resource allocation between functionally competitive large-scale neurocognitive systems.
This interpretation differs substantially from that of Callicott et al. (Reference Callicott, Mattay, Verchinski, Marenco, Egan and Weinberger2003) and Manoach (Reference Manoach2003), who have argued that whether hypo- or hyperfrontality is seen in schizophrenia depends on a shift to the left in an inverted U-shaped function between task demands and prefrontal activation. Two of our findings are difficult to reconcile with their account, however. First, the hypoactivation and (apparent) hyperactivation we found were in different areas of the frontal cortex. Second, according to Callicott et al. (Reference Callicott, Mattay, Verchinski, Marenco, Egan and Weinberger2003) and Manoach (Reference Manoach2003), whether hypo- or hyperfrontality is seen in schizophrenic patients is ultimately a function of their poor task performance, which leads them to increase prefrontal activation more at low task demands and then to enter the phase of decreasing activation before normal subjects do. However, our findings with respect to performance indicate that, although the schizophrenic patients' failure to activate was related to their poorer performance on the n-back task, their failure to deactivate could not be fully accounted for in this way, as it remained evident even after their poorer performance was controlled for.
This last finding may also have wider implications. An enduring debate in functional imaging research has been whether task-related hypofrontality in schizophrenia reflects an intrinsic brain abnormality, or whether it merely indexes the fact that the patients are performing more poorly on the task concerned and so activating their frontal lobes to a correspondingly lesser extent (for a discussion, see Fletcher et al. Reference Fletcher, McKenna, Frith, Grasby, Friston and Dolan1998). Our finding that hyperactivation, or rather failure of deactivation, persists after controlling for n-back task performance suggests that at least one type of prefrontal functional imaging abnormality in schizophrenia cannot be attributed to impaired performance and so might be linked to the disease process itself.
The medial frontal area in which we found failure of deactivation in schizophrenia was in of one of the two major midline components of the default mode network. The obvious inference is that there is default mode network dysfunction in schizophrenia. This interpretation is supported by (a) the spatial correspondence between this area and that identified in studies of the default mode network (e.g. Gusnard et al. Reference Gusnard, Raichle and Raichle2001; Raichle et al. Reference Raichle, MacLeod, Snyder, Powers, Gusnard and Shulman2001), and (b) the fact that the controls in our study showed deactivation in the same area while performing the n-back task. Menzies et al. (Reference Menzies, Ooi, Kamath, Suckling, McKenna, Fletcher, Bullmore and Stephenson2007) also interpreted the failure to deactivate they found in schizophrenia in terms of default mode network dysfunction. However, as neither we nor Menzies et al. (Reference Menzies, Ooi, Kamath, Suckling, McKenna, Fletcher, Bullmore and Stephenson2007) set out specifically to examine default mode network function in schizophrenia, such an interpretation should be regarded as provisional. We also cannot exclude the possibility that less efficient cognitive performance and/or use of different cognitive strategies, which Weinberger et al. (Reference Weinberger, Egan, Bertolino, Callicott, Mattay, Lipska, Berman and Goldberg2001) and Manoach (Reference Manoach2003) have invoked to account for the finding of apparent increased prefrontal activation in schizophrenia, might also in some way influence the pattern of fMRI change to result in our finding of apparent deactivation.
To date, five other studies (Bluhm et al. Reference Bluhm, Miller, Lanius, Osuch, Boksman, Neufeld, Theberge, Schaefer and Williamson2007; Calhoun et al. Reference Calhoun, Maciejewski, Pearlson and Kiehl2007; Garrity et al. Reference Garrity, Pearlson, McKiernan, Lloyd, Kiehl and Calhoun2007; Harrison et al. Reference Harrison, Yucel, Pujol and Pantelis2007; Zhou et al. Reference Zhou, Liang, Tian, Wang, Hao, Liu, Liu and Jiang2007) have investigated the default mode network in schizophrenia. Although they all found evidence of dysfunction, their findings have often been complex and have not been consistent across studies. Like us, Calhoun et al. (Reference Calhoun, Maciejewski, Pearlson and Kiehl2007) found attenuated reductions in default mode activity during performance of an auditory oddball task in 21 schizophrenic patients compared to 26 controls. Two studies, however, had opposite results to ours: Harrison et al. (Reference Harrison, Yucel, Pujol and Pantelis2007) found that 12 schizophrenic patients showed greater deactivation of both the anterior and posterior cingulate midline loci than in 14 controls during a task requiring response suppression. Using an auditory oddball task, Garrity et al. (Reference Garrity, Pearlson, McKiernan, Lloyd, Kiehl and Calhoun2007) found that 21 patients with schizophrenia showed a complex pattern of abnormality compared to 22 normal controls, but deactivation was increased in the anterior cingulate/superior medial frontal gyri. The remaining two studies (Bluhm et al. Reference Bluhm, Miller, Lanius, Osuch, Boksman, Neufeld, Theberge, Schaefer and Williamson2007; Zhou et al. Reference Zhou, Liang, Tian, Wang, Hao, Liu, Liu and Jiang2007) focused exclusively on connectivity, and cannot be directly compared with our findings. Of note, Kennedy et al. (Reference Kennedy, Redcay and Courchesne2006) have also documented default mode network dysfunction in adult high-functioning autistic-spectrum patients, although they found that the failure of deactivation affected both the anterior and posterior midline loci of the network.
A dysfunctional default mode network in schizophrenia clearly has intriguing theoretical possibilities. As this network normally deactivates during performance of cognitive tasks, failure to deactivate could be relevant to the cognitive impairment seen in the disorder – the proposal of default mode interference (Sonuga-Barke & Castellanos, Reference Sonuga-Barke and Castellanos2007). Gusnard et al. (Reference Gusnard, Raichle and Raichle2001) have also reviewed various lines of evidence that suggest that different parts of the default mode network are involved in gathering information about the world, orienting oneself to salient environmental stimuli, theory of mind and self-representation. Other proposed functions include retrieving autobiographical memories, planning for the future and wandering of the mind (see Williamson, Reference Williamson2007). These functions have been argued to be consistent with an overall role of the default mode network in the experience and maintenance of one's sense of self (Gusnard, Reference Gusnard2005). Default mode network dysfunction would thus seem to have the potential to account for two major realms of abnormality in schizophrenia: symptoms and cognitive impairment.
Acknowledgements
This study was funded by a Marie Curie European Reintegration Grant (MERG-CT-2004-511069) given to E.P.-C. and by five grants from the Spanish Ministry of Health: PI05/2693 (E.P.-C.), CP04/00322 and PI05/1874 (R.S.), FI05/00322 (J.G.) and CA06/0129 (J.O.-G.). S. Sarró has contributed significantly to this work and, in consequence, it will be included as part of his doctoral thesis at the Universitat Autònoma de Barcelona. We thank Tom Cullen for his helpful suggestions in the analysis of the data.
Declaration of Interest
None.