Introduction
Protected areas should serve as refuges for wildlife, offering environments in which species can thrive without significant human interference. Protected areas around the world today typically have strict rules that prohibit physical interventions within the boundaries of, for example, national parks and nature reserves (Casson et al. Reference Casson, Martin, Watson, Stringer, Kormos and Locke2016). However, external factors such as anthropogenic noise can penetrate protected areas. Buxton et al. (Reference Buxton, McKenna, Mennitt, Fristrup, Crooks and Angeloni2017) demonstrated that human-produced noise has resulted in a doubling of background sound levels in 63% of protected areas across the continental USA, with 21% experiencing a 10-fold or greater increase. In Europe, c. 29% of the total area within the Natura 2000 protected areas network is affected by transportation noise at average levels exceeding 55 dB (European Environment Agency 2025).
For wildlife species, noise pollution can mask sounds and interfere with animals’ ability to detect natural sounds such as mating calls, conspecific communication or predator cues (Francis et al. Reference Francis, Ortega and Cruz2009, Brumm Reference Brumm2013, Duquette et al. Reference Duquette, Loss and Hovick2021). To cope with noise pollution, some animals change their foraging, vigilance or movement behaviour (Kight & Swaddle Reference Kight and Swaddle2011, Francis & Barber Reference Francis and Barber2013). However, changes in behaviour to cope with noise are not necessarily enough to avoid physiological effects. Animals exposed to noise have been found to have elevated levels of stress hormones, which ultimately influence individual fitness (Shannon et al. Reference Shannon, McKenna, Angeloni, Crooks, Fristrup and Brown2016). The outcome of chronic noise exposure can extend from effects on individuals’ fitness, leading to changes in species interactions within a community and triggering shifts in communities and cascading effects on ecosystems (Senzaki et al. Reference Senzaki, Kadoya and Francis2020, Kleist et al. Reference Kleist, Fristrup, Buxton, McKenna, Job and Angeloni2023, Kok et al. Reference Kok, Berkhout, Carlson, Evans, Khan and Potvin2023).
Noise is often associated with other anthropogenic disturbances, such as physical habitat degradation and light pollution, which could be confounding factors when interpreting wildlife responses to noise pollution (Dominoni et al. Reference Dominoni, Halfwerk, Baird, Buxton, Fernández-Juricic and Fristrup2020). However, compelling evidence from field experiments demonstrates that road noise per se is affecting wildlife. For example, areas with road playbacks decrease abundance and increase avoidance behaviours of some bird species (McClure et al. Reference McClure, Ware, Carlisle, Kaltenecker and Barber2013), and similar bat activities also decrease (Finch et al. Reference Finch, Schofield and Mathews2020). Even in protected areas without physical degradation or light pollution, noise can penetrate their edges and affect wildlife inside these protected areas (Dominoni et al. Reference Dominoni, Halfwerk, Baird, Buxton, Fernández-Juricic and Fristrup2020). Edge-related stressors (e.g., noise pollution) disproportionately impact the interiors of smaller protected areas (Schauman et al. Reference Schauman, Peñuelas, Jobbágy and Baldi2024).
A key challenge in assessing the impact of noise pollution on wildlife is the limited availability of relevant data. Existing noise maps and datasets are primarily designed to assess risks to human health (European Commission n.d.). Road noise levels exceeding 53 dB Lden (day–evening–night; see Appendix S1 Box S1a for definitions) and 45 dB Lnight are considered harmful to human health (World Health Organization 2018). A recent European Union (EU) report used Lden 55 dB as a threshold to assess the impacts of transportation noise on biodiversity (European Environment Agency 2025). However, anthropogenic noise can affect wildlife at average sound levels well below those considered harmful to humans within the audible (sonic) range. A global synthesis by Shannon et al. (Reference Shannon, McKenna, Angeloni, Crooks, Fristrup and Brown2016), reviewing 242 studies, found that terrestrial wildlife responses commonly begin at 40 dB, with c. 20% of studies reporting impacts below 50 dB. Experimental evidence further supports these findings; for example, Montenegro et al. (Reference Montenegro, Service, Scully, Mischler, Sahu and Benowicz2021) showed that songbirds exhibit impaired acoustic discrimination when exposed to anthropogenic noise at 40 dB. Even moderate anthropogenic noise can alter bird behaviour, and brief, high‑intensity noise events may be disruptive irrespective of average sound levels (Engel et al. Reference Engel, Young, Davies, Waddington and Wood2024).
In this study, we evaluated the extent to which 2400 terrestrial protected areas in Norway (Table S1) are exposed to noise pollution within the sonic range. Norway is the sixth-largest country in Europe by area, but it is the second least populated and ranks as the second quietest country in Europe after Iceland (Blanes et al. Reference Blanes, Fons, Ubacg, Milego and Peris2024, Eurostat 2025). In line with national guidelines for noise management in land‑use planning, a limit of 55 dB Lden is normally applied by the Norwegian Public Roads Administration for both noise mapping and mitigation of human health impacts (Klima- og miljødepartementet 2021). However, stricter thresholds apply in natural areas, where a recommended limit of 40 dB Lden is used for large, contiguous recreational and near‑urban forest areas (Klima- og miljødepartementet 2021). We used a three-step approach that combined publicly available data, refined noise model output and in situ noise measurements.
Step 1: national-level mapping
We conducted an overlay analysis by combining digital protected area maps with existing publicly available transportation noise maps. We considered transportation noise both as a weighted equivalent (Appendix S1 Box S1) across 24 h (Lden; day–evening–night) and separately for the night period (Lnight), because many wildlife species are nocturnal. In addition, we examined the relationship between the proportion of each protected area exposed to transportation noise and the total size of the protected area.
Step 2: enhanced noise maps for selected protected areas
Because average noise levels below 50 dB within the existing noise map layers are associated with high uncertainty, we used road noise zones modelled down to 40 dB – produced by the Norwegian Public Roads Administration upon request – for a targeted subset of two national parks and 15 protected areas prioritized for bird and wildlife conservation.
Step 3: field validation at a key nature reserve
To further improve accuracy, we conducted in situ field measurements of road noise at Norway’s first Ramsar site. These measurements aimed to capture maximum levels of road noise and to quantify the diel variation in sound levels.
Methods
Publicly available data sources
We used the layer for Naturvernområde (protected areas) from the Norwegian Environment Agency (Miljødirektoratet 2021). This layer contains 2484 protected areas categorized as terrestrial, which also include all protected wetlands and freshwater habitats. Terrestrial protected areas in Norway are aggregated into nature reserves (corresponding to International Union for Conservation of Nature (IUCN) category Ia), national parks (IUCN category II), landscape protection areas (IUCN categories IV and V) and other forms of protection (see details in Table S1; Dudley Reference Dudley2008, Miljødirektoratet 2021). Our analyses included 2166 terrestrial nature reserves, national parks and landscape protection areas.
To calculate the extent of protected areas exposed to transportation noise, we used noise zone maps with day–evening–night averaged levels (Lden) from three different sources: roads (major highways and roads in main cities), major airports and railways. Main cities have ≥100 000 inhabitants, major roads have ≥3 million vehicles per year, major airports have ≥50 000 air traffic movements per year and major railways have ≥30 000 trains per year. For roads and airports, noise zones in publicly available noise zone maps are modelled down to 50 dB, whereas for railways they are only modelled down to 58 dB. For road and airport noise zones, we used layers from the Norwegian Environment Agency’s Strategic Noise Mapping (Norwegian Environment Agency 2022), and for railways we used the layer of noise zones for Bane NORs railway network (Bane NOR SF 2016).
Enhanced noise model for sound levels down to 40 dB
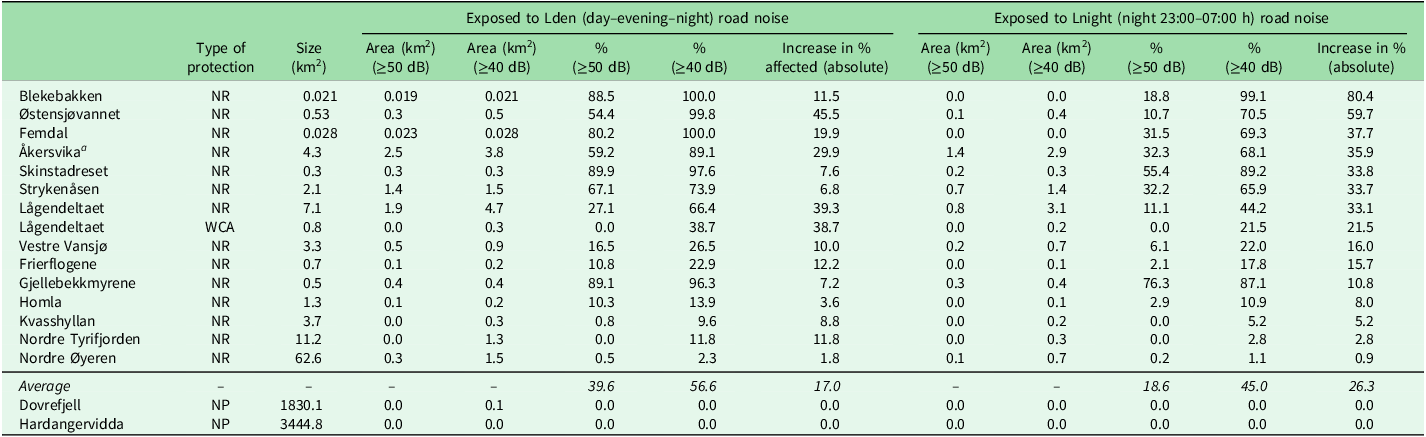
For 17 protected areas, we compared noise exposure from public transport maps (≥50 dB) with newly developed maps using a lower threshold (≥40 dB). The selected protected areas were either transected by or located near major roads, and they included 14 nature reserves identified as critical habitats for wildlife, particularly birds, in addition to one designated wildlife conservation area and two national parks (see Table 1).
Area (km2) and percentage (%) of protected area exposed to road noise down to 50 and 40 dB for Lden and Lnight in 17 protected areas in Norway, based on publicly available (50-dB threshold) versus refined (40-dB threshold) noise layer maps. See Fig. 2 and Appendix S1 Fig. S3 for visualizations of spatial extent for nature reserve (NR) and wildlife conservation area (WCA) protected areas.

Table 1 Long description
A table comparing the area and percentage of protected areas exposed to road noise down to 50 and 40 dB for Lden and Lnight in 17 protected areas in Norway. The table has 17 rows and 12 columns. The columns are labeled as follows: Type of protection, Size (km^2), Exposed to Lden (day-evening-night) road noise (Area (km^2) >=50 dB, Area (km^2) >=40 dB, % >=50 dB, % >=40 dB, Increase in % affected (absolute)), and Exposed to Lnight (night 23:00-07:00 h) road noise (Area (km^2) >=50 dB, Area (km^2) >=40 dB, % >=50 dB, % >=40 dB, Increase in % affected (absolute)). The rows list different protected areas with their respective data. Notable trends include varying levels of noise exposure across different protected areas, with some areas showing significant increases in affected percentages when the threshold is lowered from 50 dB to 40 dB.
aIn situ field measurements of sound levels were carried out just outside the Åkersvika Nature Reserve – see Fig. 3.
NP = national park.
At our request, the Norwegian Public Roads Administration modelled road noise zones down to 40 dB for a subset of 17 protected areas (Appendix S1 Fig. S1). Noise zone maps were calculated using the tool NorStøy according to the CNOSSOS method (Kephalopoulos et al. Reference Kephalopoulos, Paviotti, Anfosso-Lédée, Van Maercke, Shilton and Jones2014). NorStøy is developed by the Norwegian Public Roads Administration for general noise mapping (e.g., calculations of road traffic noise in accordance with the EU Environmental Noise Directive; European Commission n.d.). The tool is not designed for detailed noise assessments as in regulation or construction plans due to a relatively high uncertainty in input data and results.
Using the NorStøy model, updated noise zone maps were generated for Lden and Lnight for sound levels as low as 40 dB at a height of 4 m above ground level. The modelling was carried out in accordance with the EU Environmental Noise Directive (European Commission n.d.), and it incorporated terrain data from the joint map database Felles Kartdatabase (FKB; Geonorge n.d.). The inputs included average annual daily traffic volumes down to 500 vehicles on national and county roads (Årsdøgntrafikk, ÅDT), the proportion of heavy vehicles and speed limits obtained from the national road data registration system (Statens vegvesen 2022). It should be noted that the uncertainty in the modelled noise levels increases with greater distance from roads and at lower sound thresholds. Accordingly, estimates within the lowest noise intervals are associated with relatively high uncertainty in noise propagation.
Noise measurements in situ at a Ramsar protected area
We measured road noise at c. 195 m south of the boundary of the Åkersvika Nature Reserve and next to the E6 motorway. Measurements were conducted just outside the reserve boundaries to comply with protection regulations. Although the main focus of attention was the noise pollution from the E6 highway, we recognize that the nature reserve is also exposed to acoustic disturbances from regional roads (Fv. 222, Rv. 25), the Dovrebanen and Rørosbanen railway lines, as well as nearby industrial activity. The sound levels were recorded at distances of 10, 30 and 60 m from the roadway using microphones positioned 4.0 m above ground level (Appendix S1 Text S1). Detailed specifications for recording equipment are provided in Appendix S1 Table S2. All measurements were conducted over grassy terrain adjacent to a gravel path, representing acoustically absorptive ground conditions. The direction of the wind was away from the microphones during rush hour (Appendix S1 Table S3), as the wind would especially affect the readings (i.e., underestimating sound levels) at 30 and 60 m. Each point was monitored for a minimum of 30 min to ensure adequate sampling of heavy vehicle passes (Appendix S1 Fig. S4), with c. 40–60 heavy vehicle passes occurring during the morning, daytime and evening periods and not fewer than 15 heavy vehicle passes occurring during the night.
Data analysis
We ran all data analyses in R version 4.4.3 (R Core Team 2013) and the package sf (Pebesma & Bivand Reference Pebesma and Bivand2023) for handling spatial vector data (i.e., map layers) of noise zones and protected areas. To identify protected areas exposed to noise and the extent of noise within protected areas, we first merged available noise source layers – major roads, roads in cities, major airports and railways – modelled down to a minimum threshold of 50 dB using the ‘st_union()’ function, generating a single composite noise layer. We then calculated the spatial overlap between all sources of noise combined and protected area boundaries using the ‘st_intersection()’ function, and we calculated the total area of the intersection with the function ‘st_area()’. To assess the individual contribution of each noise source, we repeated the intersection analysis grouping by type of noise source with the package dplyr. We ran the same analysis for Lden and Lnight noise level maps; however, Lnight data for railways were not available and thus not included in the analysis.
To assess how the proportion of area exposed to noise above 50 dB was related to the size of the protected areas (Appendix S1 Table S4), we fitted a beta regression model with the proportion exposed to noise (interval 0–1) as the response variable and the size (km2) and type of protected area as explanatory variables.
For the subset of 17 protected areas (Table 1) and road noise zones modelled down to 40 dB provided by the Norwegian Public Roads Administration, we used the same intersection methodology as above to quantify the difference in area exposed between 40- and 50-dB noise thresholds. To assess whether the areas exposed to noise using layers modelled to levels down to 50 and 40 dB were different, we ran a Wilcoxon signed-rank test.
To determine whether peak noise events deviated significantly from the average acoustic environment in Åkersvika, we conducted one-sample t-tests. These tests compared the five highest recorded noise peaks with the mean noise levels observed across four timeframes – morning, afternoon, evening and night – and at 10-, 30- and 60-m distances from the road.
To visualize the area exposed to noise in the selected protected areas, we used package ggplot2 (Wickham & Sievert Reference Wickham and Sievert2009).
Results
Transportation noise in protected areas: national level, 50-dB threshold
A comparison of noise pollution from road traffic, railways and airports revealed that road traffic caused the most extensive spatial impact within protected areas in Norway based on noise zones modelled for Lden using a 50-dB threshold (Appendix S1 Fig. S2). Of the 54 258 km2 of protected areas analysed, the area exposed to the combined noise from all sources Lden/Lnight was 57 km2/13 km2 (Appendix S1 Fig. S2).
Of 2484 terrestrial protected areas analysed, we found that 176 (7.1%) and 126 (5.1%) areas were exposed to Lden and Lnight road noise, respectively. A total of 229 (9.2%) protected areas were exposed to transportation noise (i.e., the combined noise Lden from roads, railways and/or major airports), whereas 128 (5.2%) protected areas were exposed to noise from roads and/or major airports at night (Appendix S1 Table S4).
Among nature reserves – the category of protected areas with the strictest conservation regulations – 102 (5.0%) and 138 (14.4%) of the areas were exposed to Lden road noise and transportation noise, respectively. For Lnight noise, the corresponding numbers were 71 (2.6%) for road noise and 72 (2.9%) for roads and major airports.
We found a significant inverse relationship between the size of both landscape protection areas and nature reserves and the proportion of their land exposed to transportation noise above 50 dB (beta regression: βlnArea = –0.37, standard error (SE) = 0.06, p < 0.001; Fig. 1). More than 68% of the 138 noise-exposed nature reserves were smaller than 1 km2 (Appendix S1 Table S4). On average, 35% of a 1‑km2 noise-exposed reserve was exposed to noise above 50 dB, but the spatial extent of disturbance varied considerably between reserves (Fig. 1).
Relationship between protected area size and exposure to transportation noise. The y-axis shows the percentage of each protected area exposed to transportation noise ≥50 dB Lden and the x-axis shows the total protected area size expressed as the natural logarithm of square kilometres (ln km2). Results are presented separately for two protection categories: landscape protection areas (blue dots) and nature reserves (orange dots). Each point represents an individual protected area. The solid line and shaded ribbon denote the estimated mean slope and associated confidence intervals derived from a beta regression model, respectively.

Spatial extent of road noise: 40-dB threshold
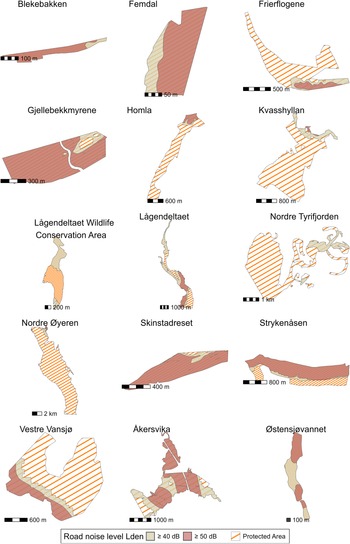
When using a threshold of 40 dB in noise pollution models, we found that the extent of traffic noise inside 15 protected areas (14 nature reserves and one wildlife conservation area) was significantly greater (Wilcoxon signed-rank test: V = 91, p < 0.001) than the area exposed when using a threshold of 50 dB for Lden and Lnight noise levels (Fig. 2, Table 1 & Appendix S1 Fig. S3). On average, the percentage of area exposed to Lden noise increased from 39.6% to 56.6% when using noise levels down from 50 to 40 dB, respectively (Table 1), whereas the percentage of area exposed during the night (Lnight) increased to an even greater extent, from 18.6% to 45.0%.
Visualization of the spatial extent of road noise during day–evening–night (Lden) with noise thresholds down to 50 and 40 dB in 15 nature reserves and wildlife conservation areas in Norway. Orange hatching delineates each protected area; red shading indicates areas exposed to ≥50 dB Lden and beige shading indicates areas exposed to ≥40 dB Lden. Protected area names are given in figure headings. The location of each protected area is shown in Appendix Fig. S1.

The two national parks included in Table 1 – both of which have main traffic routes between important regional centres in Norway running directly through them – were not exposed to Lden road noise down to 50 dB. At a lowered threshold of 40 dB, only 0.1 km2 of Dovrefjell-Sunndalsfjella National Park was exposed to road noise, while Hardangervidda National Park remained unaffected (Table 1).
Field validation of sound levels in a key nature reserve
We found that the difference between average and peak noise levels regularly exceeded 10 dB during daylight hours (one-sample t-test for morning, afternoon, evening and night; results in Fig. 3 & Appendix S1 Table S5) and was up to 20 dB during the night. Peak noise events (Lp,AF,max; see Appendix S1 Box S1a) in some cases reached 85–90 dB at 10 and 30 m from the road (Fig. 3).
Measured sound levels at Åkersvika Nature Reserve at 10-, 30- and 60-m distances from the E6 motorway and at 4 m above the ground. All values are given in dB A (A-weighted decibels), referenced to 20 μPa. Lp,A,T (black circles) denotes the equivalent A-weighted sound pressure level averaged over the entire measurement period (see Appendix S1 Box S1a). Lp,AF,max represents the A-weighted maximum sound pressure level of the five loudest events for each measurement period (red triangles). The small map in the top right corner shows the outline of the nature reserve and the E6, which runs through the protected area. The black dot just outside the southern boundary of the reserve indicates the location where all the field measurements of noise were conducted.

Our field measurements confirmed that the area is subject to high average levels (Lp,A,T; Appendix S1 Box S1a) of traffic noise from the E6 motorway, particularly during the morning, daytime and evening hours. During these periods, noise levels at 60 m from the road rarely dropped below 50 dB, and traffic noise was almost continuously audible to humans, from nearby or more distant sources (Appendix S1 Fig. S4). At night, traffic volume decreased (Fig. 3 & Appendix S1 Fig. S4). However, individual passing vehicles intermittently disrupted the nighttime acoustic environment, with sound levels reaching ≥80 dB at 10 m and ≥70 dB at 30 m from the road several times throughout the night (Appendix S1 Fig. S4 & Table S5).
Discussion
Although Norway has the second highest proportion of quiet areas in open country (Blanes et al. Reference Blanes, Fons, Ubacg, Milego and Peris2024) and the second lowest human population density in Europe – 15 people per square kilometre compared to the EU average of 109 (Eurostat 2025) – our findings indicate that the extent of transportation noise even in protected areas is non-negligible. We found that 9% of all protected areas and 14% of nature reserves (IUCN category Ia) are exposed to transportation noise at levels considered harmful to human health. When using updated maps modelled with a 40-dB threshold in place of the conventional 50 dB, this resulted in a substantial increase in the proportion of land area exposed to transportation noise, rising from an average of 40% to 57% (Lden) and from 19% to 45% (Lnight). In situ noise measurements near a key reserve revealed that peak noise events occurred frequently and far exceeded average levels, including at night.
Potential impacts on wildlife in protected areas exposed to noise
Although the spatial extent of transportation noise in Norwegian protected areas is lower than in the Natura 2000 sites of EU countries (European Environment Agency 2025), our findings raise concerns regarding the potential impacts on wildlife inhabiting protected areas. Most field studies and experiments have investigated the impacts of anthropogenic noise of 50 dB or higher, but an increasing body of evidence demonstrates that even moderate (c. 40–50 dB) or low‑level noise (c. 40 dB) can cause negative responses in wild animals (Shannon et al. Reference Shannon, McKenna, Angeloni, Crooks, Fristrup and Brown2016, Engel et al. Reference Engel, Young, Davies, Waddington and Wood2024). For example, playback experiments have shown that songbirds exposed to c. 40 dB of anthropogenic noise exhibit impaired acoustic discrimination (Montenegro et al. Reference Montenegro, Service, Scully, Mischler, Sahu and Benowicz2021). Senzaki et al. (Reference Senzaki, Yamaura, Francis and Nakamura2016) found that owls’ ability to detect prey was reduced even at the lowest level of playback traffic noise (40 dB). Field experiments on free-ranging mammal species further demonstrate heightened vigilance and avoidance responses to human-generated recreational noise under realistic exposures to low-to-moderate noise (Zeller et al. Reference Zeller, Ditmer, Squires, Rice, Wilder and DeLong2024). Patón et al. (Reference Patón, Romero, Cuenca and Escudero2012) investigated noise impacts on 91 bird species across 27 parks, covering a gradient from quiet rural sites below 40 dB to large urban parks exceeding 70 dB. They found that several species occurred only where noise levels were well below 50 dB, whereas others were rarely detected in parks where noise exceeded this threshold. Lehnardt et al. (Reference Lehnardt, Barber and Berger-Tal2024) found that songbird abundance declined in response to broadcast wind turbine noise, with the strongest decreases occurring near the speaker, but with there also being reductions farther away at lower noise levels. Collectively, these studies indicate that impacts can occur at sound levels near 40 dB, well below the thresholds traditionally considered harmful in environmental management.
Such low‑level impacts are especially important in the context of protected areas, many of which are small or elongated (e.g., Fig. 2) and thus have high perimeter‑to‑area ratios that make their interiors vulnerable to edge‑related environmental stressors (Schauman et al. Reference Schauman, Peñuelas, Jobbágy and Baldi2024). Additionally, many protected areas – both in Norway and globally – are surrounded by an unprotected matrix of unsuitable habitat or intense human activity (Schauman et al. Reference Schauman, Peñuelas, Jobbágy and Baldi2024). This limits the ability of animals to move away from noise sources, reducing their opportunities to avoid disturbance by simply shifting their position within the landscape. Although nature reserves are generally much smaller than national parks (Dudley Reference Dudley2008), they often hold substantial conservation value, especially wetland and forest reserves, which provide critical habitats for diverse and endangered wildlife. Protected areas can also provide ecosystem services by reducing noise pollution for humans (Rice et al. Reference Rice, Newman, Miller and Taff2020). However, we argue that protected areas should not be burdened with mitigating the effects of environmental noise.
For national parks – which are typically located farther from densely populated areas – our results indicate that exposure to major road noise was generally low, consistent with findings from European parks reported by Blanes et al. (Reference Blanes, Fons, Ubacg, Milego and Peris2024). However, even though the area exposed to noise is small, noise along linear features such as roads and railways can impair the connectivity of wildlife habitats (Collins et al. Reference Collins, Vickers and Shilling2022). Additionally, regional roads probably contribute to the extent of noise-exposed areas within national parks, but such roads are often not accounted for in existing noise maps. Moreover, in addition to transportation noise, a range of other noise sources may also impact wildlife in natural areas. These include gunshots, tractor noise, chainsaws, military training activities, construction work or fireworks (Engel et al. Reference Engel, Young, Davies, Waddington and Wood2024). Such intermittent and unpredictable noise is often perceived by wildlife as a potential danger (Francis & Barber Reference Francis and Barber2013). Future work could include simultaneous audio recordings of anthropogenic sound sources and measurements of wildlife responses within protected areas, allowing more nuanced evaluations of how different noise types affect wildlife (Barber et al. Reference Barber, Crooks and Fristrup2010).
Improved maps of areas exposed to road noise
When applying the modelled noise exposure zones down to 40 dB, we found that the percentage of area exposed to road noise increased, particularly during night. Our findings suggest that current noise mapping practices – particularly the 55-dB threshold adopted by Norwegian and European regulatory authorities – probably underestimate the true spatial extent of noise levels known to affect wildlife.
Many of the sounds that humans make overlap with the sounds of animals (Pijanowski et al. Reference Pijanowski, Villanueva-Rivera, Dumyahn, Farina, Krause and Napoletano2011). Noise levels considered harmful are species-dependent (Kunc & Schmidt Reference Kunc and Schmidt2021), and assessments of their potential impact on wildlife should therefore reflect species-specific hearing sensitivities (Pater et al. Reference Pater, Grubb and Delaney2009, Francis & Barber Reference Francis and Barber2013). Young, healthy humans can perceive sounds with frequencies between 20 and 20 000 Hz (Yost & Schlauch Reference Yost and Schlauch2001). Many animal species can hear and create sound frequencies below (infrasound) and above (ultrasound) the human hearing range (Pijanowski et al. Reference Pijanowski, Villanueva-Rivera, Dumyahn, Farina, Krause and Napoletano2011, Shannon et al. Reference Shannon, McKenna, Angeloni, Crooks, Fristrup and Brown2016). To understand and prevent negative effects on animals that rely on sounds outside the human hearing range, the frequency content (Hz) needs to be measured and mapped in a better way, even over an extended frequency range, in addition to the sound level (dB).
Noise in the Åkersvika Nature Reserve Ramsar site
When using the 40-dB threshold, the noise model indicated that nearly the entire Åkersvika Nature Reserve is exposed to such transportation noise, both during the day and during the night (Table 1). Our in situ noise measurements confirmed that the reserve is subject to a high average acoustic load even during biologically sensitive periods such as dusk and night, when many species are most active or vulnerable (Bennie et al. Reference Bennie, Duffy, Inger and Gaston2014, Catchpole & Slater Reference Catchpole and Slater2018). In addition to the high average levels of noise, peak noise levels occur frequently, reaching up to 90 dB. Sudden peaks in noise can trigger acute stress responses or flight behaviour in wildlife, potentially leading to increased energy expenditure, disruption of foraging or abandonment of critical habitats (Francis & Barber Reference Francis and Barber2013, Collins et al. Reference Collins, Vickers and Shilling2022).
Animals differ widely in their capacity to habituate to anthropogenic noise, with habituation being more probable when noise is low in intensity and predictable. At moderate levels (c. 40–50 dB), some species show partial habituation, although many still adjust their behaviour (e.g., altering vocal amplitude or timing), indicating that habituation is seldom complete (Francis & Barber Reference Francis and Barber2013, Shannon et al. Reference Shannon, McKenna, Angeloni, Crooks, Fristrup and Brown2016). Higher noise levels often lead to persistent avoidance, elevated stress or reduced foraging efficiency, suggesting limited potential for habituation (Kight & Swaddle Reference Kight and Swaddle2011). Continuous noise, such as that from road traffic, is more readily tolerated than intermittent or unpredictable noise (Francis & Barber Reference Francis and Barber2013). Acoustically dependent species such as songbirds often show reduced habituation compared with mammals, reflecting broader differences in behavioural plasticity (Barber et al. Reference Barber, Crooks and Fristrup2010).
Potential nighttime noise impacts on wildlife
Based on both noise models and direct field measurements, our findings show that transportation noise persists throughout the night, even when traffic volumes decline. This persistent acoustic disturbance challenges the assumption that nighttime provides a refuge for wildlife (Gaynor et al. Reference Gaynor, Hojnowski, Carter and Brashares2018) and underscores the need to reconsider current noise management strategies in protected or ecologically sensitive areas. Night-active species, including owls, bats and a range of other mammals, rely on acoustic cues for navigation, foraging and communication. Moreover, species that attempt to avoid daytime human activity by shifting their activity to nighttime may not find temporal refuge from noise pollution. There is growing evidence that the presence of humans, often accompanied by noise, alters the diel activity of wild animals. For example, vehicle presence has been linked to increased nocturnality in mammals within protected areas, probably as a response to human disturbance (Ouboter et al. Reference Ouboter, Kadosoe and Ouboter2021).
Implications for future noise mapping and mitigation
Extending noise mapping to include levels down to 40 dB and accounting for minor roads and areas with traffic exceeding 500 vehicles per day would more accurately represent transportation noise in natural habitats. Assessments of environmental and ecological impacts should consider both sound pressure levels (in decibels) and frequency (in hertz), relative to natural acoustic baselines (Pijanowski et al. Reference Pijanowski, Villanueva-Rivera, Dumyahn, Farina, Krause and Napoletano2011, Shannon et al. Reference Shannon, McKenna, Angeloni, Crooks, Fristrup and Brown2016). Temporal variation across diel and seasonal cycles should be incorporated, including explicit measurement of peak noise events that may disrupt wildlife despite low daily averages (Francis & Barber Reference Francis and Barber2013). Effective conservation requires limiting noise intrusion into protected areas, particularly those with high perimeter‑to‑area ratios (Schauman et al. Reference Schauman, Peñuelas, Jobbágy and Baldi2024), and mitigation should include assessing the surrounding landscape matrix and establishing appropriate buffer zones.
Mapping spatial patterns in noise pollution provides a basis for prioritizing mitigation efforts in affected protected areas. Effective strategies include planting native trees, installing sound barriers and reducing traffic speed (Shannon et al. Reference Shannon, McKenna, Angeloni, Crooks, Fristrup and Brown2016, Silva et al. Reference Silva, Lopes, Silva, Reis, Fonseca, Baptista, Melo, Carneiro, Castelo Branco, Costa and Duarte2025). Unlike chemical pollutants, noise can be mitigated with immediate effect through traffic regulation.
Current noise legislation in Norway and the EU (Appendix S1 Box S1b) primarily targets human health, with little attention given to the impacts on terrestrial ecosystems and wildlife. We recommend that future revisions of the EU Environmental Noise Directive (European Parliament and Council of the European Union 2002) – as well as related guidance documents issued by the European Environment Agency and national environmental authorities – incorporate lower-decibel thresholds to better guide planning and conservation efforts that safeguard biodiversity. While habitat pressures are recognized in Norway’s Nature Diversity Act and the EU Birds and Habitats Directives (Council Directive 92/43/EEC 1992, Directive 2009/147/EC 2009, Nature Diversity Act 2009), noise is not explicitly addressed. Strengthening these laws to include noise would enhance wildlife conservation.
Supplementary material
To view supplementary material for this article, please visit https://doi.org/10.1017/S0376892926100459.
Data statement
Modelled noise maps down to 40 dB, and measured noise data and managed data are available at Zenodo: https://doi.org/10.5281/zenodo.19916149. We used publicly available data that can be found in the reference list.
Acknowledgements
We acknowledge Regine Benz, Torunn Moltumyr and Erica Neby from the Norwegian Public Roads Administration for their constructive feedback on a previous draft of the manuscript and for providing the noise zones modelled down to 40 dB for the subset of protected areas used in this manuscript.
Author contributions
KE and AFV-V contributed equally to this work and share first authorship. KE: conceptualization, writing – original draft preparation, funding acquisition. AFV-V: formal analysis, visualization, writing – original draft preparation. AGH: conceptualization, writing – review and editing. VS: investigation, writing – review and editing.
Financial support
This study was partly funded by the Norwegian Public Roads Administration (D 11780 FoUI, Planlegging i støyutsatte områder, Underprosjekt: Støy i naturen).
Competing interests
The authors declare that they have no known competing financial interests or personal relationships that could have influenced the work reported in this paper.
Ethical standards
Not applicable.