1. Introduction
The labor share is the fraction of national income accruing to workers as remuneration for labor services. Its evolution has long attracted attention in economics, particularly for its role in describing the functional distribution of income (Atkinson, Reference Atkinson2009). In recent decades, the apparent decline in the labor share has renewed interest in its determinants (Karabarbounis and Neiman, Reference Karabarbounis and Neiman2013; Oberfield and Grossman, Reference Oberfield and Grossman2022). This debate has emphasized several structural explanations, including rising firm markups, declining worker bargaining power, investment-specific technological change, and automation (Bergholt et al., Reference Bergholt, Furlanetto and Maffei-Faccioli2022). While this secular decline is particularly clear in the United States, the evidence is less uniform across Euro Area economies. Our focus is different: rather than explaining low-frequency movements in the labor share, we study its conditional dynamic response to a monetary policy shock.
To this end, we estimate the dynamic effects of European Central Bank (ECB) monetary policy shocks on the labor share in the Euro Area by combining panel local projections (Jordà, Reference Jordà2005, Reference Jordà2023) with the Double/Debiased Machine Learning (DML) estimator (Chernozhukov et al., Reference Chernozhukov, Chetverikov, Demirer, Duflo, Hansen, Newey and Robins2018, Reference Chernozhukov, Hansen, Kallus, Spindler and Syrgkanis2024). The proposed LP-DML framework recovers policy innovations as the component of the short-term interest rate that is not predictable from a high-dimensional set of contemporaneous and lagged macroeconomic, financial, and expectation-related controls. We then trace the response of the labor share and of its main components—real output, prices, real wages, labor productivity, employment, investment, the relative price of investment, and the profit share of non-financial corporations—to characterize the transmission of monetary policy through the functional distribution of income.
This exercise is motivated by a puzzle for standard monetary models. In many New Keynesian frameworks, a contractionary monetary policy shock should reduce the labor share, or equivalently raise markups. Yet the empirical evidence in Cantore et al. (Reference Cantore, Ferroni and León-Ledesma2021) shows the opposite pattern: monetary tightening increases the labor share while real wages fall or remain broadly unchanged, implying that labor productivity falls more than real wages. Our paper asks whether the same conditional pattern emerges for the Euro Area when monetary policy innovations are recovered through a high-dimensional regression-control strategy.
We find that the labor share responds countercyclically to monetary policy. Following a contractionary monetary policy shock, the labor share increases persistently. The response reflects a broad contractionary transmission mechanism: output, labor productivity, employment, investment, and prices decline, while average real wages adjust less persistently. Hence, the labor share rises because productivity and aggregate activity contract more than average real wages. This pattern is obtained without price or production puzzles: a rise in the short-term interest rate is followed by lower real activity and a gradual decline in prices, consistent with standard monetary transmission.
The transmission evidence is closely related to Cantore et al. (Reference Cantore, Ferroni and León-Ledesma2021). Using Structural Vector Autoregression (SVAR) methods for several advanced economies, they show that monetary policy tightening raises the labor share while real wages fall or remain broadly unchanged. Since the labor share is the ratio between real wages and labor productivity, this implies that labor productivity falls more than real wages. Our evidence shows that the same empirical regularity arises in the Euro Area under a different identification strategy. At the same time, the additional responses of investment, the relative price of investment, and the profit share clarify the nature of the mechanism. The labor-share increase is embedded in a broader contraction in real activity and capital accumulation, rather than in a simple redistribution from profits to wages.
The LP-DML approach is designed for causal inference in settings with high-dimensional controls. In our application, the ECB short-term interest rate is the policy variable, while the conditioning set includes a large set of contemporaneous and lagged macroeconomic, financial, and expectation-related controls. This strategy partials out the component of the policy rate that is predictable from observed macro-financial conditions, thereby recovering policy innovations conditional on the available information set. By combining Neyman orthogonality and cross-fitting, DML mitigates regularization and overfitting biases that would otherwise affect inference when flexible or high-dimensional nuisance functions are used.
Our contribution is twofold. First, we provide new empirical evidence on the conditional cyclicality of the labor share in response to monetary policy shocks for the Euro Area. Second, we propose DML as an empirical identification strategy for monetary policy in a dynamic panel local-projection setting. Unlike benchmark approaches that rely on high-frequency external instruments to address the co-movement between interest rates and financial surprises (Altavilla et al., Reference Altavilla, Brugnolini, Gürkaynak, Motto and Ragusa2019; Jarocinski and Karadi, Reference Jarocinski and Karadi2020), our approach implements a high-dimensional regression-control method to deconfound the policy rate. While DML has been primarily applied in microeconomics, its use in macroeconomic identification remains limited; to the best of our knowledge, this paper is among the first applications of DML to monetary policy identification within a panel local-projections framework.
We show that the results are robust along several dimensions. First, the DML-based impulse responses are qualitatively and quantitatively close to those obtained using the high-frequency monetary policy instruments of Jarocinski and Karadi (Reference Jarocinski and Karadi2020) for the Euro Area and to the SVAR-based results in Cantore et al. (Reference Cantore, Ferroni and León-Ledesma2021). Second, the results are robust to changes in the sample period, including a specification that excludes the COVID period. Third, they are robust to the use of alternative machine learners to approximate the nuisance functions. Fourth, allowing responses to vary with the sign of the policy innovation (Barnichon et al., Reference Barnichon, Matthes and Sablik2017; Angrist et al., Reference Angrist, Jord‘a and Kuersteiner2018; Debortoli et al., Reference Debortoli, Forni, Gambetti and Sala2020; Caravello and Martinez-Bruera, Reference Caravello and Martinez-Bruera2024) confirms that tightening policies are more effective than easing actions. Fifth, to assess whether the pooled panel masks relevant cross-country heterogeneity (Kaplan et al., Reference Kaplan, Moll and Violante2018), we split the sample according to countries’ average labor-share levels. The estimates become noisier and do not indicate significant quantitative differences across groups, possibly because country-specific controls absorb the relevant heterogeneity. Overall, these robustness exercises indicate that the countercyclical labor-share response is not driven by the specific identification strategy, a particular sample period, the choice of machine learner, the linearity restriction, or the composition of member states.
Our analysis contributes to two strands of literature. First, it contributes to the empirical literature on monetary policy and the functional distribution of income. Cantore et al. (Reference Cantore, Ferroni and León-Ledesma2021) provide the first systematic evidence that monetary policy tightening raises the labor share across several advanced economies. Related work has focused primarily on markups and marginal costs (Nekarda and Ramey, Reference Nekarda and Ramey2020; Bilbiie and Känzig, Reference Bilbiie and Känzig2023), often highlighting tensions between empirical evidence and New Keynesian model predictions.Footnote 1 By focusing directly on the labor share and its components, we provide new evidence on the conditional cyclicality of factor income shares in the Euro Area. Relatedly, Bergholt et al. (Reference Bergholt, Furlanetto and Maffei-Faccioli2022) study the long-run decline of the U.S. labor share and quantify the roles of automation, firm markups, worker markups, and investment-specific technology using theory-based sign restrictions. Our analysis is complementary: we focus on the short-run response of the labor share and its observable transmission channels to a monetary policy shock.
Second, the paper contributes to the methodological literature on causal machine learning and macroeconomic identification. Our approach builds on the partially linear regression (PLR) framework of Robinson (Reference Robinson1988), the high-dimensional control strategy of Belloni et al. (Reference Belloni, Chernozhukov and Hansen2013), and the DML estimator of Chernozhukov et al. (Reference Chernozhukov, Chetverikov, Demirer, Duflo, Hansen, Newey and Robins2018). Recent contributions have shown the usefulness of causal machine learning in observational settings where the researcher must condition on a large set of potential confounders (Baiardi and Naghi, Reference Baiardi and Naghi2024). Related applications have extended DML and high-dimensional methods to time-series and panel settings (Adamek et al., Reference Adamek, Smeekes and Wilms2024; Agostini et al., Reference Agostini, Bloise and Tancioni2024; Clarke and Polselli, Reference Clarke and Polselli2023; Klosin and Vilgalys, Reference Klosin and Vilgalys2023; Semenova et al., Reference Semenova, Goldman, Chernozhukov and Taddy2023). To the best of our knowledge, this paper is the first to use DML for monetary policy identification within a panel local-projections framework.
The paper is organized as follows. Section 2 discusses the measurement of the labor share. Section 3 describes the data. Section 4 presents the panel LP-DML methodology. Section 5 discusses the recovered monetary policy shock, the baseline impulse responses, and the transmission mechanisms. Section 6 presents the robustness analysis. Section 7 concludes.
2. Labor share measurement
The labor share measures the fraction of aggregate income accruing to labor. Although conceptually simple, its empirical measurement is not straightforward (Gollin, Reference Gollin2002). A common starting point is the unadjusted labor share, defined as the ratio between compensation of employees (
 $CE$
) and aggregate income (
 $Y$
):
 \begin{equation} LS=\frac {CE}{Y}. \end{equation}
This measure is easy to compute but incomplete, because both the numerator and the denominator involve nontrivial measurement choices.
The first set of choices concerns the denominator. In sectoral applications, aggregate income is often measured by gross value added (Bentolila and Saint-Paul, Reference Bentolila and Saint-Paul2003; Young, Reference Young2010), whereas studies of the aggregate labor share typically rely on gross domestic product (GDP) (Gollin, Reference Gollin2002; IMF, 2017). A related issue is whether income should be valued at factor cost, basic prices, or market prices, depending on how taxes and subsidies are treated. Another distinction concerns whether gross or net income is used, depending on whether depreciation is included. As discussed by Cho et al. (Reference Cho, Hwang and Schreyer2017), gross and net labor shares are complementary concepts: net measures are preferable when the focus is on income distribution after capital depreciation, while gross measures are more appropriate for production-oriented macroeconomic analyses. Since our objective is to study the transmission of monetary policy to aggregate income shares, we measure the denominator using GDP at market prices, in line with the aggregate macroeconomic perspective adopted in this paper.
The more important measurement issue concerns the numerator. Compensation of employees excludes the labor income of the self-employed. In the national accounts, the income of the self-employed is recorded as mixed income, because it combines returns to labor and returns to capital. Since these two components are not observed separately, using only compensation of employees tends to understate the labor share whenever part of mixed income is attributable to labor. The empirical literature therefore proposes several corrections to account for the labor component of self-employment income.
2.1. Labor share without mixed income
A first correction excludes mixed income from the denominator. This measure assumes that mixed income contains labor and capital income in the same proportions as the rest of the economy (Gollin, Reference Gollin2002; Muck et al., Reference Muck, McAdam and Growiec2018; Kónya et al., Reference Kónya, Krekó and Oblath2020):
 \begin{equation} LS_1=\frac {CE}{GDP-MI}, \end{equation}
where
 $MI$
denotes mixed income. While intuitive, this correction is sensitive to how mixed income is measured. As emphasized by ILO (2019), even within the System of National Accounts framework, countries may differ in how they record mixed income, creating comparability problems. Moreover, mixed income is particularly affected by data availability and concerns about misreporting.
2.2. Adjusted labor share
A second correction adjusts employee compensation by the ratio of total employment to the number of employees. This adjusted labor share assumes that, on average, the labor compensation of the self-employed is equal to that of employees:
 \begin{equation} LS_2=\frac {CE}{GDP}\frac {EMP}{EE}, \end{equation}
where
 $EMP$
denotes total employment and
 $EE$
the number of employees. This measure can be problematic when self-employed workers systematically earn different labor income from employees, and, in some cases, it may generate implausibly high labor shares. However, this concern is more severe in low-income economies, where self-employment accounts for a large share of total employment. For advanced economies, the adjusted labor share is widely used in empirical work (Gollin, Reference Gollin2002; IMF, 2017). It is also the approach adopted by the European Commission’s AMECO database, which reports the adjusted wage share using GDP at market prices.Footnote
2
2.3. Corporate labor share
A third approach focuses on the corporate labor share (Gomme and Rupert, Reference Gomme and Rupert2004; Karabarbounis and Neiman, Reference Karabarbounis and Neiman2013). Since the corporate sector excludes most self-employment income, this measure partly avoids the mixed-income imputation problem. However, it does not necessarily provide a comprehensive measure of the labor share for the whole economy.
In this paper, we follow the AMECO methodology and use the adjusted labor share in Equation (3). This choice is appropriate for our Euro Area sample of advanced economies, improves cross-country comparability, and corrects the main bias of the unadjusted labor share, namely the exclusion of the labor component of self-employed workers’ income.
3. Data
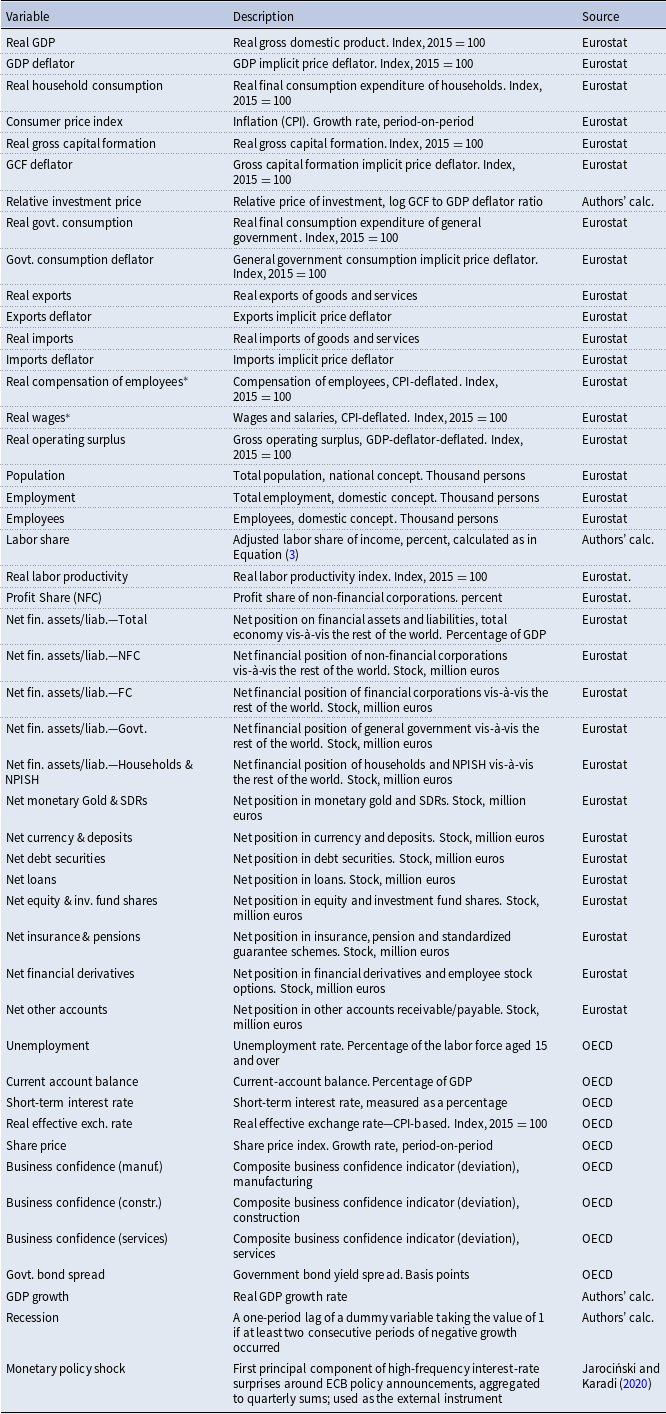
We use quarterly observations for 11 Euro Area countries over the period 1999Q1–2025Q4, thus including the pandemic period. The selected economies are Austria, Belgium, Finland, France, Germany, Greece, Ireland, Italy, the Netherlands, Portugal, and Spain. Among euro-area countries, we focus on the founding member states, excluding Luxembourg because of missing data, and include Greece, which joined the euro area in 2001. Detailed information on the complete set of series used in the analysis is reported in Table C1 of Appendix C.
The empirical strategy relies on a high-dimensional conditioning set designed to approximate the information available at the time of monetary policy decisions. The dataset includes 47 country-specific variables, which enter the control vector with contemporaneous values and/or lags depending on their timing assumptions, as discussed in Section 4. These variables cover several conceptual blocks. First, we include national-account aggregates describing real activity and expenditure composition, such as private and public consumption, investment, exports, and imports. Second, we include price variables that capture the price deflators associated with the main macroeconomic aggregates. Third, we include variables related to labor and capital remuneration, such as compensation of employees, wages and salaries, and profit-share measures. Fourth, we account for demographic and labor-market conditions using population, total employment, employees, and the unemployment rate. Fifth, we include productivity-related indicators, which are central to the decomposition of the labor share into real wages and labor productivity. Sixth, we use sectoral account variables, including net assets and liabilities by institutional sector and asset type, to capture financial positions and balance sheet conditions. Seventh, we include fast-moving financial and trading price variables, such as share price indices and exchange rates, which may react rapidly to monetary policy news. Finally, we include expectation-related variables, such as composite business tendency indicators and government bond yields, which proxy forward-looking information about future economic conditions and policy expectations.
This structure of the conditioning set is central to the identification strategy. The LP-DML framework recovers monetary policy innovations by partialling out the component of the short-term interest rate that is predictable from observed macroeconomic, financial, and expectation-related conditions. Hence, the credibility of the conditional unconfoundedness assumption depends on whether the conditioning set captures the main sources of systematic policy responses and macroeconomic anticipation. By combining variables that describe real activity, prices, income distribution, labor markets, financial conditions, balance-sheet positions, and expectations, this set is intended to absorb predictable policy-rate variation and to make the residualized policy signal plausibly orthogonal to observed confounders.
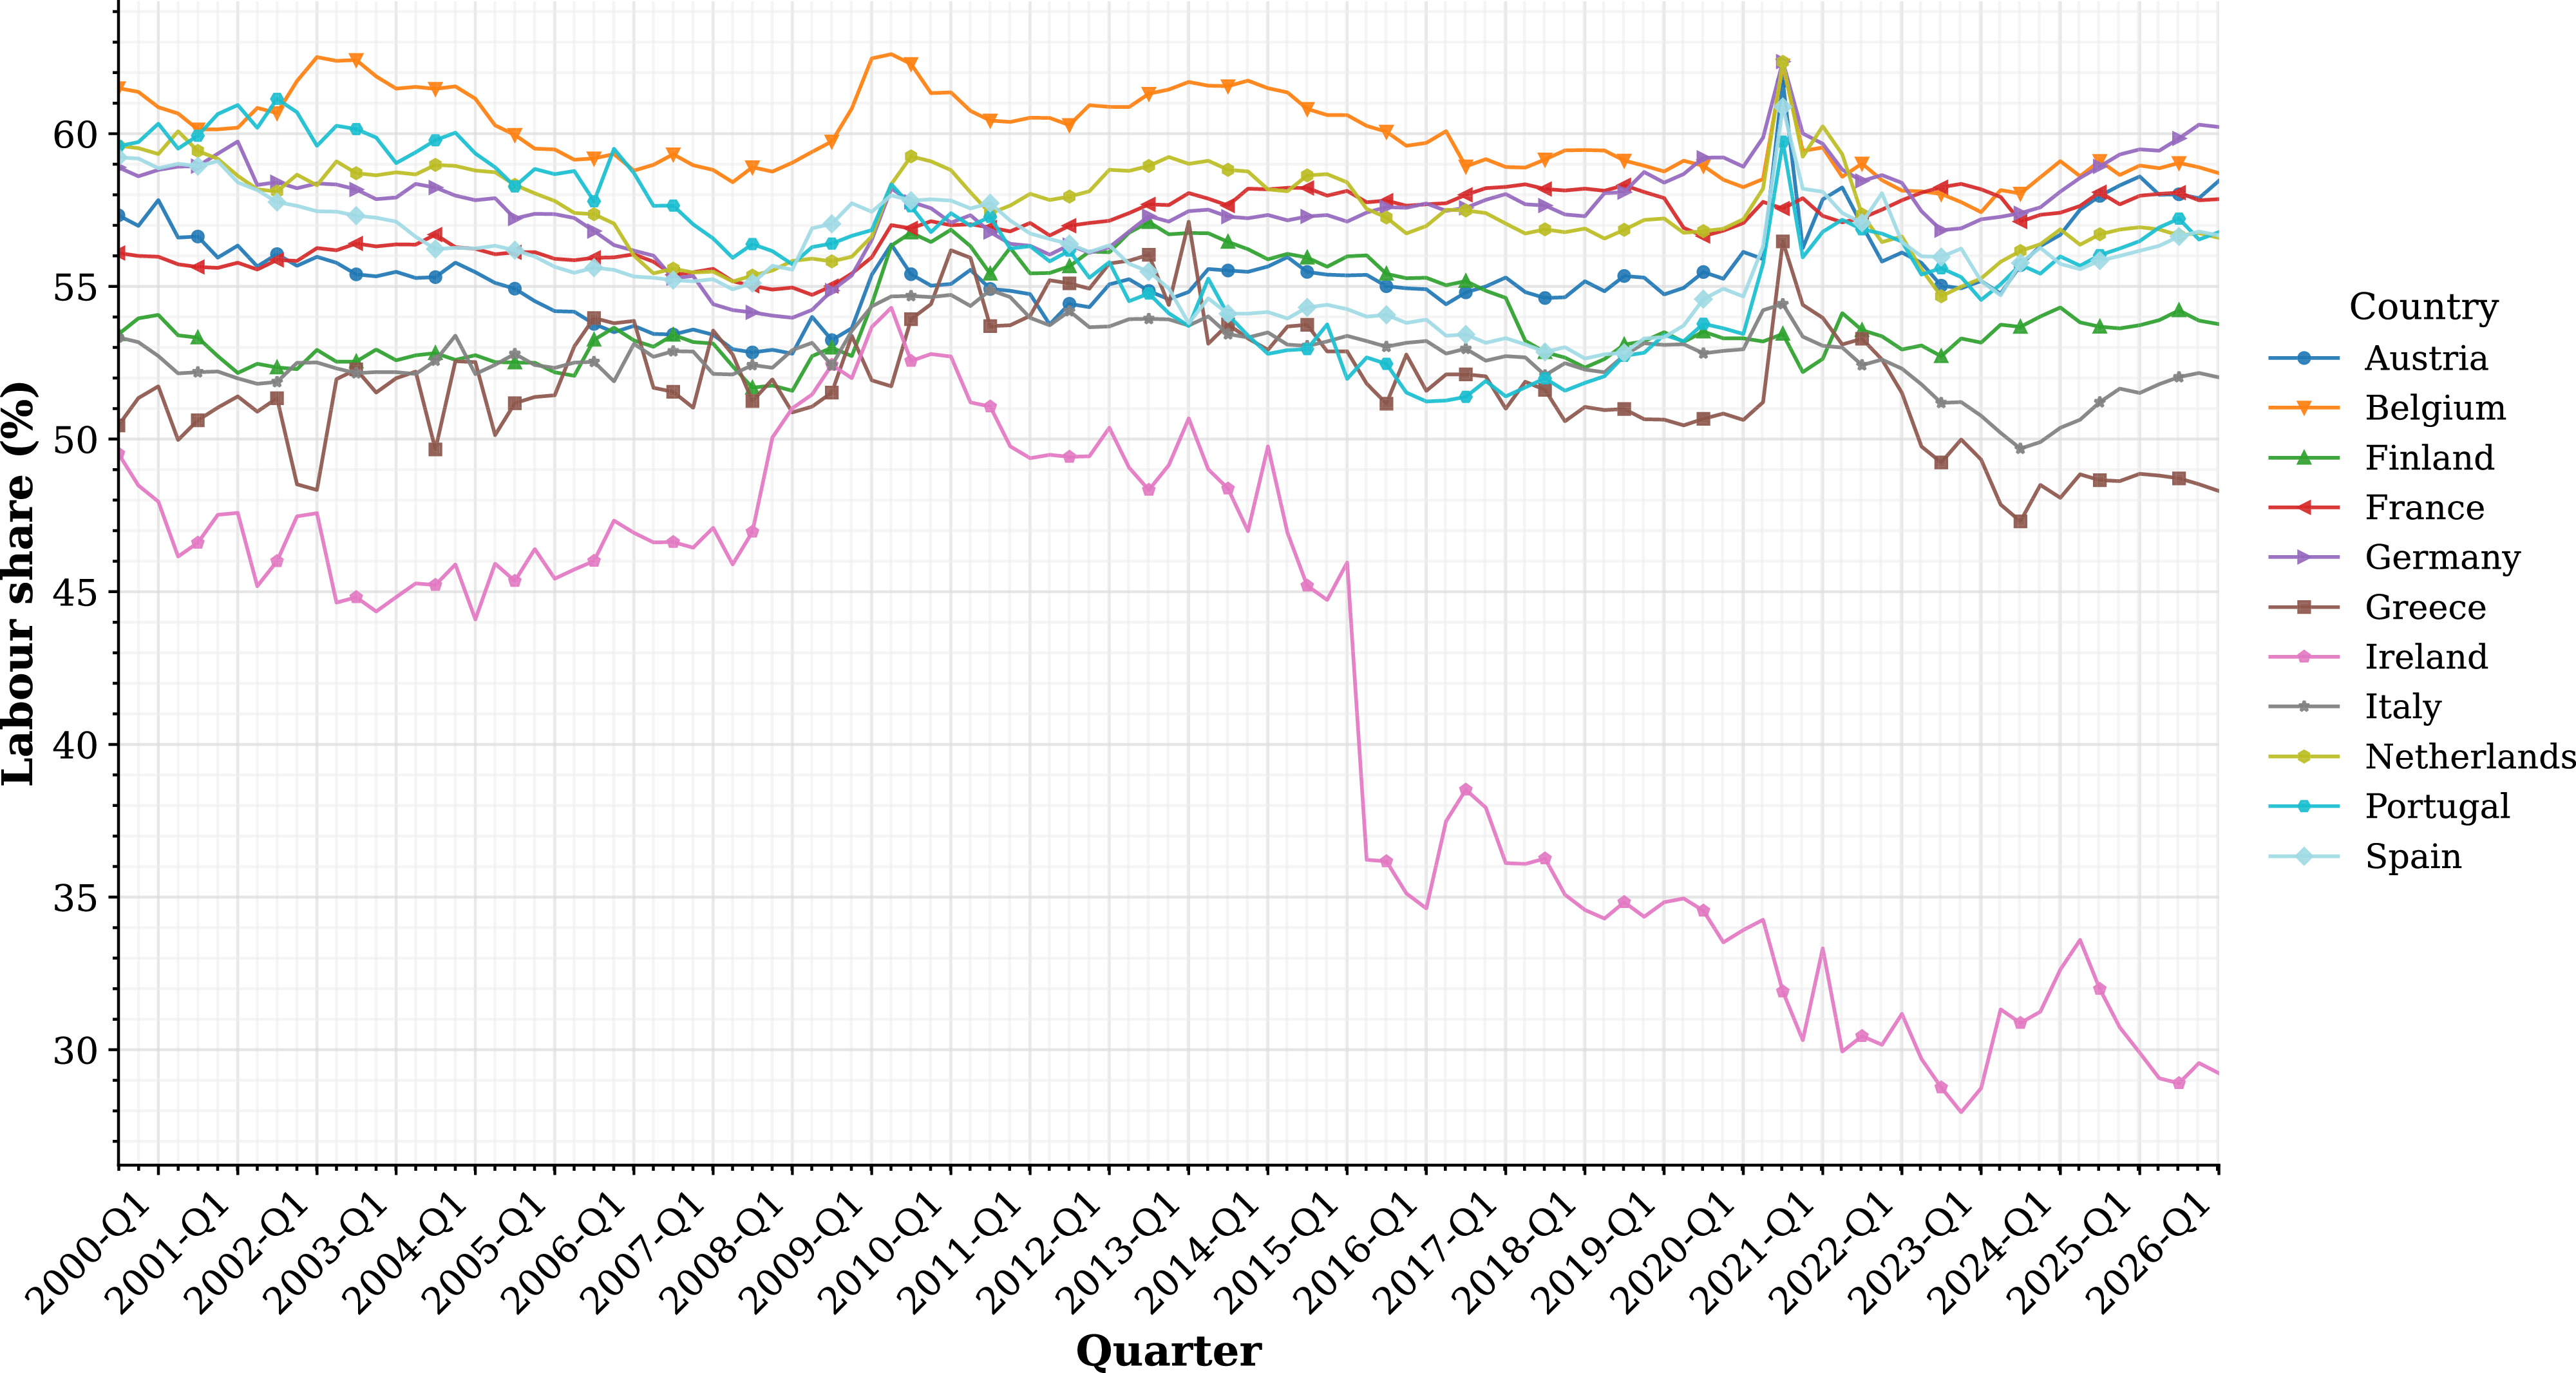
Figure 1 presents the evolution of the labor share across the Euro Area countries included in the analysis.Footnote 3
Labor share of income. Authors’ calculations based on the adjusted labor share approach. The labor share is computed as compensation per employee as a percentage of GDP per person employed, corrected for self-employment.

Figure 1. Long description
A line graph depicting the labor share percentages for different countries from the first quarter of 2000 to the first quarter of 2026. The horizontal axis represents the quarters, while the vertical axis shows the labor share in percent. The graph includes data lines for Austria, Belgium, Finland, France, Germany, Greece, Ireland, Italy, Netherlands, Portugal, and Spain. Each country’s labor share trend is represented by a distinct colored line. The labor share for most countries hovers around 50 to 60 percent, with some countries showing significant fluctuations over the years. Ireland’s labor share notably drops around 2015 and remains lower compared to other countries. The graph highlights the dynamic response of labor share to various economic factors over time.
We use the Euro short-term interest rate as the monetary policy variable. Since all countries in the sample belong to the same currency union, the policy variable is common across countries. At the same time, the conditioning variables are country-specific, so the residualized policy variable may initially reflect deviations of the common policy rate from local macroeconomic and financial conditions. Section 5 explains how we recover a common Euro Area monetary policy innovation by using a pooled learner for the policy nuisance function, in line with the stacking DML approach of Ahrens et al. (Reference Ahrens, Hansen, Shaffer and Wiemann2025).
4. Methodology
This section describes the empirical strategy used to estimate the dynamic effects of ECB monetary policy shocks on the labor share and its components. We proceed in three steps. First, we cast the panel local projections framework as a PLR model, in which the policy variable enters linearly while the dependence of both the outcome and the policy rate on a high-dimensional set of controls is absorbed by unknown nuisance functions. Second, we discuss the identification assumptions underlying the LP-DML design, emphasizing the role of the conditioning set in approximating the observed information available at the time of the policy decision. Third, we describe the DML estimator used to partial out nuisance components, reduce regularization and overfitting biases through Neyman orthogonality and cross-fitting, and recover the horizon-specific impulse responses. Implementation details are reported in Appendix D.
4.1 Model specification: the panel LP-PLR model
We estimate the dynamic effects of ECB monetary policy shocks on the labor share and its components by embedding panel local projections (Jordà, Reference Jordà2005, Reference Jordà2023) into a PLR framework (Robinson, Reference Robinson1988). This formulation is useful because the policy variable enters linearly, while the dependence of both the outcome and the policy variable on a large set of controls is absorbed by unknown nuisance functions. The resulting specification is well-suited to DML estimation, which allows us to partial out high-dimensional confounding before estimating the horizon-specific policy effects.
 \begin{equation} \begin{gathered} y_{i,t+h}= \theta _{h} d_{i,t}+l_{h}(x_{i,t})+ \epsilon _{i,t+h}, \hspace {1cm} E(\epsilon _{i,t+h}|d_{i,t},x_{i,t})=0 \end{gathered} \end{equation}
 \begin{equation} \begin{gathered} d_{i,t}=m_{0}(x_{i,t})+ \mu ^{d}_{i,t}, \hspace {1.8cm} E(\mu ^{d}_{i,t}|x_{i,t})=0, \end{gathered} \end{equation}
where Equation (4) models the process of interest and Equation (5) is an auxiliary equation that keeps track of the dependence of the policy variable on controls, i.e., of its endogeneity. In this dynamic PLR specification,
 $y_{i,t+h}$
is the outcome variable, i.e. the labor share, its components and the traced transmission channels observed in the country
 $i$
at time
 $t+h$
, with
 $h=0,\ldots ,8$
being the horizons (quarters) considered in the direct estimation of the impulse response functions;
 $d_{i,t}$
is ECB’s short-term interest rate (the continuous policy variable),
 $\theta _{h}$
denotes the structural parameter of interest (the dynamic policy effect);
 $x_{i,t}$
is a “high-dimensional” vector including the complete set of contemporaneous and lagged controls;Footnote
4
 $l_{h}$
and
 $m_{0}$
are the unknown nuisance functions mapping the outcome and policy variables’ relations with the controls, respectively;
 $\epsilon _{i,t}$
and
 $\mu _{i,t}$
are conditionally zero-mean structural and reduced-form errors, respectively.
4.2 High-dimensional conditioning and identification
Our interpretation of
 $\theta _h$
relies on a horizon-specific conditional exogeneity condition. For each projection horizon
 $h=0,\ldots ,H$
, causal interpretation requires
 \begin{equation*} E\left (\epsilon _{i,t+h}\mid d_{i,t},x_{i,t}\right )=0, \end{equation*}
which is the dynamic analog of conditional unconfoundedness in the local-projection setting. Since the outcome is dated at
 $t+h$
, the time-
 $t$
conditioning set must be rich enough to absorb the sources of confounding relevant to the outcome at that horizon. In the present application, this requirement is particularly important because monetary policy is forward-looking: policy-rate decisions may respond not only to current and lagged macroeconomic conditions, but also to policymakers’ and market participants’ expectations about future inflation, output, financial conditions, and the future path of policy itself.
The role of the high-dimensional control vector
 $x_{i,t}$
is therefore to approximate the observed information set available at the time of the policy decision. The partialling-out step can be interpreted as the construction of conditional forecast errors. The nuisance function
 $m_0(x_{i,t})$
captures the component of the policy rate that is predictable from the observed information set, while the residual
 $\mu ^d_{i,t}$
captures the remaining policy-rate innovation. Similarly, the outcome nuisance function absorbs the component of
 $y_{i,t+h}$
that is predictable from the same information set. By partialling out predictable variation associated with macroeconomic conditions, financial variables, and expectation-related observables, the DML procedure aims to recover variation in the short-term rate that is orthogonal to observed confounders.
At the same time, the dynamic conditional exogeneity condition remains an identifying assumption. The DML procedure does not, by itself, rule out contemporaneous simultaneity between the policy rate and the outcome, omitted structural shocks that are not absorbed by
 $x_{i,t}$
, or anticipatory responses driven by information that is not proxied by the observed controls. This limitation is especially relevant for forward guidance and expected future policy-rate paths. To mitigate this concern, our conditioning set includes expectation-related variables, such as sector-specific business confidence indicators and the government bond yield spread, as well as fast-moving financial variables. These variables can partly reflect expectations about future macroeconomic conditions and policy, although they need not fully span the information set used by the central bank or by private agents.Footnote
5
Hence, when conditional exogeneity holds,
 $\theta _h$
can be interpreted as the causal impulse response to an innovation in the short-term policy rate, conditional on the observed information set. Otherwise,
 $\theta _h$
should be interpreted more cautiously as a residualized projection coefficient whose structural content depends on the adequacy of the conditioning set and of the nuisance-function specification.
In this setting, endogeneity may arise from multiple factors correlated with both the short-term interest rate and the labor share (or transmission channel) outcome, including the ECB’s systematic response to observed macroeconomic and financial conditions. To strengthen the plausibility of the dynamic exogeneity condition, we include a broad set of controls in
 $x_{i,t}$
with up to eight lags to capture macroeconomic dynamics, policy transmission lags, and predictable variation in the policy rate. The specification also includes lagged values of both the outcome and the policy variable. Overall, the dynamic specification described by Equations (4) and (5) controls for 47 potential confounding variables. Considering the lags and the contemporaneous controls, the size of the control set increases to 191.
Following Bernanke et al. (Reference Bernanke, Boivin and Eliasz2005), Espinoza et al. (Reference Espinoza, Fornari and Lombardi2009), we distinguish between “slow-moving” and “fast-moving” variables according to their contemporaneous sensitivity to monetary policy news. Fast-moving variables, typically financial indicators, enter the model both contemporaneously and with lags because they react rapidly to economic news and may partly incorporate market expectations about the future path of policy and macroeconomic conditions. In our specification, share prices, the real effective exchange rate, and the government bond yield spread fall into this category. We also include sector-specific business confidence indicators, which provide observable proxies for agents’ expectations about future economic conditions. The remaining variables are treated as slow-moving because they are primarily real variables that are unlikely to react within the same quarter to monetary policy decisions; they therefore enter the control set only in lagged terms. This timing restriction parallels the recursive partial identification logic commonly used in SVARs through (block) Cholesky-type orderings (Christiano et al., Reference Christiano, Eichenbaum and Evans2005).
This broad conditioning set is intended to absorb predictable policy variation associated with observed macro-financial conditions and with the expectation components reflected in fast-moving financial variables, yield spreads, and business confidence indicators. Nevertheless, we do not claim that these controls fully capture all dimensions of policy expectations, such as forward guidance or the entire expected future path of short-term rates. The impulse responses should therefore be interpreted as conditional on the observed information set included in
 $x_{i,t}$
.
We account for country fixed effects through the demeaning technique (Greene, Reference Greene2012). This strategy involves subtracting the country-specific time average from each raw variable and then adding back the overall sample mean.Footnote
6
Although the analysis is conducted within a panel framework, we do not employ double-demeaning to account for time fixed effects, given the country-invariant nature of the policy shock.Footnote
7
We consider four lags in the control vector
 $x_{i,t}$
.
4.3 Double/Debiased Machine Learning
The PLR model (Robinson, Reference Robinson1988) depicted in Equations (4) and (5) is a set-up in which the nuisance functions
 $l_{h}$
and
 $m_{0}$
are allowed to be nonlinear—even though in our setting we rely on a Machine Learning (ML) linear estimator—whereas
 $d_{i,t}$
enters the model linearly and additively. The goal involves obtaining inference on the low-dimensional parameter of interest
 $\theta _{h}$
in the presence of high-dimensional nuisance parameters.
The central difficulty is that standard plug-in procedures are generally not valid in this setting. Although machine-learning methods are useful for estimating high-dimensional nuisance functions, they may introduce two sources of bias that contaminate inference on
 $\theta _h$
. The first is regularization bias. Regularized learners reduce variance by shrinking less relevant coefficients toward zero, but this shrinkage may introduce bias in the estimated nuisance functions and, consequently, in the parameter of interest (Belloni et al., Reference Belloni, Chernozhukov and Hansen2013). The second is overfitting bias. When the same observations are used both to estimate the nuisance functions and to recover the target parameter, nuisance-estimation errors may become spuriously correlated with the residuals, thereby distorting inference (Chernozhukov et al., Reference Chernozhukov, Chetverikov, Demirer, Duflo, Hansen, Newey and Robins2018). DML mitigates these problems through Neyman orthogonality and cross-fitting: the former makes the estimating moment locally insensitive to small nuisance-estimation errors, while the latter separates the data used to estimate nuisance functions from the data used to evaluate the orthogonal score (Chernozhukov et al., Reference Chernozhukov, Chetverikov, Demirer, Duflo, Hansen, Newey and Robins2018). Under the required identification, convergence rate, and regularity conditions, these adjustments deliver valid asymptotic inference for the low-dimensional parameter of interest
 $\theta _h$
, even when flexible or high-dimensional learners are used for the nuisance functions (Chernozhukov et al., Reference Chernozhukov, Chetverikov, Demirer, Duflo, Hansen, Newey and Robins2018).
DML therefore allows the relevant nuisance functions to be estimated using modern ML methods, such as Least Absolute Shrinkage and Selection Operator (Lasso), Classification and Regression Trees, Random Forests, and deep neural networks. These techniques are suitable for estimating unknown, possibly nonlinear, and high-dimensional nuisance functions because they can approximate complex relationships without imposing a fully specified parametric form. In our main application, we use the Lasso algorithm to induce sparsity in the nuisance functions.Footnote 8
We now describe the orthogonalization step in the present LP-PLR setting. Define the reduced-form outcome nuisance function as
 \begin{equation*} g_h(x_{i,t}) = E[y_{i,t+h}\mid x_{i,t}]. \end{equation*}
This object differs from the structural nuisance
 $l_h(x_{i,t})$
in Equation (4). Since
 $d_{i,t}=m_0(x_{i,t})+\mu ^d_{i,t}$
, the reduced-form outcome nuisance can be written as
 \begin{equation*} g_h(x_{i,t}) = l_h(x_{i,t})+\theta _h m_0(x_{i,t}). \end{equation*}
Thus, while
 $l_h(x_{i,t})$
captures the direct dependence of the outcome on the controls in the structural PLR equation,
 $g_h(x_{i,t})$
captures the full conditional expectation of the outcome given the controls, including the part operating through the predictable component of the policy variable.
The partialling-out implementation estimates
 $m_0(x_{i,t})=E[d_{i,t}\mid x_{i,t}]$
and
 $g_h(x_{i,t})=E[y_{i,t+h}\mid x_{i,t}]$
using machine-learning methods. It then constructs the residuals
 \begin{equation*} \hat {\mu }^{d}_{i,t}=d_{i,t}-\hat {m}_0(x_{i,t}), \qquad \hat {\mu }^{y}_{i,t+h}=y_{i,t+h}-\hat {g}_h(x_{i,t}). \end{equation*}
The horizon-specific policy effect is obtained from the residual-on-residual regression
 \begin{equation} \begin{gathered} \hat {\mu }^{y}_{i,t+h}=\theta _h \hat {\mu }^{d}_{i,t}+\epsilon _{i,t+h}, \qquad h=0,\ldots ,8. \end{gathered} \end{equation}
Equivalently, the estimator can be written as
 \begin{equation} \begin{gathered} \hat \theta _{h}= \left (\frac {1}{NT}\sum _{i,t}\hat {\mu }^{d}_{i,t}\hat {\mu }^{d}_{i,t}\right )^{-1} \frac {1}{NT}\sum _{i,t}\hat {\mu }^{d}_{i,t} \left (y_{i,t+h}-\hat {g}_h(x_{i,t})\right ). \end{gathered} \end{equation}
As in Agostini et al. (Reference Agostini, Bloise and Tancioni2024), this adapts the local projections procedure to the residual-on-residual partialling-out approach of Robinson (Reference Robinson1988), implemented in Chernozhukov et al. (Reference Chernozhukov, Kasahara and Schrimpf2021).
The corresponding orthogonal score is
 \begin{equation} \begin{gathered} \psi (W;\,\theta _h,\eta ) = \left [ y_{i,t+h}-g_h(x_{i,t}) -\theta _h\left (d_{i,t}-m_0(x_{i,t})\right ) \right ] \left (d_{i,t}-m_0(x_{i,t})\right ), \qquad \eta =(g_h,m_0), \end{gathered} \end{equation}
where
 $W=(y_{i,t+h},d_{i,t},x_{i,t})$
. At the true parameter values,
 $E[\psi (W;\,\theta _h,\eta )]=0$
. Moreover, the score satisfies the Neyman orthogonality condition, meaning that small errors in the estimation of the nuisance functions
 $\eta =(g_h,m_0)$
have only a second-order effect on the estimation of
 $\theta _h$
. This local insensitivity is what prevents first-stage regularization errors from contaminating inference on the horizon-specific policy effect.
Neyman orthogonality addresses regularization bias, but valid implementation also requires controlling overfitting bias. To overcome this issue, Chernozhukov et al. (Reference Chernozhukov, Chetverikov, Demirer, Duflo, Hansen, Newey and Robins2018) suggest making use of the
 $K$
-fold version of the cross-fitting procedure, which extends the idea of the split-sample method and increases the efficiency of the estimator (Hastie et al., Reference Hastie, Tibshirani and Friedman2009). The
 $K$
-fold cross-fitting procedure randomly splits the observations
 $N$
in the sectional dimension into
 $k$
folds such that the size of each fold is
 $n=N/K$
. Then,
 $k-1$
partitions are used as the main sample, with the remaining fold serving as the auxiliary sample. The process is repeated by flipping the roles of the training and test samples and excluding each
 $ k$
-fold to obtain
 $k$
non-overlapping estimates. The results are then averaged. Robustness is achieved by repeating the
 $k$
-fold splitting
 $S$
times, and the final DML estimator is obtained by taking the median (or the mean) over the splits. We randomly split the sample data into
 $K=10$
fixed folds in our setting. For each
 $k$
fold, the ML estimators
 $\hat \eta _{k}$
for the nuisance functions
 $\eta _{k}$
are obtained by using observations contained in the
 $k-1$
remaining folds. Then, the final estimator
 $\hat \theta _h$
is the solution of:
 \begin{equation} \begin{gathered} \frac {1}{NT}\sum _{i,t}\sum _{k=1}^{K}\psi (W_{i,t}; \hat \theta _{h}, \hat \eta _{k}(W_{i,t}))=0. \end{gathered} \end{equation}
The intuition is that the ML estimation for the nuisance functions and the residual-on-residual regression to get the final estimator
 $\hat \theta _{h}$
are carried out using different and separate data, efficiently mitigating the bias induced by overfitting.
Under the required identification, convergence-rate, sparsity, and regularity conditions, the DML estimator is
 $\sqrt {NT}$
-consistent and asymptotically Gaussian, despite the slower convergence rates allowed for the nuisance estimators.Footnote
9
The application of DML to the PLR model therefore enables valid statistical inference on
 $\theta _h$
while allowing the nuisance functions to be estimated flexibly.
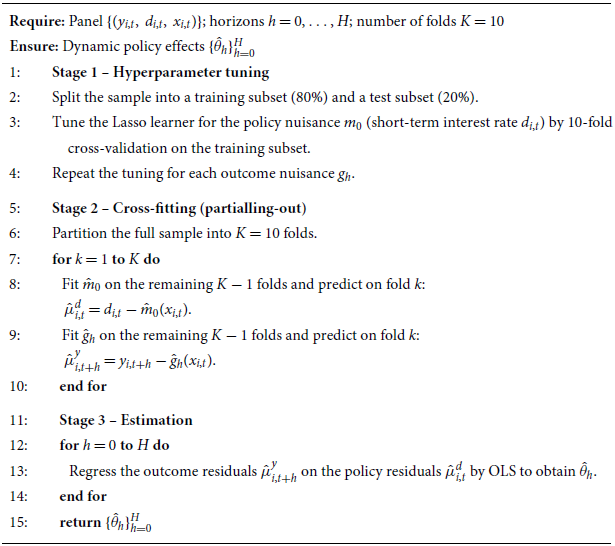
The implementation details are summarized in Algorithm 1 in Appendix D.
5. Results and discussion
This section presents the empirical results. We proceed in three steps. First, we discuss the monetary policy innovation recovered through the DML partialling-out procedure and provide diagnostic evidence on its statistical properties. Second, we estimate the dynamic response of the labor share to a contractionary monetary policy shock and compare its magnitude and timing with those reported in the existing empirical literature. Third, we investigate the transmission mechanism by tracing the responses of the main components of the labor share and of additional mediating variables, including labor productivity, employment, real investment, the relative price of investment, and the profit share of non-financial corporations.
5.1 Our measure of monetary policy shock
The DML procedure recovers monetary policy innovations as the component of the short-term interest rate that is not predictable from the observed information set. As explained in Section 4.2, the residualized policy variable
 $\hat {\mu }^{d}_{i,t}$
is obtained by subtracting from the short-term interest rate
 $d_{i,t}$
the component predicted by the high-dimensional control vector
 $x_{i,t}$
:
 \begin{equation} \begin{gathered} \hat {\mu }^{d}_{i,t}=d_{i,t}-\hat {m}_0(x_{i,t}), \hspace {0.5cm} \hat {m}_0 \in \arg \min _{m_0} E \,[ (d_{i,t}-m_0(x_{i,t}) )^2]. \end{gathered} \end{equation}
The residual
 $\hat {\mu }^{d}_{i,t}$
can therefore be interpreted as a conditional policy-rate innovation: it is the part of the policy rate that remains after partialling out the predictable component associated with observed macroeconomic, financial, and expectation-related conditions.
A specific issue arises because the policy variable is common across countries, while the conditioning variables are country-specific. This inevitably generates slightly heterogeneous residuals
 $\hat {\mu }^{d}_{i,t}$
, even though monetary policy is centralized. To recover a common Euro Area innovation, we therefore estimate the policy nuisance function using a pooled learner. Operationally, this amounts to a stacking procedure that combines country-specific nuisance learners through constrained least squares, with non-negativity and unit-sum restrictions on the weights (Ahrens et al., Reference Ahrens, Hansen, Shaffer and Wiemann2025). This choice filters out idiosyncratic local prediction errors and yields a common residualized policy-rate innovation orthogonal to the pooled information in the country-specific controls.
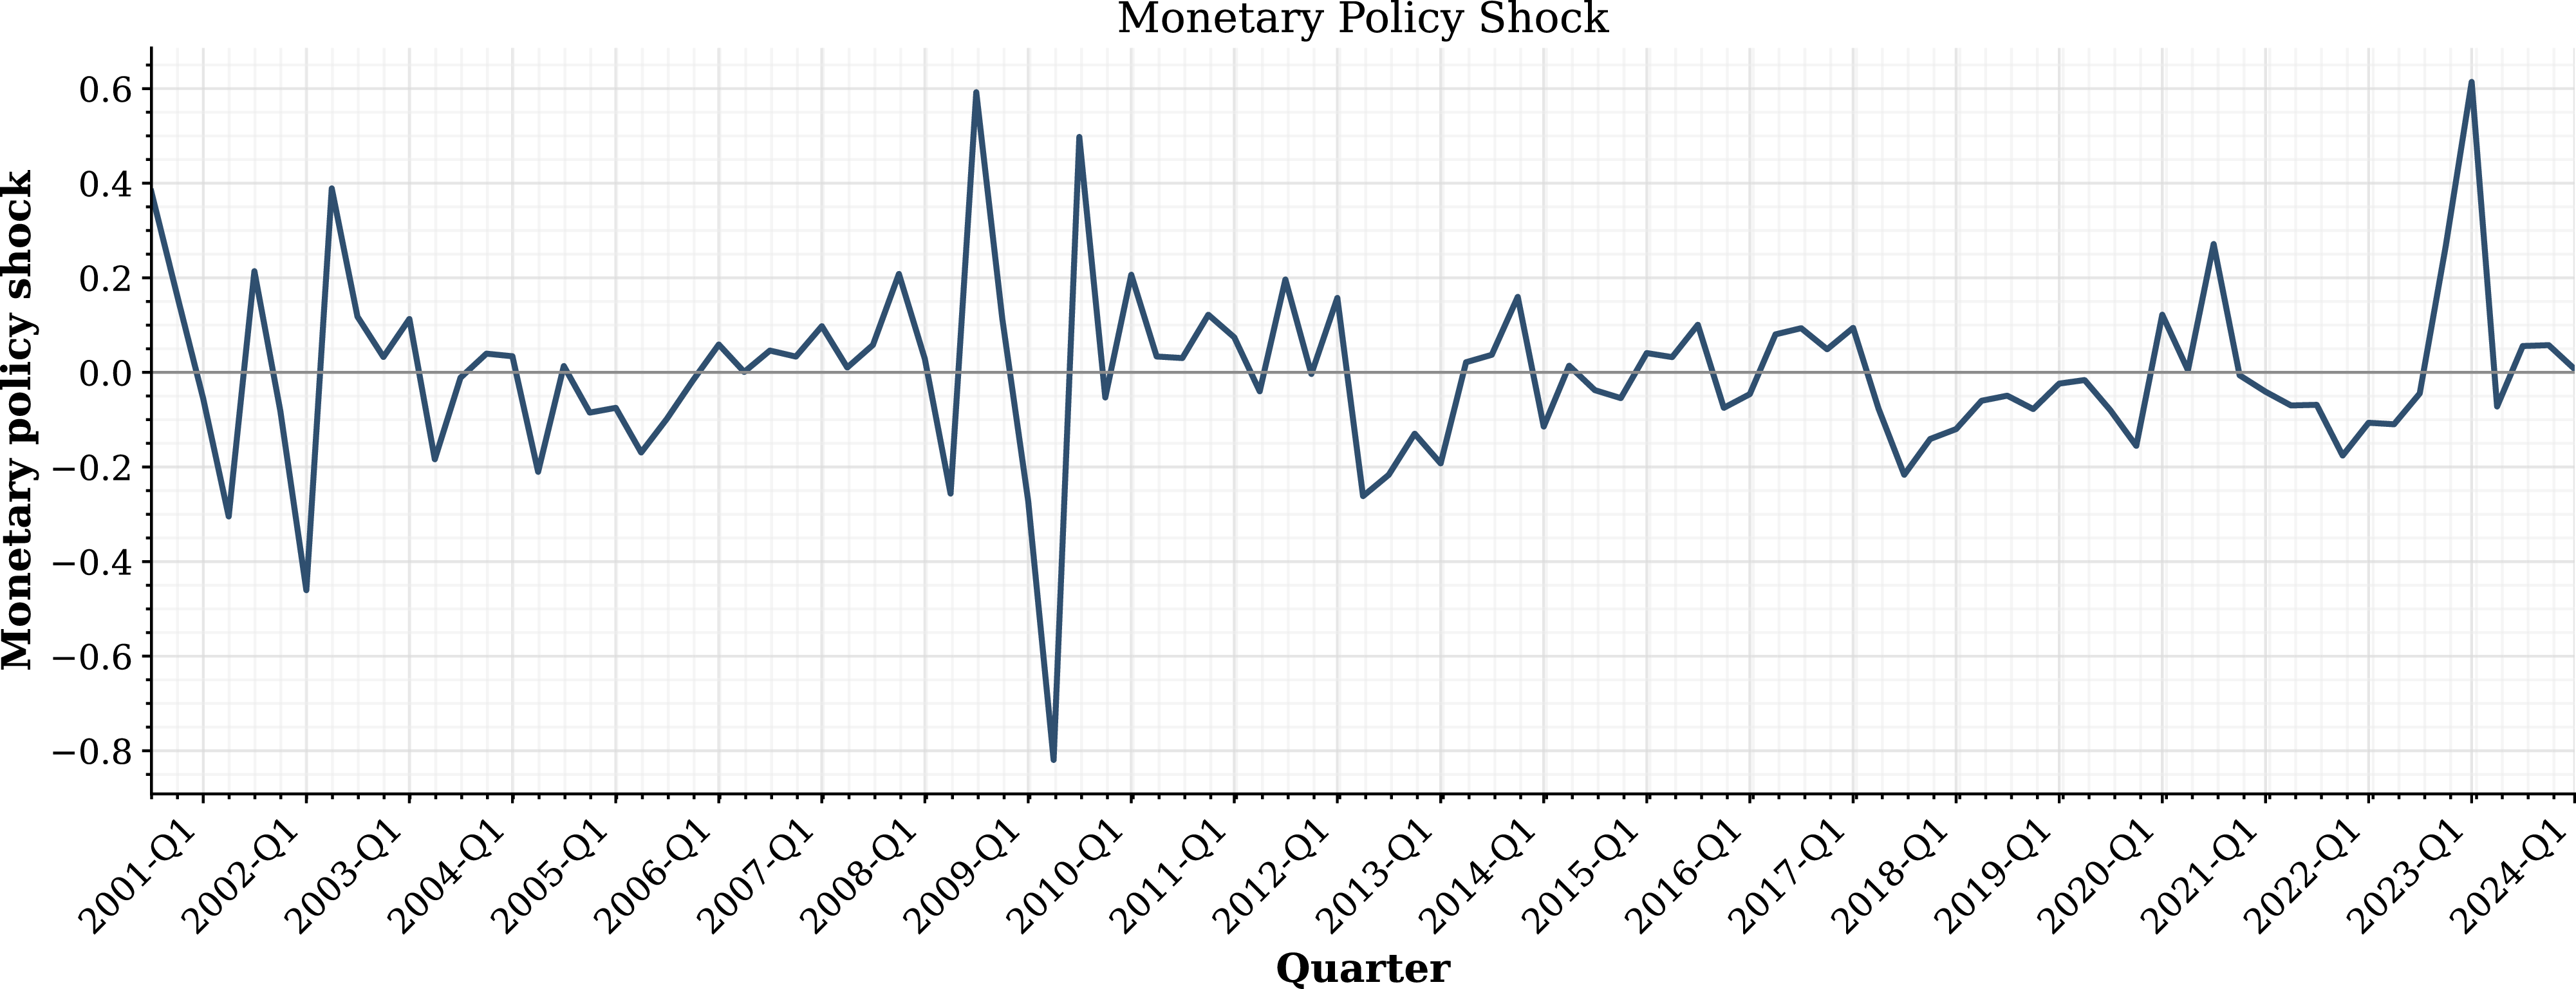
Figure 2 reports the resulting monetary policy innovation series. The series fluctuates around zero and displays no clear deterministic pattern, suggesting that the partialling-out procedure removes a substantial predictable component of the short-term interest rate. Some major realizations coincide with major macro-financial episodes, including the global financial crisis, the sovereign debt crisis, and the recent inflationary tightening. These episodes should not be interpreted mechanically as validation of the shock series; rather, they indicate that the residualized policy-rate component captures policy movements that are difficult to predict from the observed conditioning set.
Monetary policy innovations. Common Euro Area monetary policy shock recovered through the DML partialling-out procedure using a pooled (stacked) learner for the policy nuisance function. Values are expressed in percentage points (p.p.).

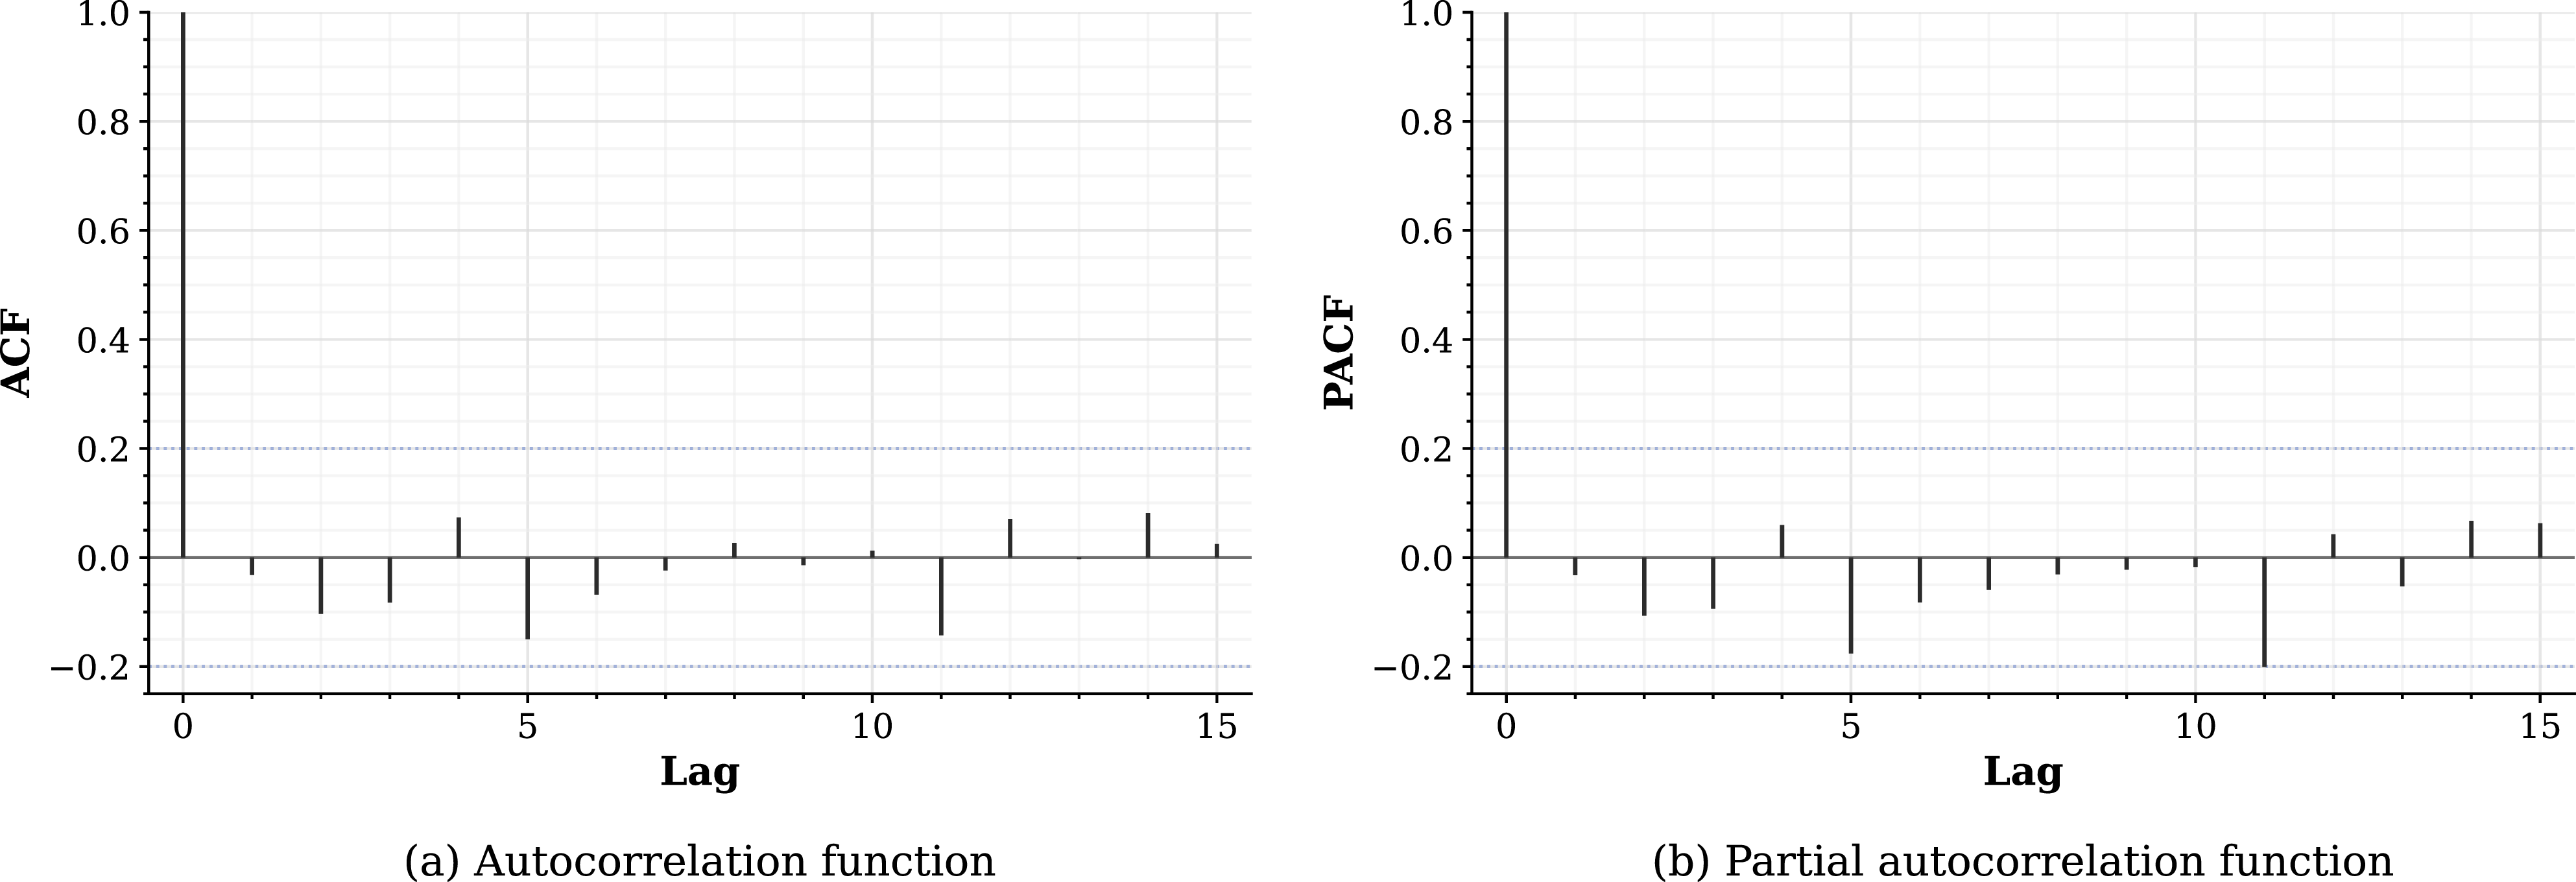
We complement the graphical inspection with residual diagnostics. Figure 3 reports the autocorrelation and partial autocorrelation functions of the average country-specific residuals. Beyond the mechanical unit autocorrelation at lag zero, the estimated autocorrelations lie within the confidence bands. This evidence is consistent with a residualized policy series that is weakly serially correlated and therefore not easily predictable from its own past.
Autocorrelation and partial autocorrelation functions of the average country-specific residuals. Blue dashed lines denote the 95% confidence interval.

These diagnostics are useful for assessing the statistical behavior of the recovered innovation, but they do not by themselves establish structural exogeneity. In our framework, identification ultimately relies on the conditional exogeneity assumption discussed in Section 4.2. The role of the diagnostics is narrower: they show that, after conditioning on a rich information set, the residualized policy-rate series does not exhibit obvious serial dependence or systematic predictable patterns. Additional validation is provided below and in the robustness analysis,Footnote 10 where we show that the estimated impulse responses are consistent with standard monetary transmission and close to those obtained using Jarocinski and Karadi (Reference Jarocinski and Karadi2020)’s high-frequency monetary policy instruments.
5.2 The labor share response to a monetary policy tightening shock
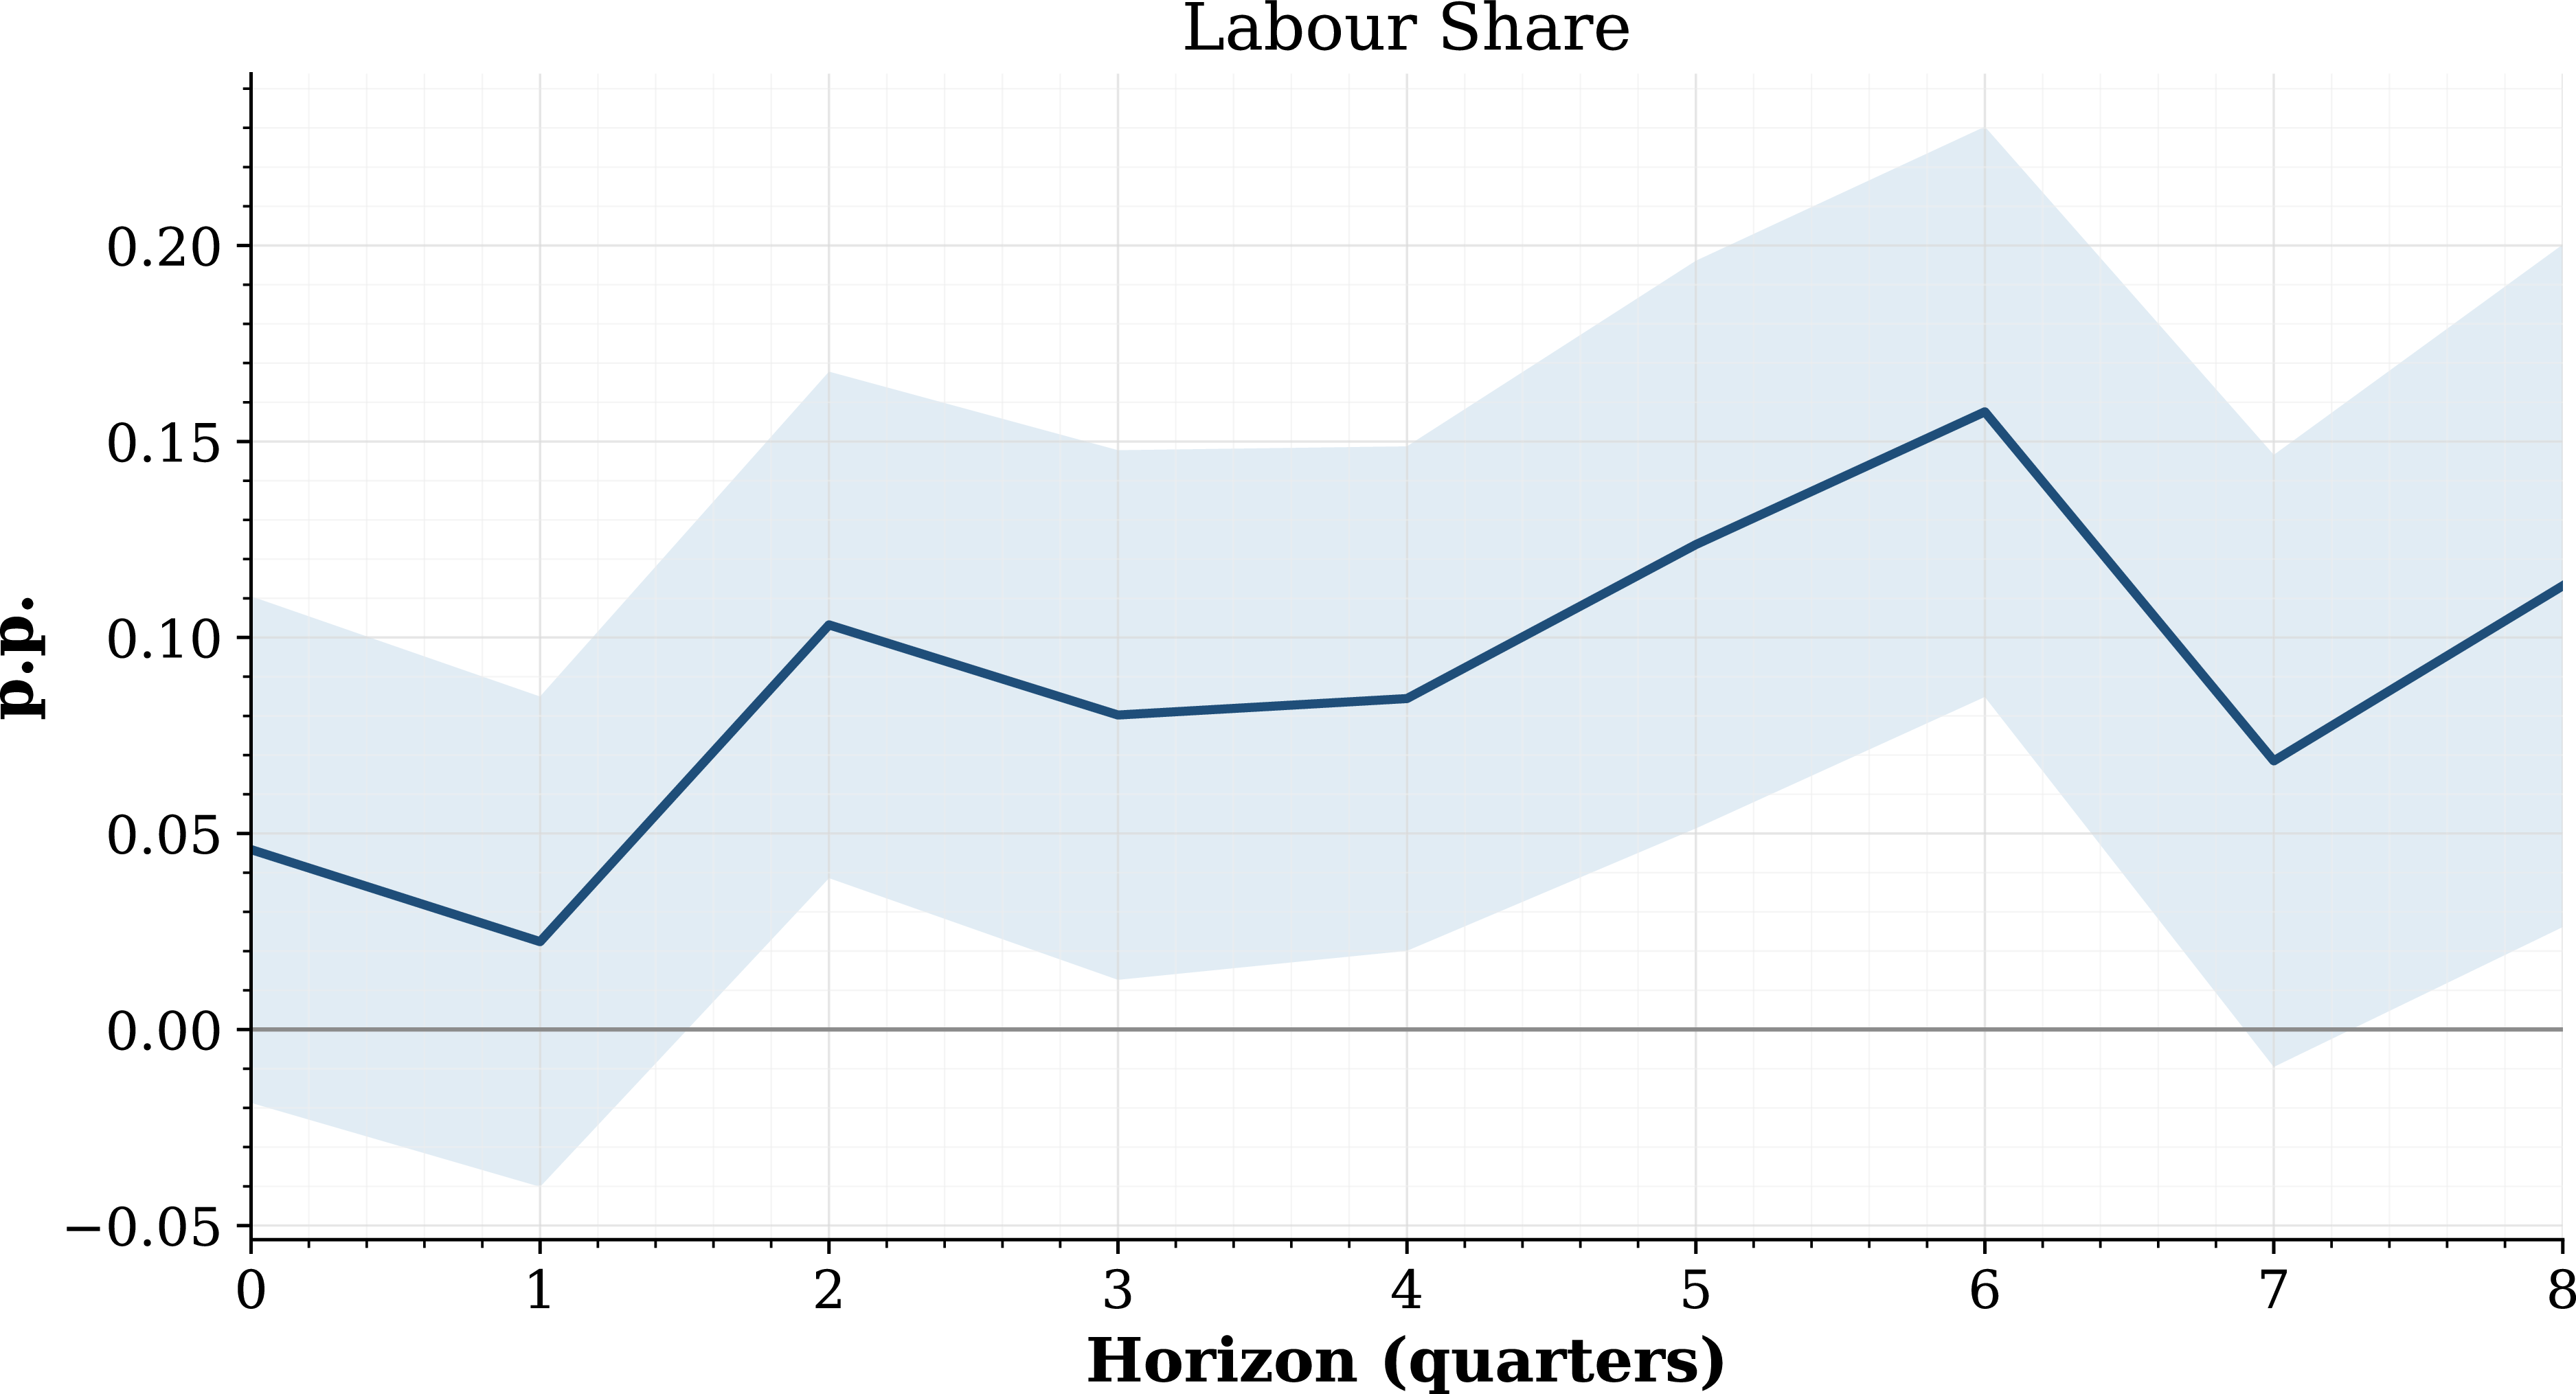
We now estimate the dynamic response of the labor share to the monetary policy innovation described above. The shock is normalized to generate a 25-basis-point increase in the Euro short-term interest rate. Figure 4 reports the estimated impulse response over eight quarters, together with 90% confidence intervals computed using the panel Heteroskedasticity and Autocorrelation Consistent (HAC) correction (Jordà, Reference Jordà2005; Stock and Watson, Reference Stock and Watson2008; Ramey, Reference Ramey2016; Kilian and Lütkepohl, Reference Kilian and Lütkepohl2017; Stock and Watson, Reference Stock and Watson2018).
Impulse response of the labor share to a monetary policy shock. Response of the labor share to a 25 basis point (bps) increase in the short-term interest rate. The blue solid line reports the DML point estimates of the dynamic response over eight horizons (quarters). The light blue shaded region corresponds to the 90% confidence interval, computed using the panel Heteroskedasticity and Autocorrelation Consistent (HAC) correction.

The labor share increases after a contractionary monetary policy shock. The response is positive at all horizons, becomes more pronounced after the first year, and peaks around the sixth quarter. The peak response is approximately
 $0.16$
percentage points, indicating that a 25-basis-point increase in the short-term interest rate raises the labor share by about 16 basis points at the maximum response horizon. The response then declines but remains positive at the end of the projection window.
This result is consistent with the empirical evidence in Cantore et al. (Reference Cantore, Ferroni and León-Ledesma2021), who find, using SVAR methods, that monetary policy contractions raise the labor share in several advanced economies, including the Euro Area. In their Euro Area estimates, the labor share response to a 25-basis-point tightening is positive and peaks at shorter horizons than in our LP-DML estimates (see Figure A2 in Appendix A). The magnitudes are not identical, as expected given the different sample periods, empirical frameworks, information sets, and identification strategies. Nevertheless, the key qualitative result is the same: monetary tightening generates a countercyclical response of the labor share.
This pattern is relevant because it is difficult to reconcile with the standard New Keynesian prediction that monetary contractions reduce real marginal costs and therefore lower the labor share, or equivalently raise markups. As emphasized by Cantore et al. (Reference Cantore, Ferroni and León-Ledesma2021), a positive labor-share response after a monetary tightening challenges the usual mapping between the labor share, marginal costs, and price markups. Our results show that the same empirical puzzle emerges in a Euro Area panel when monetary policy innovations are recovered through high-dimensional conditioning rather than through a low-dimensional SVAR.
5.3 The transmission mechanisms of monetary policy to the labor share
We next examine the channels through which monetary policy affects the labor share. The labor share can be written as the ratio between the real wage per worker and labor productivity (Galí, Reference Galí2015):
 \begin{equation} \begin{gathered} LS_t = \frac {W_tL_t}{P_tY_t} = \frac {W_t/P_t}{Y_t/L_t}. \end{gathered} \end{equation}
This decomposition implies that the labor share rises when the real wage per worker increases relative to labor productivity, or when labor productivity falls more than real wages. We therefore estimate the responses of real GDP, the GDP deflator, labor productivity, real wages, employment, real investment, the relative price of investment, and the profit share of non-financial corporations. All responses are obtained using the same LP-DML specification represented by Equations (4) and (5) and the same conditioning set as in the baseline labor-share equation.
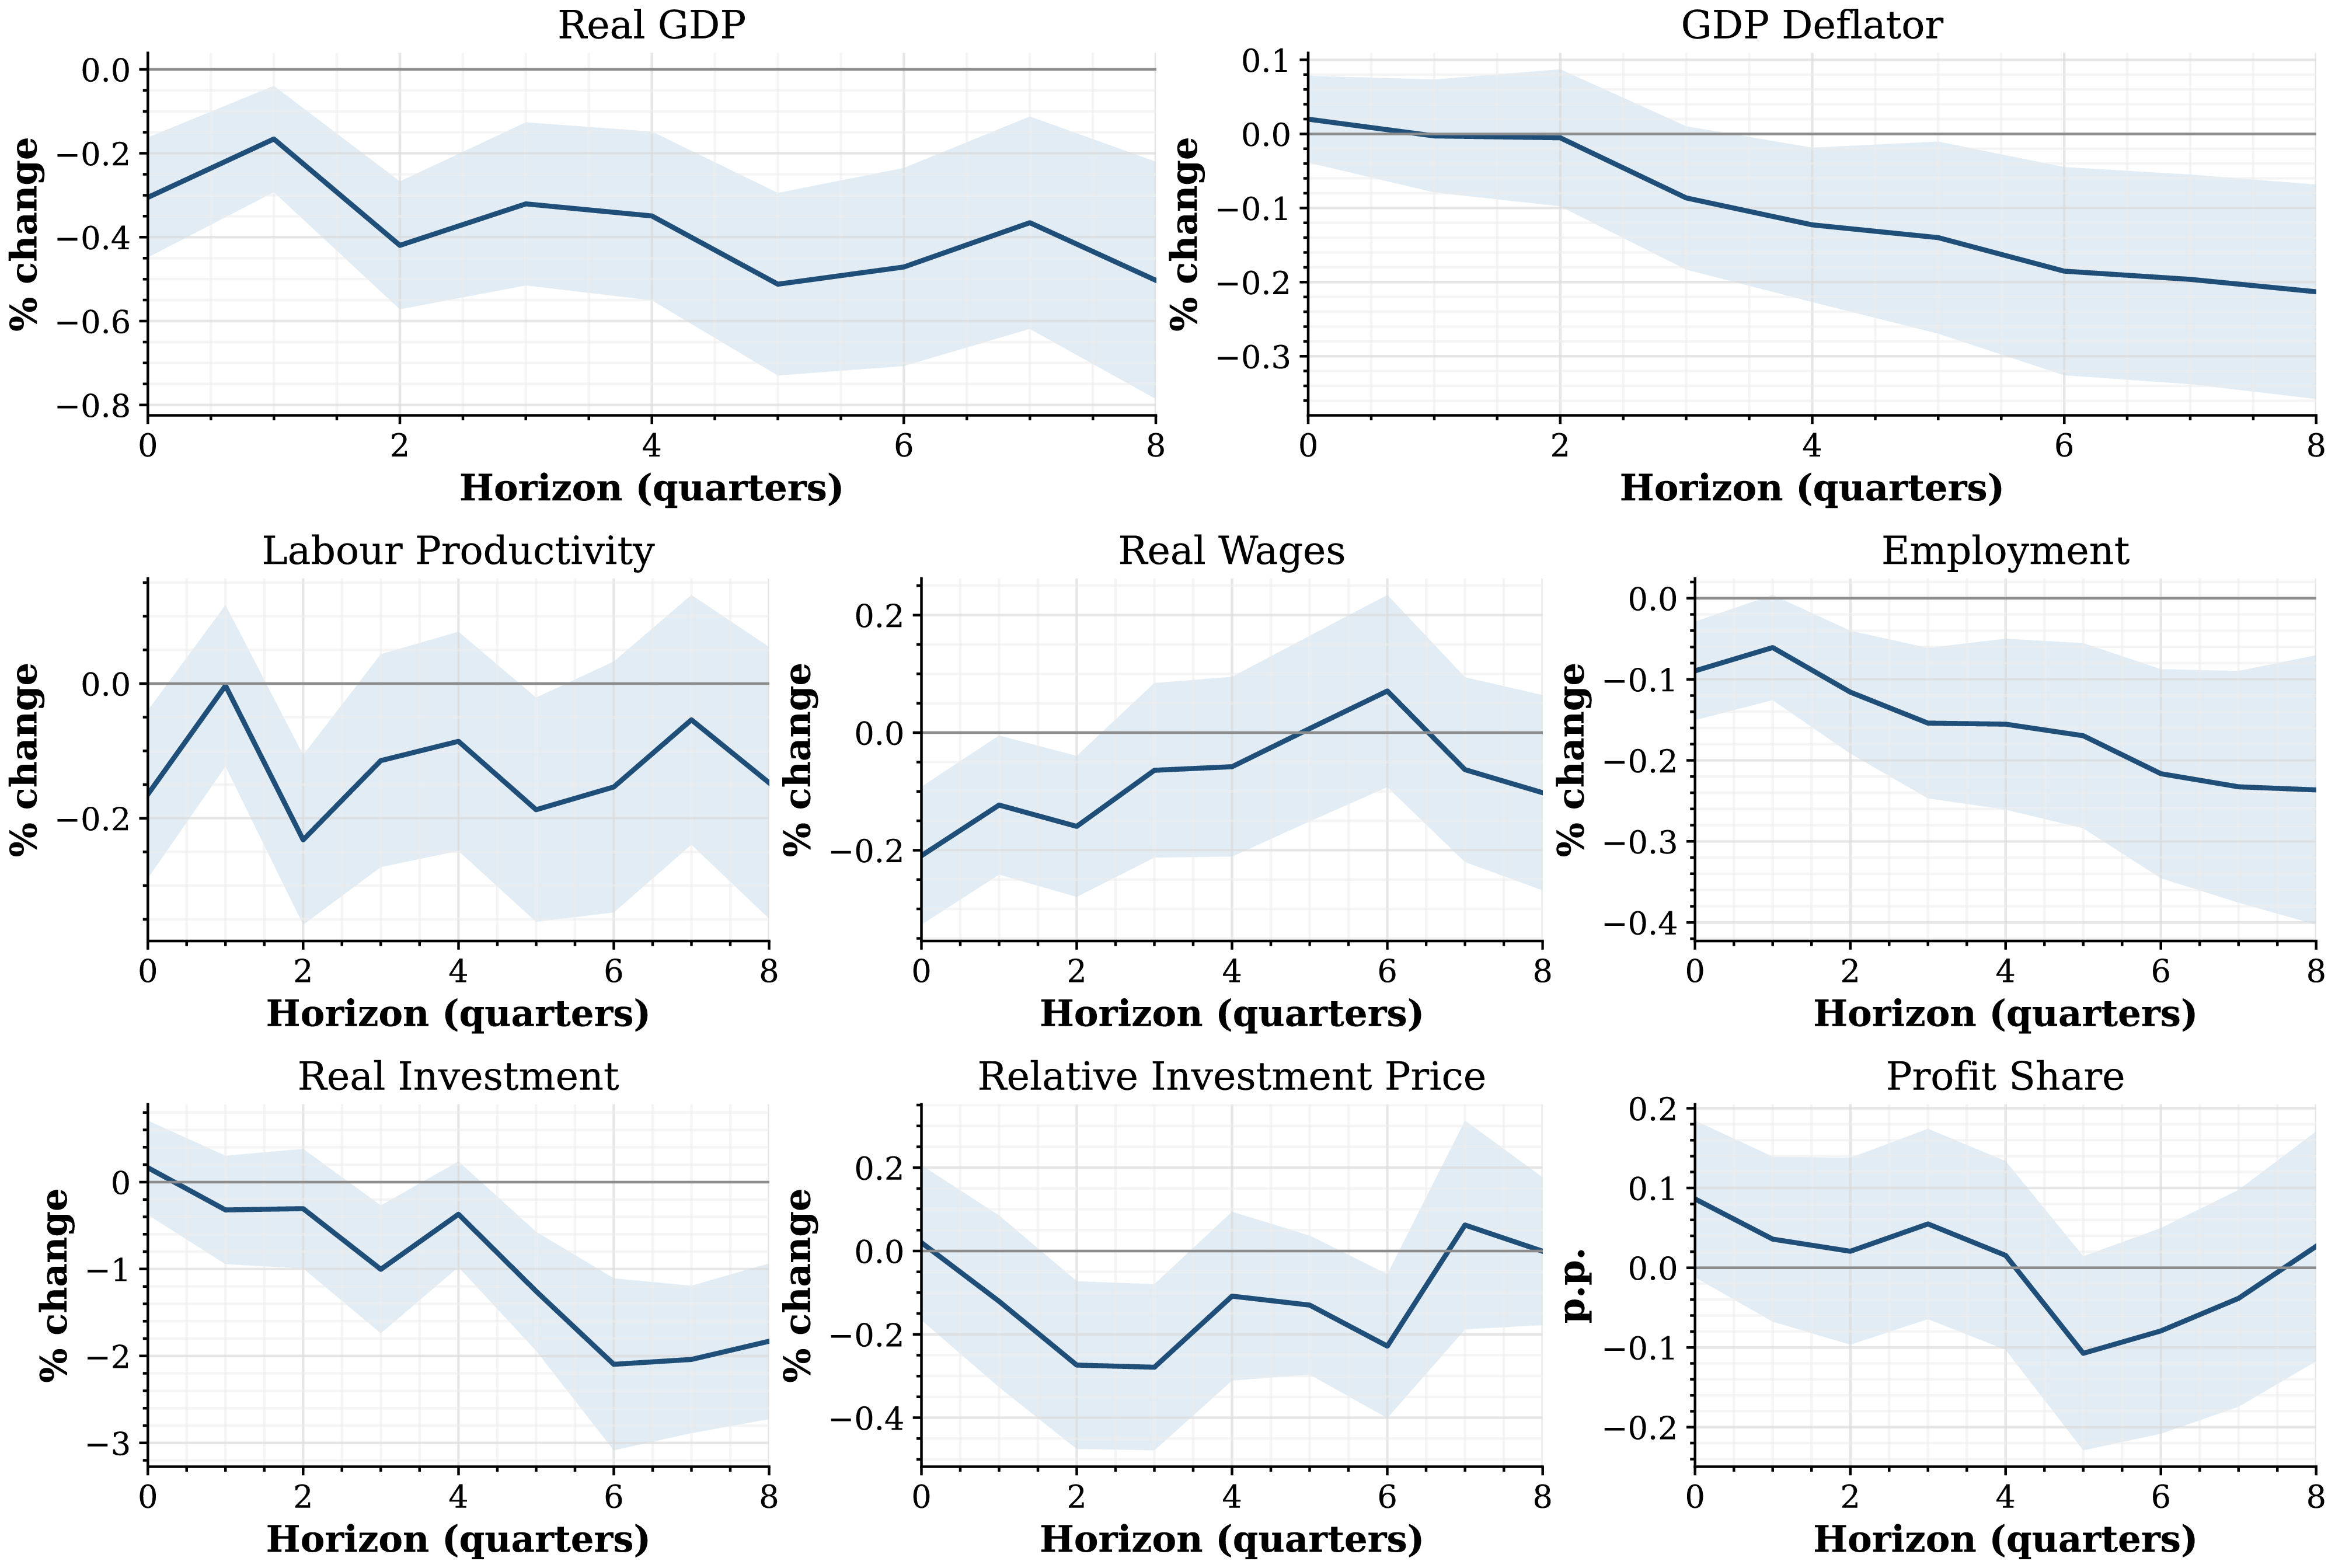
Impulse responses of the labor share’s key components to a monetary policy shock. Responses to a 25 basis point (bps) increase in the short-term interest rate. Each panel reports the DML point estimates (blue solid line) of the dynamic response over eight horizons (quarters) for real GDP, the GDP deflator, labor productivity, real wages, employment, real investment, the relative price of investment, and the profit share. The light blue shaded region corresponds to the 90% confidence interval, computed using the panel Heteroskedasticity and Autocorrelation Consistent (HAC) correction.

Figure 5 shows that the estimated responses are consistent with standard monetary transmission. Real GDP declines persistently following the tightening, with the response becoming more pronounced in subsequent periods. The GDP deflator also declines gradually, indicating that the contractionary policy shock reduces prices with the usual delay. Hence, the baseline results do not display either a production puzzle or a price puzzle (Sims, Reference Sims1992; Eichenbaum, Reference Eichenbaum1992). This evidence is informative because such anomalies often signal an insufficient information set or a problematic monetary policy indicator. In our case, it supports the interpretation that the high-dimensional conditioning set absorbs the predictable component of policy associated with macroeconomic and financial conditions, without relying directly on inflation-expectation proxies (Christiano et al., Reference Christiano, Eichenbaum and Evans1994) or on high-frequency instruments.
The labor-market responses clarify the source of the increase in the labor share. Employment falls after the tightening, while labor productivity also declines. Since real labor productivity is defined as output per worker, the simultaneous decline in output and employment indicates that output contracts more strongly than labor input. This decline in productivity is central to the rise in the labor share. Real wages, measured here as average real wages, decline mildly at short horizons but subsequently recover as prices fall. Thus, the increase in the labor share is not driven by an expansion of labor income. Instead, it reflects a relative adjustment: labor productivity falls, while average real wages are comparatively more stable and partly recover over the projection horizon. In terms of Equation (11), the denominator of the real-wage-to- productivity ratio falls more persistently than the numerator.
This mechanism is closely aligned with Cantore et al. (Reference Cantore, Ferroni and León-Ledesma2021). They show that monetary tightening raises the labor share while real wages fall or remain broadly unchanged, which implies that labor productivity declines more than real wages. Our estimates recover the same logic in a richer panel setting. The additional employment response helps interpret the productivity channel: the contraction in output is not fully matched by the contraction in employment, so output per worker falls. At the same time, the recovery of average real wages is consistent with the gradual decline in prices after the tightening. This joint pattern explains why the labor share can rise even in a contractionary environment.
The investment responses add a capital-accumulation margin to the transmission mechanism. Real investment falls sharply and persistently after the monetary tightening, while the relative price of investment declines at short and medium horizons. These responses are consistent with the standard interest-rate channel: tighter monetary policy reduces investment demand and weakens capital accumulation. They also help rationalize the decline in labor productivity, since lower investment may reduce capital deepening and capital services over the projection horizon.
This evidence connects our short-run transmission results to the broader literature on the labor share. Bergholt et al. (Reference Bergholt, Furlanetto and Maffei-Faccioli2022) emphasize the role of capital-augmenting forces, automation, firm market power, and worker market power in shaping low-frequency labor-share dynamics. Our findings speak to a different margin: they show that, conditional on a monetary tightening, investment and its relative price contract together with output and productivity. The investment response therefore reinforces the interpretation that the labor-share increase occurs in a broad contractionary environment, in which capital accumulation weakens, and labor productivity falls relative to average real wages.
The profit-share response further qualifies this interpretation. The estimated response of the profit share of non-financial corporations is small and statistically imprecise. Hence, the increase in the labor share should not be read as the mirror image of a precisely estimated fall in measured Non-Financial Corporations (NFC) profits. Rather, the evidence points to a relative-adjustment mechanism operating through output, employment, productivity, wages, and investment. Monetary tightening reduces aggregate activity and capital accumulation; employment declines more gradually than output; labor productivity falls; and average real wages are comparatively more stable, partly reflecting the decline in prices. The labor share rises because productivity and aggregate activity adjust more strongly than average real wages, not because labor income expands in absolute terms.
Overall, the evidence for transmission points to a coherent mechanism. Monetary tightening reduces real activity, prices, employment, and investment. Output falls by more than labor input, resulting in a decline in labor productivity. Average real wages initially weaken but then recover as prices decline, so they adjust less persistently than productivity does. The labor share therefore increases because productivity and aggregate activity contract more than average real wages. This conditional pattern is consistent with the countercyclical labor-share response documented by Cantore et al. (Reference Cantore, Ferroni and León-Ledesma2021). At the same time, it remains difficult to reconcile with standard monetary models in which contractionary policy lowers real marginal costs, and the labor share, or equivalently raises markups. As emphasized by Cantore et al. (Reference Cantore, Ferroni and León-Ledesma2021), richer medium-scale models can generate a positive labor-share response only under specific assumptions on relative wage and price rigidity, often at the cost of counterfactual real-wage dynamics. Our estimates reinforce this empirical tension. We show that the labor share response is embedded in a broader contractionary transmission mechanism, in which output, employment, prices, and investment all decline. The additional investment and profit-share responses further show that the result should not be interpreted as a simple redistribution from profits to wages, but as a relative adjustment in which labor productivity and aggregate activity fall more strongly than average real wages.
6. Robustness analysis
This section assesses the robustness of the baseline results along several dimensions. The exercises evaluate whether the countercyclical response of the labor share depends on the identification scheme, the sample period, the machine-learning method used to estimate the nuisance functions, the linearity restriction, or the composition of member states. The supporting figures are reported in Appendices A and B.
We begin by comparing the LP-DML estimates with alternative benchmark identification schemes. First, we estimate a panel LP-IV specification using the high-frequency monetary policy external instrument of Jarocinski and Karadi (Reference Jarocinski and Karadi2020) for the Euro Area. Second, we juxtapose our impulse responses with the SVAR-based evidence reported by Cantore et al. (Reference Cantore, Ferroni and León-Ledesma2021), using both a contemporaneously recursive scheme and a Proxy-VAR based on an external high-frequency instrument. Figures A1 and A2 show that the main qualitative pattern is preserved across identification schemes. A contractionary monetary policy shock raises the labor share, reduces real activity, and generates a gradual decline in prices. The magnitudes and timing do not exactly match the SVAR-based results, as expected given differences in sample period, information set, and identification strategy. However, the comparison indicates that the LP-DML estimates remain consistent with the main empirical regularities documented in Cantore et al. (Reference Cantore, Ferroni and León-Ledesma2021): monetary tightening increases the labor share while real wages adjust less than output and productivity. These comparisons support the interpretation of the DML residualized policy-rate innovations as meaningful monetary policy shocks.
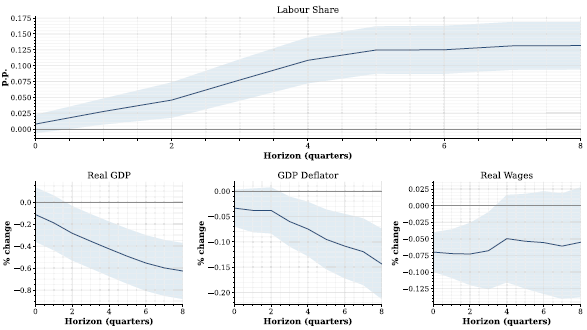
Second, we examine the sensitivity of the results to the sample period. Since the COVID-19 shock generated exceptional movements in output, prices, wages, and policy rates, we re-estimate the baseline specification excluding the pandemic period. As shown in Figure A3, the impulse responses remain qualitatively unchanged. The labor share increases after a contractionary shock, while real GDP declines, the GDP deflator falls gradually, and real wages do not display an offsetting expansion. Hence, the main transmission mechanism is not driven by the exceptional observations associated with the pandemic period.
Third, we assess the sensitivity of the estimates to the machine learner used to approximate the nuisance functions. In addition to the baseline Lasso, we re-estimate the model using Elastic Net and Random Forest learners. Figures A4 and A5 show that the estimated responses remain close to the baseline. The Random Forest estimates are somewhat smoother and display slightly different degrees of uncertainty, but the signs, magnitudes, and dynamic profiles are comparable.
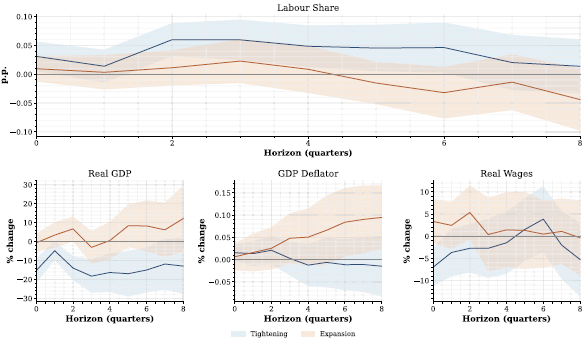
Fourth, we examine whether the baseline linear specification masks asymmetric effects of monetary policy. Following the literature on nonlinear and sign-dependent monetary transmission (Barnichon et al., Reference Barnichon, Matthes and Sablik2017; Angrist et al., Reference Angrist, Jord‘a and Kuersteiner2018; Debortoli et al., Reference Debortoli, Forni, Gambetti and Sala2020; Caravello and Martinez-Bruera, Reference Caravello and Martinez-Bruera2024), we allow the responses to vary with the sign of the policy innovation, distinguishing between tightening and easing shocks. Figure B1 reveals evidence of asymmetry. Tightening shocks appear more effective than expansionary ones in moving the labor share and its components. The response to easing shocks is weaker and less precisely estimated. This finding is consistent with the view that contractionary monetary policy has stronger real effects than expansionary policy. Importantly, the main transmission mechanism for tightening shocks is preserved.
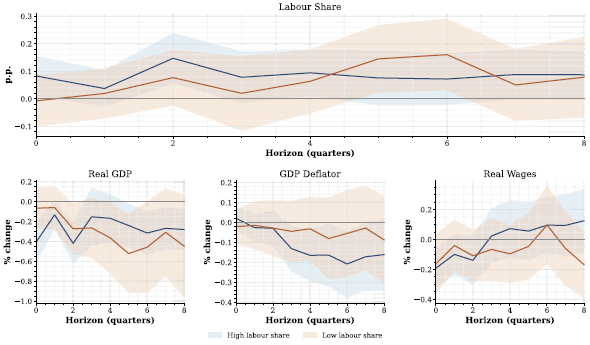
Finally, we investigate whether the pooled panel estimates mask relevant cross-country heterogeneity that could affect policy transmission (Kaplan et al., Reference Kaplan, Moll and Violante2018). We split the cross-sectional dimension according to countries’ average labor-share levels and re-estimate the model within the resulting groups. Figure B2 shows that the estimates become noisier, as expected from the smaller group-specific samples, and do not point to significant quantitative differences across groups. One possible interpretation is that the country-specific conditioning set already absorbs a substantial part of the relevant heterogeneity. The qualitative transmission pattern is nonetheless preserved within each group.
Overall, the robustness exercises indicate that the countercyclical response of the labor share is not driven by the specific identification scheme, the inclusion of the pandemic period, the choice of machine learner, the linearity restriction, or the composition of member states. Across specifications, the same conditional pattern emerges: after a contractionary monetary policy shock, real activity and prices decline, while labor costs adjust less than aggregate activity. The labor share therefore rises as part of a broader contractionary transmission mechanism, rather than because of an expansion in labor income.
7. Conclusions
This paper studies the dynamic effect of monetary policy on the labor share in the Euro Area. We combine panel local projections with the Double/DML estimator to recover policy innovations from a high-dimensional set of macroeconomic, financial, and expectation-related controls. The estimator partials out the component of the short-term interest rate that is predictable from the observed information set.
The results show that the labor share increases after a contractionary monetary policy shock. The response occurs in a standard contractionary environment: real activity, prices, employment, and investment decline. Within this adjustment, labor productivity falls more persistently than average real wages, so the labor share rises even though labor income does not expand in absolute terms. The additional responses of investment, the relative price of investment, and the profit share of non-financial corporations indicate that the mechanism is not a simple redistribution from profits to wages. Rather, monetary tightening raises the labor share because productivity and aggregate activity contract more sharply than average real wages.
These findings are consistent with the empirical evidence in Cantore et al. (Reference Cantore, Ferroni and León-Ledesma2021) and reinforce the tension with standard monetary models, which typically imply that contractionary policy lowers real marginal costs and the labor share, or equivalently raises markups. Our estimates instead show that a countercyclical labor-share response can arise together with puzzle-free responses of output and prices, declining employment, weaker capital accumulation, and comparatively smoother real-wage dynamics.
Methodologically, the paper applies DML to monetary policy identification in a dynamic panel local-projections setting. By combining high-dimensional conditioning, Neyman orthogonality, and cross-fitting, the approach mitigates regularization and overfitting biases in nuisance-function estimation. The baseline responses are robust to external benchmarks based on high-frequency monetary policy instruments and SVAR evidence, to the exclusion of the COVID period, to alternative machine learners, to sign-dependent specifications, and to sample splits by countries’ average labor-share levels.
Overall, the evidence suggests that the Euro Area labor share is countercyclical conditional on monetary policy shocks. More broadly, the analysis shows that causal machine-learning methods can be useful for macroeconomic policy evaluation when identification requires conditioning on a rich information set and when external instruments are unavailable or used as complementary benchmarks.
Acknowledgements
We thank the editor and the two anonymous referees for their insightful suggestions that have improved this article. In addition, we thank Tommaso Aquilante, Emanuele Bacchiocchi, Francesco Bloise, Cristiano Cantore, Federico D’Amario, Makram El-Shagi, Luca Fanelli, Daria Finocchiaro, Marianna Nitti, Massimiliano Pisani and Harald Uhlig. Finally, we also thank all the participants of the 1st Frontiers of Causal Inference and Machine Learning Conference, the 13th SIdE Workshop for PhD students in Econometrics and Empirical Economics and the 8th HenU/INFER Workshop on Applied Macroeconomics for helpful comments and suggestions.
Appendix A. Robustness checks
A.1 Panel IV local projection
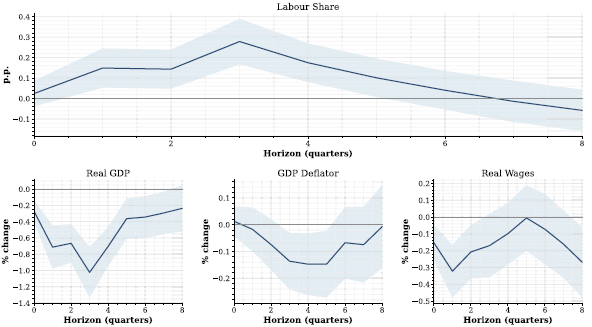
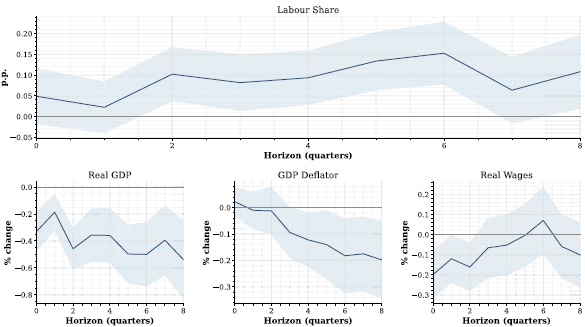
Figure A1 reports impulse responses obtained from a panel local-projection specification identified with the high-frequency monetary policy instrument of Jarocinski and Karadi (Reference Jarocinski and Karadi2020). The responses are close to the baseline LP-DML estimates in sign, magnitude, and dynamic profile. This comparison supports the interpretation that the LP-DML procedure recovers economically meaningful policy innovations.
Impulse responses to a monetary policy shock—LP-IV with high-frequency instrument. Responses of the labor share and its main components to a 25 basis point (bps) increase in the short-term interest rate, identified using the high-frequency instrument of Jarocinski and Karadi (Reference Jarocinski and Karadi2020). The blue solid lines report the point estimates of the dynamic responses over eight horizons (quarters). The shaded regions correspond to the 90% confidence interval, computed using the Heteroskedasticity and Autocorrelation Consistent (HAC) correction.

Figure A1. Long description
Panel A: A line graph shows the labor share response to a monetary policy shock over eight quarters. The x-axis represents the horizon in quarters, and the y-axis represents the response in percentage points (p.p.). The blue solid line indicates the point estimates, and the shaded region corresponds to the 90% confidence interval. The labor share increases initially, peaks around the third quarter, and then gradually declines. Panel B: A line graph displays the real GDP response to a monetary policy shock over eight quarters. The x-axis represents the horizon in quarters, and the y-axis represents the percent change. The blue solid line shows the point estimates, and the shaded region indicates the 90% confidence interval. Real GDP initially declines, reaches a trough around the third quarter, and then partially recovers. Panel C: A line graph illustrates the GDP deflator response to a monetary policy shock over eight quarters. The x-axis represents the horizon in quarters, and the y-axis represents the percent change. The blue solid line represents the point estimates, and the shaded region shows the 90% confidence interval. The GDP deflator decreases initially, hits a low point around the third quarter, and then gradually increases. Panel D: A line graph presents the real wages response to a monetary policy shock over eight quarters. The x-axis represents the horizon in quarters, and the y-axis represents the percent change. The blue solid line indicates the point estimates, and the shaded region corresponds to the 90% confidence interval. Real wages initially drop, reach a minimum around the third quarter, and then rise slightly.
A.2 Benchmarking against structural VAR evidence
Figure A2 compares the baseline LP-DML responses with the SVAR estimates of Cantore et al. (Reference Cantore, Ferroni and León-Ledesma2021), obtained from both their recursive Cholesky ordering and their proxy (IV)-VAR identification. Across labor share, real GDP, the GDP deflator, and real wages, the DML responses are close in sign and of similar magnitude to the Cantore et al. (Reference Cantore, Ferroni and León-Ledesma2021) estimates, which lie largely within our confidence bands at most horizons. Both approaches deliver a positive labor-share response alongside declines in output, prices, and real wages. The remaining quantitative differences are consistent with differences in sample period, identification strategy, information set, and econometric specification.
Impulse responses to a monetary policy shock—comparison with Cantore et al. (Reference Cantore, Ferroni and León-Ledesma2021). Responses of the labor share and its main components to a 25 basis point (bps) increase in the short-term interest rate. The figure compares the baseline DML estimates with the Cholesky-identified and IV (proxy) SVAR point estimates of Cantore et al. (Reference Cantore, Ferroni and León-Ledesma2021). Solid lines report the point estimates over eight horizons (quarters); the shaded region corresponds to the 90% DML confidence interval, computed using the Heteroskedasticity and Autocorrelation Consistent (HAC) correction.

A.3 Ruling out the pandemic period
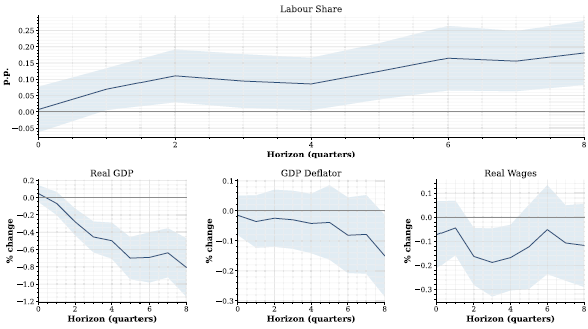
We re-estimate the model using data ending in 2019Q4 to assess whether the exceptional observations associated with the COVID-19 period drive the baseline results. Figure A3 confirms the main findings. A contractionary monetary policy shock still raises the labor share, while real activity and prices decline. The real-wage response remains consistent with the baseline mechanism: average real wages adjust less persistently than aggregate activity, so the labor-share response is not driven by an expansion in labor income.
Impulse responses to a monetary policy shock—excluding the pandemic period. Responses of the labor share and its main components to a 25 basis point (bps) increase in the short-term interest rate, re-estimated on the sample ending in 2019Q4. The blue solid lines report the DML point estimates over eight horizons (quarters). The shaded regions correspond to the 90% confidence interval, computed using the Heteroskedasticity and Autocorrelation Consistent (HAC) correction.

Figure A3. Long description
The figure contains four line graphs. Panel A shows the labor share over eight quarters, with the y-axis labeled in percentage points (p.p.) and the x-axis labeled in quarters. The blue line represents the point estimates, and the shaded region indicates the 90% confidence interval. Panel B displays the real GDP response, with the y-axis showing percent change and the x-axis labeled in quarters. Panel C illustrates the GDP deflator response, with similar axes to Panel B. Panel D presents the real wages response, also with percent change on the y-axis and quarters on the x-axis. Each graph shows the impact of a 25 basis point increase in the short-term interest rate, with the blue lines representing point estimates and the shaded areas indicating the 90% confidence intervals.
A.4 Alternative ML algorithms
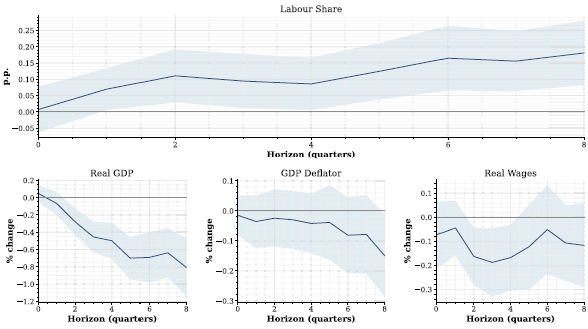
We assess whether the results depend on the machine-learning method used to estimate the nuisance functions. In addition to the baseline Lasso specification, we re-estimate the model using Elastic Net and Random Forest learners.Footnote 11
Figure A4 reports the Elastic Net estimates. The dynamic responses are close to those obtained under the baseline Lasso specification.
Impulse responses to a monetary policy shock—Elastic Net learner. Responses of the labor share and its main components to a 25 basis point (bps) increase in the short-term interest rate, with nuisance functions estimated via Elastic Net (a linear combination of the Lasso and Ridge penalties). The blue solid lines report the DML point estimates over eight horizons (quarters). The shaded regions correspond to the 90% confidence interval, computed using the Heteroskedasticity and Autocorrelation Consistent (HAC) correction.

Figure A4. Long description
Panel A: A line graph shows the labor share over eight quarters. The x-axis represents the horizon in quarters, and the y-axis represents the change in labor share in percentage points. The blue solid line indicates the point estimates, and the shaded region corresponds to the 90% confidence interval. The labor share generally increases over time with some fluctuations. Panel B: A line graph depicts the real GDP over eight quarters. The x-axis represents the horizon in quarters, and the y-axis represents the percent change in real GDP. The blue solid line shows the point estimates, and the shaded region indicates the 90% confidence interval. Real GDP shows a decreasing trend initially and then stabilizes. Panel C: A line graph illustrates the GDP deflator over eight quarters. The x-axis represents the horizon in quarters, and the y-axis represents the percent change in the GDP deflator. The blue solid line represents the point estimates, and the shaded region shows the 90% confidence interval. The GDP deflator consistently decreases over time. Panel D: A line graph presents real wages over eight quarters. The x-axis represents the horizon in quarters, and the y-axis represents the percent change in real wages. The blue solid line indicates the point estimates, and the shaded region corresponds to the 90% confidence interval. Real wages show an increasing trend with some variability.
Figure A5 reports the Random Forest estimates. The responses are smoother and somewhat more uncertain than in the baseline, but their signs, magnitudes, and dynamic profiles remain comparable.
Impulse responses to a monetary policy shock—Random Forest learner. Responses of the labor share and its main components to a 25 basis point (bps) increase in the short-term interest rate, with nuisance functions estimated via Random Forest. The blue solid lines report the DML point estimates over eight horizons (quarters). The shaded regions correspond to the 90% confidence interval, computed using the Heteroskedasticity and Autocorrelation Consistent (HAC) correction.

Appendix B. Nonlinearities and cross-country heterogeneity
B.1 Asymmetry by the sign of the policy innovation
We allow dynamic responses to differ by the sign of the policy innovation, separately estimating the effects of tightening and expansionary shocks. To do so, we decompose the common residualized policy innovation
 $\hat {\mu }^{d}_{i,t}$
into its positive and negative parts,
 \begin{equation} \hat {\mu }^{d+}_{i,t} = \max \bigl (\hat {\mu }^{d}_{i,t},\,0\bigr ), \qquad \hat {\mu }^{d-}_{i,t} = \min \bigl (\hat {\mu }^{d}_{i,t},\,0\bigr ), \end{equation}
so that
 $\hat {\mu }^{d}_{i,t} = \hat {\mu }^{d+}_{i,t} + \hat {\mu }^{d-}_{i,t}$
by construction. We then replace the single-regressor residual-on-residual regression in Equation (6) with the two-regressor counterpart
 \begin{equation} \hat {\mu }^{y}_{i,t+h} = \theta ^{+}_{h}\,\hat {\mu }^{d+}_{i,t} + \theta ^{-}_{h}\,\hat {\mu }^{d-}_{i,t} + \epsilon _{i,t+h}, \qquad h=0,\ldots ,8, \end{equation}
where
 $\theta ^{+}_{h}$
captures the response to a tightening innovation (
 $\hat {\mu }^{d+}_{i,t}\gt 0$
) and
 $\theta ^{-}_{h}$
captures the response to an expansionary innovation (
 $\hat {\mu }^{d-}_{i,t}\lt 0$
). All other steps of the DML procedure—cross-fitting, nuisance estimation, and HAC inference—are identical to the baseline. Figure B1 reports the resulting impulse responses. The exercise points to a nonlinear transmission: contractionary innovations generate clearer and larger responses than expansionary innovations of comparable size, suggesting stronger transmission after tightening shocks. The baseline mechanism is preserved under tightening shocks, with the labor share rising as labor productivity falls more than real wages do.
Impulse responses to a monetary policy shock—asymmetry by sign of the policy innovation. Responses of the labor share and its main components to a 25 basis point (bps) policy innovation, distinguishing tightening from expansionary shocks. The solid lines report the DML point estimates over eight horizons (quarters) for each regime; the shaded regions correspond to the 90% confidence interval, computed using the Heteroskedasticity and Autocorrelation Consistent (HAC) correction.

Impulse responses to a monetary policy shock—heterogeneity by labor-share level. Responses of the labor share and its main components to a 25 basis point (bps) increase in the short-term interest rate, for country groups split by their average labor-share level (high vs. low). The solid lines report the DML point estimates over eight horizons (quarters) for each group; the shaded regions correspond to the 90% confidence interval, computed using the Heteroskedasticity and Autocorrelation Consistent (HAC) correction.

Figure B2. Long description
Panel A: A line graph shows the labor share response to a monetary policy shock over eight quarters. The x-axis represents the horizon in quarters, and the y-axis represents the change in labor share in percentage points. Two lines, one for high labor-share countries and one for low labor-share countries, show the DML point estimates. The shaded regions indicate the 90% confidence interval. Panel B: Three line graphs depict the responses of real GDP, GDP deflator, and real wages to the same shock. Each graph has the horizon in quarters on the x-axis and the percentage change on the y-axis. The solid lines represent the DML point estimates for high and low labor-share countries, with shaded regions showing the 90% confidence interval.
B.2 Heterogeneity by labor-share level
We next assess whether the pooled estimates conceal relevant cross-country heterogeneity. We split the panel into groups defined by countries’ average labor-share levels (high vs. low) and re-estimate the model within each group. Figure B2 shows that the group-specific responses are less precisely estimated and do not display significant quantitative differences across groups. A plausible explanation is that the high-dimensional, country-specific conditioning set already absorbs much of the relevant heterogeneity. Reassuringly, both groups preserve the qualitative pattern of the baseline estimates.
Appendix C. Data description
Variable description

Table C1. Long description
Panel A: A table listing 11 Euro Area countries: Austria, Belgium, Finland, France, Germany, Greece, Ireland, Italy, the Netherlands, Portugal, and Spain. Panel B: A table indicating the period of analysis from 1999Q1 to 2025Q4, including the pandemic period. Panel C: A note explaining the exclusion of Luxembourg due to missing data and the inclusion of Greece, which joined the euro area in 2001.
Appendix D. DML-LP algorithm
DML estimation of dynamic policy effects in a panel local projections setting

Algorithm 1 Long description
An algorithm with three stages: hyperparameter tuning, cross-fitting, and estimation. Stage 1 involves splitting the sample, tuning the Lasso learner for policy nuisance, and repeating for each outcome nuisance. Stage 2 partitions the sample into folds, fits models on remaining folds, and predicts on each fold. Stage 3 regresses outcome residuals on policy residuals to obtain dynamic policy effects.