Introduction
With the development of wireless networks, it is made it significant to utilize 5G technology for wireless sensor networks (WSN) not only in smart cities but also in smart homes [Reference Lynggaard and Skouby1]. Accordingly, an application is developed on WSN that interacts with various networks such as mobile networks (LTE), the migration to the 5G technology, protocols, and the internet [Reference Martínez, Salcedo and Daza2]. Christin et al. consider that WSN will be integrated with the internet of things (IoT) in the future [Reference Christin, Reinhardt, Mogre and Steinmetz3]. In this case, sensor nodes should actively get involved the Internet. In addition, WSN is a kind of massive machine type communication (mMTC) application for sensing, and also monitoring that is one of the tasks on the 5G network with massive IoT [Reference Iskandar, Hendrawan and Arifianto4]. These observations are motivated by this study to be conducted in the 5G frequency band.
The main parameter that determines the RF propagation and channel properties of the electromagnetic wave in an indoor and outdoor environment is path loss [Reference Li, Zhang, Lu, Zheng and Lv5]. Even though the studies on radio wave propagation in forest environments are common [Reference Kurnaz and Helhel6–Reference Picallo, Klaina, Lopez-Iturri, Aguirre, Celaya-Echarri, Azpilicueta, Eguizábal, Falcone and Alejos10], pebble, and sand environments are not studied extensively. In some cases, radio propagation is studied for tracking animal grazing in large terrains [Reference Gay-Fernández, Cuiñas, Sánchez and Alejos11]. A sample of works utilizes the free-space path loss (FSPL) model [Reference Saunders and Aragón-Zavala12], two-ray model [Reference He, Zhong, Ai, Ding and Guan13], ray-tracing model [Reference Jarndal and Alnajjar14], and knife-edge diffraction model [Reference Zang and Wang15] in various areas. However, these studies show that the effects on path loss are not similar, as each different environment has its own channel characteristics. Therefore, the lack of accurate models causes inadequate and incomplete results of using WSN in coverage planning. The wide variety of these propagation models allows WSN to monitor and track targets accurately [Reference Akyildiz and Vuran16, Reference Sawant, Liang, Popa and Lewis17]. Also, the research studies [Reference Olasupo, Otero, Kostanic and Shaikh18] points out that the propagation of RF has different effects on various terrains. Therefore, it becomes an important need to effectively determine the effects of terrain changes on path loss in pebble and sand environments.
This study is made to overcome the problems mentioned above and to generate more accurate path loss models. The proposed models can be utilized not only for tracking bird feeding habits but also for monitoring sports activities and environmental/ground surveillance on the coastal pebble environments. Unlike path loss models, pebbles can also be tracked using active RFID [Reference Cassel, Dépret and Piégay19, Reference Papini, Ivanov, Brambilla, Arosio and Longoni20]. In addition to monitoring pebble mobility, the proposed model can also contribute to the recovery process in flood-type avalanches that may occur in gravel-bed rivers. On the other hand, the proposed models are expected to support the coverage planning tools to obtain more accurate channel characterizations. Finally, proposed models, which are expected to be used in applications such as the IoT, can be effective with WSN in controlling the pebbles laid on the ground at home and garden design and in the monitoring of rural areas using pebbles. In addition to these scenarios and also many other cases [Reference Malon, Skokowski and Lopatka21–Reference Balaji, Anitha, Rekha and Arivudainambi23], the anticipated applications of WSN and mobile network is constantly evolving and changing. This reveals the importance of accurate channel features. In coastal, forest, and vegetation areas, the measurement of most of the widely known path loss models is conducted in a temperate climate. However, these models may not be successful in tropical climates due to the high humidity effect. The amount of humidity is an important parameter that changes the dielectric constant and the propagation properties of the electromagnetic wave [Reference Rao, Balachander, Tiwari and Mvsn24]. So, more attenuation is expected in tropical climates than in temperate climates.
There in the studies and standards, one of the 5G frequency bands is the 450 MHz–6 GHz frequency range, which is defined as “below 6 GHz” [Reference Tadesse, Acharya and Sahu25–Reference Genc28]. The 3.5 and 4.2 GHz frequencies, which are widely used in this range of countries, are preferred for this study. The empirical path loss models are developed in small/big pebble environments and air-dry/wet sand environments thanks to experimental observations and the measurements in this research conducted at two discrete frequencies, namely 3.5 and 4.2 GHz for 5G WSN and mobile networks. Additionally, the prediction results of the proposed models are compared with the measurement results conducted at various locations in similar areas. Also, these models are compared with the literature theoretical models such as the two-ray model and log-normal model. This comparison showed that they have common aspects along with accuracy.
The organized paper can be followed as: section “Related work and theoretical background” gives the related studies and background including experimental path loss models obtained in different terrains. The section “Measurement methodology” includes the measurement methodology and test set-up. Also, section “The proposed path loss models and experimental analysis” contains the proposed path loss models and experimental analysis. The section “The comparison of proposed models” mentions the comparison results of the eight different models and the performance of the models based on R 2 and RMSE values. The section “Conclusion” concludes the results, and the future work.
Related work and theoretical background
Related work
Most of the studies focus on three different terrains such as grassy, snowy, and sandy environments. First, O. Olasupo et al. [Reference Olasupo, Otero, Olasupo and Kostanic29] studied radio signal propagation in tall and short grass ground intended to track sports activities. The measurements are performed in different grassy environments where the height of the grass is nearly 3 and 100 cm. The experiments are conducted with ZigBee devices having a 2.6 cm antenna height, 18 dBm transmitter (Tx) power, −102 dBm receiver (Rx) sensitivity, and 1.5 dB antenna gain as Tx and Rx. Additionally, the distance between Tx and Rx is increased from 1 to 12 m in 1 m intervals. Tx and Rx heights are adjusted to 0 cm, 3 cm, 17 cm, and 0.5 m height from the ground, respectively to observe the effect of transceiver height on the path loss model. Furthermore, both vertical and horizontal polarizations are utilized in the experiments. When the results of their model are compared with the measurement results conducted in similar terrains, they indicated that their model gives the mean absolute percentage error (MAPE) of 1.1% and the tracking signal (T s) of 5.6. In a similar case, in [Reference Olasupo, Alsayyari, Otero, Olasupo and Kostanic30], the experimental channel characteristics are studied in different flat terrains such as concrete and asphalt as well as grass in order to environmental surveillance in 2.4 GHz. Two real sensors (XBee ZB S2B device) with a 3 × 3 × 2.4 mm dimension are used as transceivers with omnidirectional antenna polarized as vertical. Tx–Rx distance changes between 1 and 12 m to cover various directions such as 22.5°, 45°, 67.5°, and 90°. Also, their models are compared with two-ray and FSPL models. They observe that the generated model gives a mean squared error (MSE) of 5.4 and root mean square error (RMSE) of 2.3.
Second, another terrain that examines the characteristics of the channels is snowy environments. A sample of studies is focused on the radio signal propagation generating experimental path loss models in snowy environments to track the snow avalanche and also rescue [Reference Cheffena and Mohamed31]. The path models are developed according to the various Tx–Rx heights as 0.5, 1, and 1.5 m, respectively for 2.425 GHz. The measurements are made in various Tx–Rx distance changes from 5 to 30 m with 5 m intervals. In addition, the model is compared with the two-ray and ray-tracing models. They stated that since the link is in the first Fresnel zone for the 0.25 m transceiver height, the path loss is higher than others. However, path loss values for other heights not only decrease also increase depending on Tx–Rx distance due to phase changes in the summation signal consisting of line-of-sight (LOS) and ground reflected ray. For these heights, the statistic values such as F-critical, F-statistic, and P-values higher than 95% are obtained. Furthermore, the regression coefficients (R 2) and deviation (σ) values are calculated for the theoretical models including their model. In a related case, Szajna et al. [Reference Szajna, Athi, Rubeck and Zekavat32] discuss the near-ground propagation in snowy terrain for 2.45 GHz to monitor sporting activities in winter. They are interested in obtaining the correlation coefficients for the indoor as well as snow environment. The distance of the Rx and Tx changes between 6.1 and 79.2 m and the height of the antenna varies within 0–130.8 cm. A signal generator operating up to 2.7 GHz and real-time bandwidth with 20 MHz is utilized. They discovered from the measurement results that the spatial correlation of Rx antennas with 2λ, 4λ, and 6λ. Different antenna heights are used as zero, 86.4, and 130.8 cm. They find that the path loss values are highest when the antenna height is zero. For the other two antenna heights, they point out that while the path loss values are equal up to the location where the Tx–Rx distance is 18.2 m, it is decomposed for the larger distances. In a similar case, the fading characteristics and path loss in flat snowy environments and irregular terrains are studied by Chong and Kim [Reference Chong and Kim33] to increase the performance of the modeling of the sensor networks at 400 MHz and 2.4 GHz. They perform experiments generating a semi-empirical propagation model for the surface level of wireless sensor networks flat and irregular terrains. They also compared the measured values with predicted values procured from the simulation software and high-resolution digital elevation model (DEM) data. Finally, they also discuss the effect of using surface-level irregular terrain (SLIT) instead of sensor networks by the simulation.
Third, apart from the grassy and snowy environments, some researchers have carried out experiments in sandy environments. Alsayyari et al. performed a study of obtaining a semi-empirical path loss model in a sand terrain for WSN deployment at 1.925 GHz [Reference Alsayyari, Kostanic, Otero, Almeer and Rukieh34]. They aim to generate an accurate RF path loss model to the facilitation of the deployment of WSN in the optimization and planning process. They also compare the model with previous results in sparse tree environment and long grass terrain. Moreover, they discuss the difference between the two-ray model, FSPL, and their model. Throughout the measurements, they placed the node in the center of the distribution area. They also recorded the measurements taken by the Rx nodes from eight different distances varying in 5–40 m and there are 16 different angles as separated 22.5 degrees. The height of the antenna polarized as omnidirectional is 20 cm. As a continuation of the work in [Reference Alsayyari, Kostanic, Otero, Almeer and Rukieh34], they also compared their model with five empirical models for concrete, sand, dense/sparse tree, and artificial turf terrain environments to enhance the process of target tracking and localization [Reference Alsayyari and Aldosary35]. They stated that the determination R-square of five models in different terrains vary in 0.9796–0.9929. It is well known that the alpha (α) is the path loss exponent that affects the performance of the model and this value is 2 for the free-space environments. This increases with increased obstructions. They confirmed that the α value for artificial turf, concrete, and sand is 2.75, 3.21, and 3.42, respectively. This shows that the signal on the artificial turf ground has more fading than the concrete terrain. They also discovered that in addition to the fact that the sand land is uneven in nature; the surface of corrugation may explain the value of α (3.33) in sand terrain [Reference Olasupo, Alsayyari, Otero, Olasupo and Kostanic30]. On the other hand, they found that α is 3.33 for the sparse-tree environment. They interpreted that this can happen because the signals coming to Rx come not only from LOS, but also from none-line-of-sight (NLOS), or since weeds block signals reflected on the ground. Additionally, they stated that the signal received from NLOS depends not only on channel objects but also on the signals reflected and scattered from the scrubs/brushes. Finally, for dense tree environments including, they calculated that α with 4.02 that is the highest value in five terrains. Since this environment is considered as a random foliage area consisting of trees, tree trunks, branches, bushes, and leaves, almost all area is NLOS. In such environments, not only reflection but also absorption, multi-scattering, and refraction affect the transmitted signal. Similar to the objectives of these studies on sand lands [Reference Olasupo, Alsayyari, Otero, Olasupo and Kostanic30, Reference Alsayyari, Kostanic, Otero, Almeer and Rukieh34, Reference Alsayyari and Aldosary35], Pozzebon et al. focused on determining the testing and the realization of a WSN in order to remote sense and measure the variations of the sand layer and dunes [Reference Pozzebon, Andreadis, Bertoni and Bove36]. They received the data with the ZigBee protocol by measuring the level changes with a precision of 5 cm. Their proposed frameworks, which are successfully passed various tests in the laboratory, are expected to be used in the study of coastal abrasive processes. In a study which is a continuation of [Reference Pozzebon, Andreadis, Bertoni and Bove36], a model was obtained to perform adequate decisions for the transport to Aeolian sand on the beaches and also coastal dunes by ZigBee protocol with remote sensing [Reference Pozzebon, Cappelli, Mecocci, Bertoni, Sarti and Alquini37]. In addition, the relationship of cause–effect of not only wind but also sand transported is extensively analyzed. Also, the model is verified with similar test regions.
Theoretical background
Generally, it is expressed as in the log-normal model in (1) defined in the first order.

Here, the model of first-order log-normal is PL (d) in dB. When obstacles and various terrain effects are also taken into account, (1) turns into (2) [Reference Olasupo, Otero, Olasupo and Kostanic29, Reference Olasupo, Alsayyari, Otero, Olasupo and Kostanic30].

where the reference distance is d 0 also known as the far-field distance, is set to 1 m. Also, Tx–Rx distance is defined as d in meters. In addition, that takes into account the reference distance; the median path loss is PL (d 0) in dB. That is, in the case of intercept, the slope is 10γ. In this case, the log-normal shadowing and path loss exponent can be stated as Xσ and γ, respectively. Xσ is the random variable of Gaussian having variance σ 2 and zero mean. By measurement data, the standard deviation σ in dB of Xσ can be obtained. σ may be determined with an approach method in (3).

where the sample number is N, the mean path loss predicted is PLp, and the path loss values measured is PLmj. Additionally, R 2 expressed in equation (4), is a parameter that shows the variability between measurement and predicted results via the regression variables of the model.

where the sum of the squares of the proposed model and the sum of the squares of the total are SSmodel and SStotal, respectively. To evaluate the model performances, the errors between the proposed model and reference measurement results can also be expressed with RMSE as seen in (5).

In literature, FSPL model is mostly used for the lower bond estimation which is given in (6).

where d is the distance between Tx and Rx in meters and λ is the wavelength for the measured frequency. However, for the measurements taking account the both the LOS ray and ground reflected ray, ground-reflected (GR) model gives better results rather than the FSPL model.

where ht and hr are the heights of the Tx and Rx antenna, respectively. In cases where GR and FSPL models are not properly working, there is a need to develop the two-ray ground reflection path loss model by using a crossover distance and this two-ray model includes GR and FSPL models in (8).

where dc is the crossover distance and can be calculated according to (9).

The proposed models in this study for both small/big pebble environments and air-dry/wet sand environments are compared with the two-ray and log-normal models to evaluate the performance of models.
Measurement methodology
Measurement location
According to Antalya city with the most beaches to the Mediterranean in Turkey is preferred for the measurement environment. Half of the 600 km long coast consists of beaches with both sand and pebbles. In this study, it should be noted that there are two types of measurements as reference and verification measurements. While the reference measurements are performed to generate empirical path loss models based on bi-term natural logarithmic functions, the verification measurements are conducted to test the applicability of the generated models in similar but different regions. Both reference and verification measurements are performed at different locations in the same environment with similar terrain features in order to increase the accuracy of the measurements conducted in pebbles and sand environments. This also supports the network to make more successful decisions in the coverage planning process. In addition, measurements made at each location are repeated three times and averaged to further increase the accuracy of outdoor measurement.
Measurement set-up
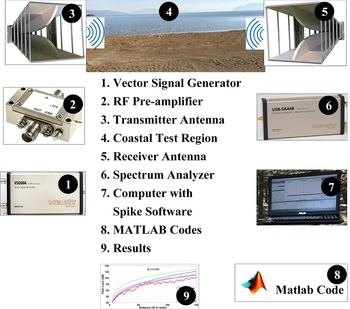
The height of both Tx and Rx is 2 m above the terrain. The closest distance to Tx is 1 m, while the farthest distance is 170 m. Measurement methodology consisting of test set-up utilized is given in Fig. 1. A vector signal generator operating in 50 MHz–6 GHz and Minicircuit RF pre-amplifier (ZVA-183X-S+ model) with 26 dB gain ad 700 MHz–18 GHz operated range are used. The operating frequency range of Tx and Rx antennas is 1–18 GHz, the gain is 11 dBi, and the horizontally polarized A-info LB- 10 180 double ridged horn antennas are Rx and Tx as in [Reference Güneş, Sharipov, Belen and Mahouti38]. The azimuth (E-plane) and elevation (H-plane) of this antenna model are 97–13° and 62–11°, respectively. The spectrum analyzer (Signal Hound USBSA44B model operating in the range of 1 Hz–4.4 GHz) captures signals. The signals are captured by the Spectrum Analyzer (Signal Hound USB-SA44B model operating in the range of 1 Hz–4.4 GHz) having Spike spectrum analyzer software with 30 kHz of bandwidth and stored into a control computer in order to be processed with codes in MATLAB software. While the Tx tripod is held still throughout the measurement, the Rx tripod moves continuously throughout the main loop of Rx. Since the measurement interval is 1 m and Rx levels are recorded for 5 seconds at each measurement point. The loss of RF cables is 5.6 dB. In the measurement data, system calibration is done by removing cable losses and antenna gain. During the measurements, the long-term average outdoor reported humidity is about 54 and dry bulb temperature is 37–39 °C. It should be noted that both the reference and verification measurements are made in the same area with close humidity environments.
Measurement methodology.

The proposed path loss models and experimental analysis
The effects of small and big pebbles on path loss and derivation of the empirical models
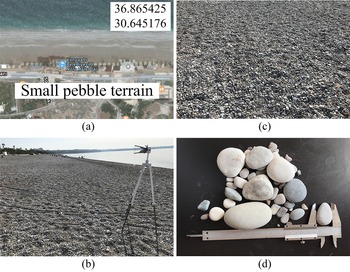
The measurement region with geographic coordinates 36.865425 and 30.645176 where has a small pebbles environment is preferred as in Fig. 2(a). It is clear that there is no obstacle in the antenna main loop in Fig. 2(b) and small pebbles in the environment are clearly given in Fig. 2(c). In addition, the length, width, and height of the small pebbles named pearl pebbles approximately vary in 10–70, 3–25, and 3–40 mm, respectively in this region as in Fig. 2(d).
Measurement campaign in small coastal pebbles: (a) geographic coordinates (b) measurement environment (c) small pebbles (d) sizes of small pebbles.

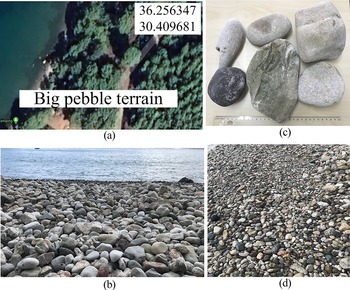
Apart from the small pebbles, the region with geographic coordinates 36.256347 and 30.409681 has big pebbles environment is chosen as shown in Fig. 3(a). The big pebbles have different dimensions as seen in Figs 3(b) and 3(c). Additionally, big pebbles also called pebble stones, have length, width, and height sizes ranging from 120–180, 20–80, and 30–100 mm in the region. It can be noted that the pebble terrain is nearly flat as seen in Fig. 3d.
Measurement campaign in big coastal pebbles: (a) geographic coordinates (b) measurement environment (c) sizes of big pebbles (d) big pebbles.

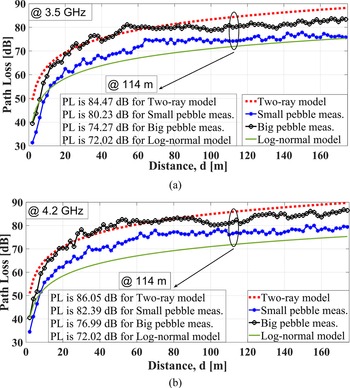
In the two-ray model which is one of the most common path loss models, the signals on the Tx reach the R x both directly with the LOS and by reflecting from the ground. In addition, the characterization of the path loss model changing with the distance resembles a logarithmic function. That is why this change can also be expressed by the log-normal model. It should be noted that htx and hrx are set to 2 m in the two-ray model and n value is 1.18 in the log-normal model, for all scenarios. The results of small and big pebble measurements and other methods at 3.5 and 4.2 GHz are given in Fig. 4. Accordingly, the measurements vary between two-ray and lognormal models. At 114 m, the values of path loss at 3.5 GHz are 84.47, 80.23, 74.27, and 72.02 dB, for the two-ray model, small and big pebble measurements, and log-normal model, respectively as in Fig. 4(a). It is determined that path loss increased with increasing distance in all models. Additionally, for 114 m, the results of path loss at 4.2 GHz are 86.05, 82.39, 76.99, and 72.02 dB, for the two-ray model, small and big pebble measurements, and log-normal model, respectively as in Fig. 4(b). It is also observed that the path loss increases as frequency increases.
Results of small and big pebble measurements and other methods at (a) 3.5 GHz and (b) 4.2 GHz.

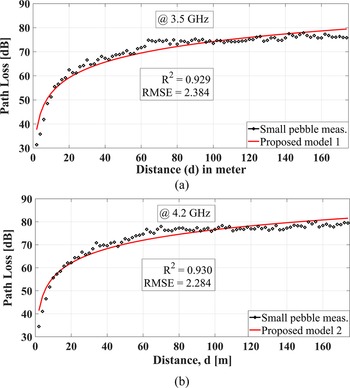
In this study, eight different models are generated depending on the frequency, distance, and four various environments. For each model, the measurements are repeated three times to increase the accuracy of the models and averaged data are utilized to generate the proposed models by using the curl fitting method in the Matlab® program. After generating the proposed model, in order to evaluate the performance of the proposed method, the proposed models and verified measurements are compared for each case. The comparison of the proposed models (models 1 and 2) and verified measurements for the small pebble environments at 3.5 and 4.2 GHz are given in Fig. 5. Accordingly, all values agree with each other. RMSE and R 2 values at 3.5 GHz are 2.837, and 0.929, respectively while RMSE and R 2 values at 4.2 GHz are 2.284, and 0.930, respectively.
Results of small and big pebble measurements and other methods at (a) 3.5 GHz and (b) 4.2 GHz.

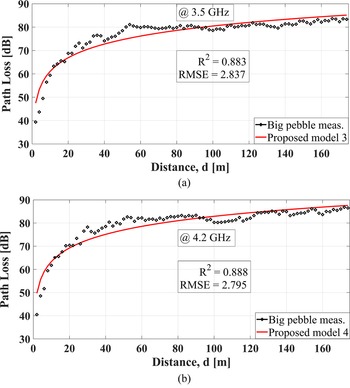
In a similar case, for the big pebble environment, the proposed models are compared with the verification measurements in Fig. 6. As a result, for 3.5 and 4.2 GHz, R-squared values are calculated as 0.883 and 0.888 and RMSE values are obtained as 2.837 and 2.795, which are at acceptable levels for outdoor tests.
Comparison of the proposed models and verified measurements for the big pebble at (a) 3.5 GHz and (b) 4.2 GHz.

Effects of air-dry and wet sands on path loss and derivation of the empirical models
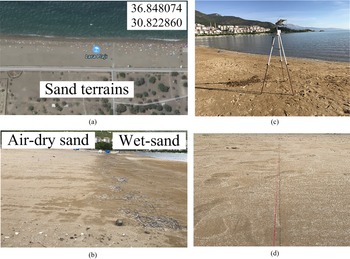
These terrains are different from small and big pebble terrains. The location shown in Fig. 7(a) with coordinates 36.848074 and 30.822860 is the coastal sand environment where some of the measurements were made in this study. Figure 7(b) consists of two types of sand environments. While the area closer to the coastal sea is wet-sand terrain, the further area is air-dry sand terrain. As seen in Fig. 7(c), the distance of the measurement points on the Tx–Rx distance to the coastal sea is almost the same and the measurement direction is nearly parallel to the coastal sea. For this, a red rope up to 170 m is used as in Fig. 7(d).
Measurement campaign in a coastal sand environment: (a) geographic coordinates (b) sand terrains (c) measurement environment (d) Tx–Rx direction.

Beach sands contain different moisture contents (MC) according to the distance to the sea and sand depth. MC has an impact on the behavior of the electromagnetic wave propagated in the environment [Reference Genc, Dogan and Basyigit39]. The relative dielectric constant and electrical conductivity values of sea-water (with salt) and dry sand are 80, 5 S/m and 3–6, 5 × 10⁻⁴ S/m respectively. However, according to these values, the conductivity values of the seawater are much higher than the values of the air-dry sand, so the reflection of the electromagnetic wave is more in the sea-water environment. But, this is not the case in lakes with fresh water instead of the sea-water with salt. Because the relative dielectric constant and electrical conductivity values of drinking water are and 70 × 10−3 S/m, respectively, different from seawater [40].
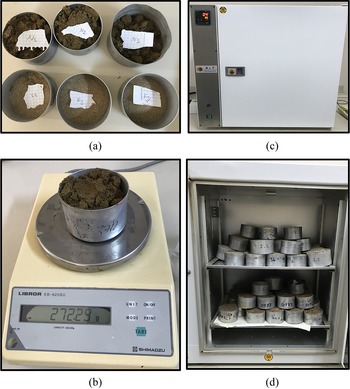
The points aforementioned above are the main motivation to determine the effect of MC on the path loss model in two different sand environments named as air-dry and wet sand terrains. As seen in Fig. 7(b), the air-dry sand terrain, where the MC is expected to be low, is about 50 m far from the sea. On the other hand, the wet sand terrain which contains high MC is nearly 3 m far from the sea. In both air-dry and wet sand environment, three different sand samples are taken from the 50th, 100th and 150th meters, respectively, in the direction of measurements up to 170 m in Fig. 8(a). Then, the weights of all samples are measured with a micro scale called the Libror EB-620SU model before/after drying as in Fig. 8(b). In addition, all samples are fully dried for 48 hours as in Figs 8(c) and 8(d) at 105 °C by an oven with a stainless steel chamber and model of Electro-mag M 6040 P. Since it is found that there is no notable change in the weight of the sand samples after 48 hours, samples can be considered to be completely dried. It should be noted that the drying process of sands is performed based on the standard ASTM D2216 – 19 in [41].
Drying process of samples of air-dry and wet sands: (a) samples (b) microscale (c) oven (d) inside of oven with a stainless-steel chamber.

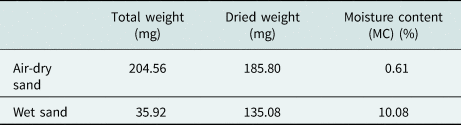
MC values of three samples taken from wet-sand and air-dry sand environments are calculated according to (10) and averaged. The calculated and averaged MC of samples are given in Table 1. Accordingly, MC of wet and air-dry sands are 10.08 and 0.61%, respectively. The MC of the sand sample can be calculated by using (10).

where Tw is the first weight of the samples before drying, and Dw is the last weight of the samples after being completely dried in the oven.
The calculated averaged MC of samples.

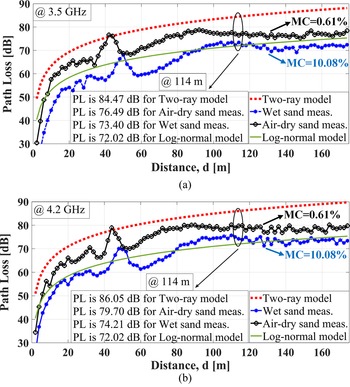
From Fig. 9(a), it is observed that at 114 m, the path loss value for the two-ray model is 84.47 and it is 12.45 dB lower than this value for the log-normal model at 3.5 GHz. Also, for the wetsand (MC = 10.08%) and air-dry sand (MC = 0.61%) terrains, path loss value is measured as 76.49 and 73.40 dB, respectively. On the other hand, in Fig. 9(b), for the 4.2 GHz, literature models are predicted as 86.05 and 72.02 dB at the same distance. In addition, it is 79.40 and 74.21 dB in the wet-sand and air-dry sand terrains. Although the entire plane of the terrain is almost flat, there is a decrease and increase in the slope of the terrain, with a measurement distance of up to 170 m between about 40th m and 55th m. Accordingly, there is an increase and decrease of approximately 10 dB in path loss are observed in the measurement results in the sand environment in this distance range.
Results of wet and air-dry sands measurements and other methods at (a) 3.5 GHz and (b) 4.2 GHz.

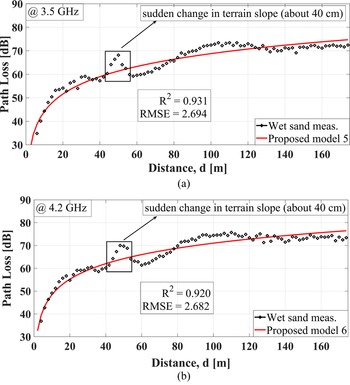
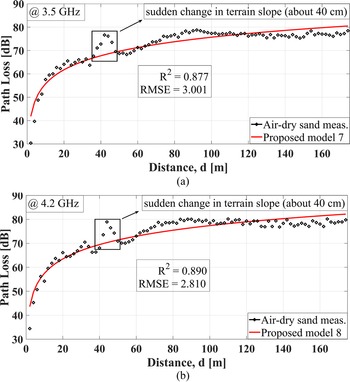
For the wet-sand terrains, first, based on reference measurement data, the proposed models are produced for two different frequencies. Second, the proposed model 1 (for 3.5 GHz) and model 2 (for 4.2 GHz) are compared with the verification measurements. For these frequencies, in Fig. 10, it is found that R 2 is calculated as 0.931 and 0.920, and RMSE is obtained as 2.694 and 2.682. In addition, for air-dry sand terrains, at 3.5 and 4.2 GHz, the R-squared value is 0.877 and 0.890 while the RMSE is 3.001 and 2.810 as seen in Fig. 11.
Comparison of the proposed models and verified measurements for the wet sand at (a) 3.5 GHz and (b) 4.2 GHz.

Comparison of the proposed models and verified measurements for the air-dry sand at (a) 3.5 GHz and (b) 4.2 GHz.

The comparison of proposed models
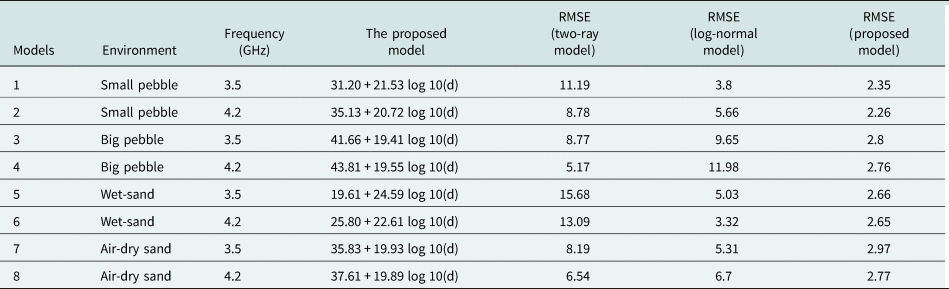
The parameters of proposed path loss models are obtained according to the frequency and distance in Table 2. In addition, to evaluate the performance of eight new path loss models generated, RMSE values of these models are compared with the values of two-ray and log-normal models. Accordingly, this value takes various values in the range of 5.17–13.09 and 3.32–11.98, respectively, for the two-ray and log-normal model, it is in the range of 2.26–2.97 for proposed models. Additionally, in pebble environments, the PL (d 0) as in (2) for model 1, 2, 3, and 4 is 31.20, 35.13, 41.66, and 43.81, respectively. Also, the path loss exponent value n is calculated as 2.15, 2.07, 1.94, and 1.95. On the other hand, for sand environments (for models 5–8), while PL (d 0) is 19.61, 25.80, 35.83, 37.61, the n value is 2.45, 2.26, 1.99, and 1.98. Moreover, at 3.5 GHz, when changing from small pebbles to big pebbles and from wet-sand to air-dry sand environment, the value of n increases by 1.046 and 1.622, respectively.
The parameters of proposed path loss models.

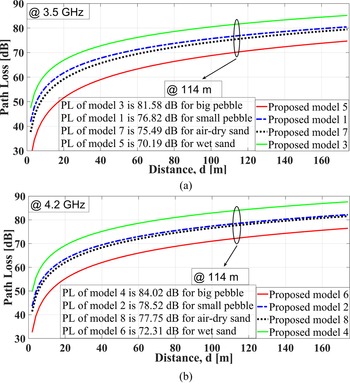
The results of eight different proposed models are compared with each other in Fig. 12. Accordingly, at 114 m, path loss values in big and small pebble environments are 6.09 and 1.33 dB greater than values in the air-dry environment for 3.5 and 4.2 GHz, respectively. This may be due to some electromagnetic behaviors as the scattering effect. For 3.5 and 4.2 GHz, the λ is nearly 86 and 71 mm which are comparable with the dimensions of small and big pebbles in this study. On the other hand, for these frequencies, it is also determined that the path loss value in the wet-sand environment with an average MC of 10.08 is 5.33 and 5.44 dB lower than the path loss value of the air-dry sand environment with an average MC of 0.61, respectively. This is because, the relative dielectric constant and electrical conductivity values of seawater (with salt) and dry sand are 80, 5 S/m and 3–6, 5 × 10⁻⁴ S/m respectively. However, according to these values, the conductivity values of the sea-water are much higher than the values of the air-dry sand, so the reflection of the electromagnetic wave is more in the sea-water environment.
Comparison of the proposed models at (a) 3.5 GHz and (b) 4.2 GHz.

Conclusion
In this research, the empirical path loss models are developed for both small/big pebble and air-dry/wet sand environments at 5G frequencies (3.5 and 4.2 GHz). For small/big pebbles and air-dry/wet sand environments, path loss values are measured and compared with literature models (two-ray and log-normal models) in Figs 4 and 9, respectively. Additionally, eight different models are generated via experimental analysis based reference measurements in Figs 5, 6, 10 and 11 with R 2 and RMSE values ranging from 0.931–0.877 to 2.284–2.837. Also, the proposed models are compared with the literature models and the differences in the results in Fig. 11 are discussed. Accordingly, based on RMSE, values, the parameters of both the empirical model and path loss are compared with similar literature studies, which also indicates a marked difference. The results of the proposed model demonstrate accuracy and common characteristics. This examination may be seen in Table 2. As a result, proposed models have better performance than literature models, with RMSE values ranging from 2.26 to 2.97. In addition, for eight different models, the value of n and PL (d 0) take values ranging from 1.961–4.381 to 19.41–24.59, respectively. Moreover, at 4.2 GHz, when changing from small pebbles to big pebbles and from wet-sand to air-dry sand environment, the value of n increases by 0.868 and 1.181, respectively. In a similar case, at 3.5 GHz, the value of n also increases by 1.046 and 1.622, respectively.
As a continuation of this study, the effects of the pebble environment with various humidity and temperatures on the path loss will be studied in the future by taking a large number of measurements in the period when there is abundant rainfall. Additionally, the effects of dielectric characterization on the radio wave propagation model in various terrains such as not only pebbles and sandy but also snowy, and grassy environments will be examined. Finally, in pebble environments, the results obtained in this study are going to be incorporated into machine learning algorithms to predict path loss values and optimization algorithms to obtain certain propagation parameters.
Acknowledgement
We would like to thank Dr. Bektas COLAK and Company of EMC Electronic for supports.
 Ibrahim Bahadir Basyigit received his B.Sc. degree in electrical and electronics engineering from the Sakarya University in 2005, M.Sc. degree in electrical and electronics engineering from the Akdeniz University, in Antalya, in 2011 and Ph.D. degree in electronics and communication engineering from Süleyman Demirel University in Isparta, in 2016. He has worked in various GSM operators and vendors as a planning and optimization engineer for 2G/3G for 3 years. He has been working as an associate professsor in Distance Learning Vocational School of Department of Computer Programming in Isparta University of Applied Sciences. His current research interests are among electromagnetic compatibility, electromagnetic waves and applications, RF propagation, dielectric measurements, radar-absorbing materials.