Implications
Due to both legislative and market driven initiatives, swine farmers have been asked to transition their sows from individual gestation stalls to group pens. These housing systems introduce increased complexity of environmental and social stimuli. A better understanding of the variation in individual behavior of gestating sows and its consequences can inform pork producers on how best to manage sows at an individual level in group housing.
Introduction
Determining differences in personality traits for livestock may help to identify certain individuals which possess an increased ability to cope with environmental and/or social stressors (Gosling, Reference Gosling2001; Bolhuis et al., Reference Bolhuis, Parmentier, Schouten, Schrama and Wiegant2003). For example, personality differences have been shown to be significantly related to immunity function and stress response (Segerstrom, Reference Segerstrom2000; Koolhaas, Reference Koolhaas2008). Therefore, personality assessment of gestating sows may help in identifying individuals better able to cope with the enhanced environmental and social complexities associated with the transition from stall to group housing. Both legislative initiatives (EU Council Directive 2008/120/EC) and market forces (Matthews and Hemsworth, Reference Matthews and Hemsworth2012) are driving these changes to how sows are managed. Sows have been selected over the last several decades to perform in individual gestation stalls and may not be ideally suited for group housing. There are many potential stressors for group housed gestating sows, such as mixing with unfamiliar conspecifics or competing for access to limited resources such as feed or enrichment (Bench et al., Reference Bench, Rioja-Lang, Hayne and Gonyou2013). While there has been previous research on individual differences in gilts and immature piglets, little to nothing is known about individual differences in the behavior of gestating sows.
Experimental trials, such as restraint, open field and novel object tests, are the predominant method of measuring behavioral differences in swine research. Although principal components analysis (PCA) is frequently used in animal personality research as an unbiased approach to reduce numerous measures into a small set of important summary scores (Budaev, Reference Budaev2010), only a handful of the swine personality research projects utilized this analytical method (Forkman et al., Reference Forkman, Furuhang and Jensen1995; Giroux et al., Reference Giroux, Martineau and Robert2000; Hayne and Gonyou, Reference Hayne and Gonyou2003).
The current study utilized a combination of experimental trials and ethological coding of species-specific behaviors in group-housed gestating sows to attain a comprehensive sample of behavioral responses in a variety of contexts. The objectives of this study were to assess whether these behavioral measurements can be clustered into composite traits using PCA, to assess whether individual trait measurements were consistent across two consecutive pregnancies, and whether there are significant relationships between behavioral traits and measures of welfare and/or productivity.
Material and methods
Animals and housing
At the Swine Teaching and Research Center of the University of Pennsylvania School of Veterinary Medicine, ~130 gestating sows (PIC 1050) were housed in a single large pen as a dynamic group. The 300 m2 pen (~2.4 m2/sow) included nine 2.9×2.2 m concrete lying areas, two 3.6×8.2 m deep bedded straw pits, and a total of 184 m2 of slatted flooring. The sows were fed via two electronic sow feeding stations (Schauer Agrotronic Compident 7, Prambachkirchen, Austria). Every week, 10 pre-implantation sows were mixed into the group, while a corresponding number of sows were removed for farrowing. Sows farrowed in either hinged farrow crates (4.1 m2) or enriched farrowing pens (7.07 m2). The sows were placed into the different farrowing systems at a random schedule throughout their lives. Piglets were weaned following 28 to 35 days of lactation. Fifty sows were initially enrolled in the study with the following parity distribution: parity 2, n=18; parity 3, n=29; parity 4, n=3. Five consecutive weekly breeding groups of 10 sows each were examined over the course of the first 2 weeks of each sow’s gestation period. These observations were repeated on the same animals for two consecutive pregnancies. Four sows (parity 2=1; parity 3=3) were removed from the study due to illness or severe lameness. Tests conducted during the first and second gestation periods are referred to as replicate 1 and replicate 2, respectively. The care and use of the sows was approved by the University of Pennsylvania’s Institutional Animal Care and Use Committee.
Social behavior measurements
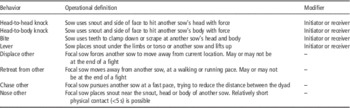
Each sow was followed and filmed by a single researcher via hand-held cameras (Sony HandyCam SX45 Camcorders) for 1 h following introduction to the gestation pen. All researchers maintained a distance of at least 2 m from the focal sows when filming. A 1 h recording period was chosen in order to capture the highest arousal level of the pen. Previous research indicates that dominant pigs engage in fighting more frequently within the first hour of mixing when monitoring social rank negotiation in a 24 h period (Meese and Ewbank, Reference Meese and Ewbank1973). Video data were analyzed using a focal animal behavior sampling method via Noldus The Observer® XT software program. Specific behaviors coded included the frequency per hour of aggressive behaviors (head-to-head and head-to-body knocks, bites and levering) initiated and received, displacement of others, retreating from another, chasing another, and the frequency per hour of nose contacts initiated by focal sow toward another sow in the pen (Table 1). Video data were coded by two observers (Cohen’s κ=0.85).
Ethogram of behaviors coded during introduction to pen

Human approach test
At four and five days post-mixing, the 10 newly introduced sows were examined, one at a time, for response to human presence and touch. The order in which the sows were tested was determined before the data collection period using a randomized computer sequence determined by the Microsoft Excel® program. Human approach tests were performed in the gestation pen, with a constant individual, the primary experimenter, used to test all sows. When necessary, a second experimenter would wake any sow found asleep at the time of the test, by using vocalizations and soft physical contact. This second experimenter was used in order to prevent bias toward the primary experimenter. The primary experimenter then approached the standing sow head on, and stood one arm’s length away (~0.3 m) and counted 15 s. Next, the primary experimenter presented their right palm ~7.5 cm from left side of snout for 5 s. Finally, the experimenter placed their right palm on left side of snout for 5 s. Each sow was given a score based on the behaviors observed. Operational definitions for human approach scale were: 1: Initiates contact to standing near/no avoidance; 2: Tolerant of standing and touch/initiates contact when hand presented; 3: Tolerant of standing and hand proximity/intolerant of touch; 4: Tolerant of standing/intolerant of hand proximity or touch; 5: Complete avoidance/intolerant of standing in proximity.
Ease of handling
One week post mixing, each sow was given a score based on their behavior throughout the process of moving the sow from the gestation pen to an area designated to conduct an open field experiment. The solid concrete walkway was cleared of debris, including urine or feces from previously tested sows, before each test was conducted in order to maintain a standardized path. The operational definitions for the ease of handling scale were: 1: Easy to move, no stopping, pausing, or turning around. No vocal or physical encouragement required to continue locomotion; 2: Walked easily, only hesitating to show interest in surrounding. No vocal or physical encouragement required to continue locomotion; 3: Hesitated but recommenced movement only after human approach and vocal encouragement. No physical encouragement required; 4: Stopped, required physical contact to recommence locomotion. No physical resistance to human contact; 5: Stopped, offered physical resistance to movement on human contact.
Open field test/novel object test
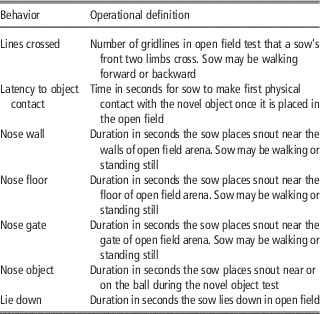
One week following the introduction to the large pen, each sow was observed for behavior responses to an open field and a novel object. An unoccupied portion of the gestation barn, far from the other animals, was sectioned off as the experimental arena. The 2.4×5.2 m concrete floor was separated into a grid of 12 rectangles. Each sow was filmed for 5 min once it entered the grid-lined arena and the gate was closed behind it. Each sow was filmed for 5 additional minutes after the introduction of a blue rubber exercise ball (55 cm diameter). This object was placed in the square furthest from the sow in order to measure the latency to approach an object upon presentation. Video data were subsequently analyzed (Noldus The Observer® XT program) for the number of lines crossed, the latency to make contact with the object, the duration of exploratory behaviors (nosing the wall, floor, gate or ball), and lying down while in the open field arena (Table 2).
Ethogram of behaviors coded during open field and novel object tests

Feed order
The time of day that each sow entered the electronic sow feeding stations (ESF) was recorded automatically by ESF computer software. Each sow was assigned a daily feed order based on the time she entered the feeder, and consumed the majority of her daily feed allotment. A feeding rank value was calculated for each individual sow by averaging her daily feed order between weeks 2 and 4 after introduction to the group. Preliminary studies suggested that feeder order is highly unstable during the 1st week after introduction as sows find their place in the social hierarchy and therefore data from this time period were omitted from the analysis. Due to computer error, feeder order data were not available on seven sows during the second replicate.
Lameness and body condition
Three days following the introduction into the large pen, each sow was examined for lameness, body condition and skin lesions. Lameness scoring was based on the Zinpro Feet First® (Eden Prairie, MN, USA) scale of 0: sow moves easily with little inducement. She is comfortable on all her feet; 1: sow moves relatively easy, but visible signs of lameness are apparent in at least one leg. She is reluctant to bear weight on that leg but still moves easily from site to site in the barn; 2: lameness is involved in one or more limbs. The sow exhibits compensatory behaviors such as dipping her head or arching her back; and 3: there is a real reluctance to walk and bear weight on one or more legs. It is difficult to move her from place to place on the farm (Zinpro, 2012). Body condition scoring was based on the quantity of backfat and prominence of hipbones and spine using the following scale: 1: emaciated; 2: thin; 3: ideal; 4: fat; and 5: overly fat (Coffey et al., Reference Coffey, Parker and Laurent1999).
Lesion scoring
Previous research on aggressive behavior among sows mixed into static pens reports lesion scores are highest 3 days post-mixing (Arey, Reference Arey1999) as well as suggests that lesion scores, especially of the anterior region, could identify which individuals engage in increased fighting frequency, severity or duration (Barnett et al., Reference Barnett, Hemsworth, Cronin, Newman, McCallum and Chilton1992). Lesion scores were assessed via an operationally defined scale measuring quality (A: Thin (<2 mm wide) and shallow; epidermis may be broken with mild surface inflammation; B: Moderately deep cuts (2 to 4 mm wide); epidermal and dermal layers may be broken with moderate inflammation; C: Occurrence of a wide (>4 mm) or deep cuts; dermal layers broken with severe inflammation) and lesion quantity (1:⩽5 cuts; 2: 6 to 10 cuts; 3: 11 to 20 cuts; 4: 21 to 30 cut; 5:>31 cuts). Each sow received a quality and a quantity score for the following body regions: anterior (cranial to the caudal aspect of the shoulder), side (between the caudal shoulder and cranial hip), and, posterior (from the cranial hip caudally). For analysis, each quality score was transformed in to a number (A=1, B=2, C=3) and was multiplied by the quantity score (1 to 5). Therefore, the minimum score for each region was 1, while the maximum score for each region was 15.
Sow productivity
Lifetime productivity measures for individual sows were calculated by summing the respective quantities across all their litters and dividing those sums by the sow’s final recorded parity at the time of analysis. The litter variables quantified were number of liveborn piglets, number of stillborn piglets, number of mummified piglets and the average piglet birth weight (kg).
Statistical analysis
All data were assessed for normal distribution before analysis. Physical measurements and individual trait scores were normally distributed, while behavioral and productivity measurements were not. Physical measurements are presented as mean±standard error, while behavioral and productivity measurements are presented as median and interquartile range (IQR). Paired-samples t-tests were run to assess the significant differences in the physical measurements between the two replicates. Consistency in individual behavioral measurements between the replicates was assessed using Spearman rank-order correlations. Consistency in individual component trait scores was assessed via Pearson’s product-moment correlation. In order to assess the relationship between the component trait scores and individual productivity, Spearman rank-order correlations were calculated among the production measurements and the principle components. Relationships between physical measurements and principle components were assessed via Pearson’s product-moment correlations. All statistical analyses were conducted using SPSS 17.0 (Statistical Package for the Social Sciences) for Windows with a significance level set at P<0.05.
Principle component analysis
The variables with the most significant correlation coefficients for both pregnancies (P<0.05 from Table 3) were retained for principal component analysis (PCA) for each replicate. The factors were rotated using a varimax rotation. This method examines the matrix of correlation coefficients between all measurements and infers components, or factors, that may describe the relationship between data. Behavioral measurements are defined by and clustered based on their loadings to specific principal components using a cutoff of 0.5 or greater. Behaviors that cluster in PCA are suggested to share a common behavioral mechanism (Sih et al., Reference Sih, Bell and Johnson2004; Budaev, Reference Budaev2010). The adequacy of data sampling was assessed via Kaiser–Meyer–Oklin (>0.5) and Barlett’s Test of Sphericity (P<0.01), and the subject-to-variable ratio of 5 to 1 was confirmed before analysis.
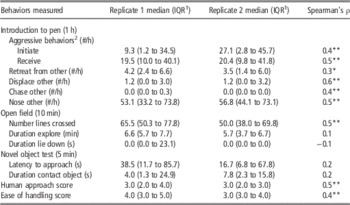
Median (IQR) frequency or duration of behaviors measured in two consecutive parities (replicates)

Temporal consistency of behavior between replicates was assessed using Spearman’s rank-order correlation.
*P<0.05, **P<0.01.
1 IQR=1st quartile – 3rd quartile.
2 Includes head-to-body/head knocks, bites and levering.
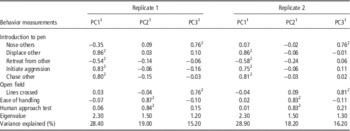
Principle component analysis was run with 46 subjects across eight variables, for both replicates, with KMO=0.6 and Bartlett’s Test of Sphericity reaching statistical significance (P<0.001), and yielded three components with eigenvalues exceeding 1. Taken together these three components explained a total of 62.6% (replicate 1) and 63.3% (replicate 2) of the variance among the behavioral variables (Table 4).
PCA loading scores of behavior measurements on each principle component for both replicates

1 PC1: aggressive/dominant, PC2: avoidant of humans, PC3: active/exploratory.
2 Component loadings ⩾0.5 were considered to have significant weight and were clustered to create composite personality traits.
Component scores
Sows received component scores for the three traits determined from PCA by using the least squares regression approach. Regression factor scores predict the location of each individual on the component. This standardized method produces scores similar to a Z-score metric, where values range from approximately −3.0 to 3.0.
Results
Physical measurements
There was no statistical difference (P>0.05) in the average body condition score between replicate 1 (2.9±0.04) and replicate 2 (2.9±0.05), or in the average lameness score between replicate 1 (1.4±0.07) and replicate 2 (1.3±0.06). Lesions of the anterior and posterior regions were not significantly different (P>0.05) between the replicates. For the anterior region, the average lesion score in the first replicate was 7.8±0.5, while it was 8.5±0.6 for the second replicate. Posterior lesion scores for the first replicate averaged 5.0±0.5 and 6.1±0.6 for the second replicate. However, there was a significant difference (t(45)=2.8, P=0.007) in side lesion scores, with an average of 6.8±0.5 for replicate 1 and 4.9±0.6 for the second replicate.
Repeatability of behavioral responses
Individual frequencies and durations for the majority of variables were significantly correlated (P<0.05) between the two replicates (Table 3). All behaviors related to mixing sows in the group pen as well as number of lines crossed during the open field test, human approach score and ease of handling were significantly correlated between two consecutive pregnancies. Interestingly, a small number of behaviors were not significantly correlated (P>0.05) between replicates; which included the duration of lying down and nosing/exploring in the open field, latency to approach the novel object, and duration of contact with the novel object.
Component scores
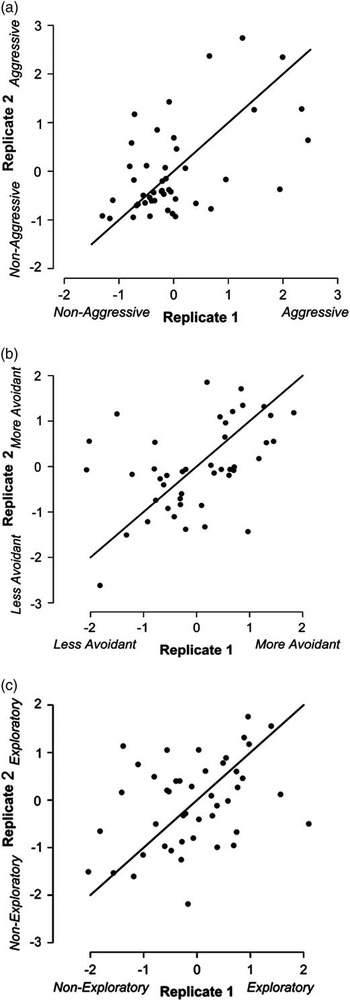
The three components identified by PCA exhibited unique loading profiles (Table 4). The PC1 trait had strong negative loadings (⩾0.4) on the frequency of retreating from others at mixing, while it had positive loadings on the frequency of displacement of another sow (i.e. win fight), initiating aggressive behaviors (i.e. bite, lever, head-body knocks), and chasing another sow. The PC2 trait had high positive loadings on both human approach testing and the ease of handling score. The PC3 trait showed high positive loadings on the number of lines crossed in the open field and the frequency of nose-to-body investigation in the gestation pen at mixing. The three components were labeled based on their loading profiles as PC1-aggressive/dominant, PC2-avoidant of humans and PC3-active/exploratory. Individual sow component scores were significantly correlated between the pregnancies (aggressive/dominant: r=0.7, n=46, P<0.001; avoidant of humans: r=0.45, n=46, P<0.01; active/exploratory: r=0.55, n=46, P<0.001) (Figure 1).
Temporal stability of sow personality traits. Trait component scores for (a) aggressive/dominant, (b) avoidant of humans, (c) active/exploratory from replicate 1 are plotted against scores from replicate 2. Points generally cluster along the unity line demonstrating the behavioral consistency of individual animals between the two gestation periods.

Component scores and physical measurements
There was a significant relationship between aggressive/dominant scores and lesion score severity on the anterior region (replicate 1: r=0.45, n=46, P<0.005, replicate 2: r=0.42, n=46, P<0.005). The more aggressive sows had more severe lesions throughout their anterior region 3 days after being introduced to the group. The aggressive/dominant scores also correlated with feed rank (replicate 1: r s =−0.32, n=46, P<0.05, replicate 2: r s =−0.32, n=39, P<0.05). The aggressive sows entered the ESF station and ate before their less aggressive counterparts. There was also a significantly positive relationship between avoidant of humans scores and lesion score severity on the posterior region (study 1: r=0.42, n=46, P<0.005). Sows which were more avoidant of human proximity and touch, and were more difficult to move down a hallway, had higher severity lesions on their posterior regions.
Sow productivity
Lifetime productivity measures for each study sow were calculated in order to assess relationship between behavior traits and production. At the time of analysis, 33 sows had already been removed from the herd and had a mean parity of 6.1 whereas 13 sows remained in the herd and had a mean parity of 8.2. For all 46 study sows, the lifetime median (IQR) number of liveborn piglets per litter was 11.2 (10.3 to 12.4), the median number of stillborn piglets per litter was 0.8 (0.4 to 1.0), the median number of mummified piglets per litter was 0.1 (0.0 to 0.4), and the median piglet birth weight was 1.4 (1.3 to 1.5) kg.
Component scores and productivity measurements
There were no significant correlations (P>0.05) between individual component scores and the parity of sows at the time of data collection. In both replicates, avoidant of humans component score negatively correlated with the average number of stillborns per litter (replicate 1: r s =−0.36, P<0.05; replicate 2: r s =−0.33, P<0.05). Sows which were highly reactive to human presence had a fewer number of stillborn piglets throughout their lives. No other relationships between productivity measurements and individual behaviors or component traits were found.
Discussion
Experimental trials and ethological coding of behaviors were used to investigate individual differences among group housed gestating sows. Three principal components were determined to account for over 60% of the variation in the data. To our knowledge this is the first description of personality traits in commercial gestating sows housed in large groups. Based on the behavioral measurements which comprise each principle component, these traits were labeled aggressive/dominant, avoidant of humans and active/exploratory. Individual component scores were significantly correlated between replicates demonstrating temporal stability of trait assessment.
Importance of PCA in swine personality research
The results of the present study support previous findings of at least three principal components to explain individual differences in swine (Forkman et al., Reference Forkman, Furuhang and Jensen1995; Giroux et al., Reference Giroux, Martineau and Robert2000; Hayne and Gonyou, Reference Hayne and Gonyou2003). However the definition of these components will be influenced by the type of measurements applied. For example, Forkman et al. (Reference Forkman, Furuhang and Jensen1995) analyzed behavioral responses of 45 piglets to novel objects, open fields, resident–intruder agonistic interactions, restraint tests and extinction learning to assess personality, and they determined three factors (aggression, exploration and sociability) which explained their behavioral variance. Hayne and Gonyou (Reference Hayne and Gonyou2003) combined activity budget data with a series of experimental tests similar to the present study, such as ease of movement, response to human approach and a novel arena/object test, to assess individual differences in nursery piglets before and after regrouping. Their PCA analysis indicated three components (aggression, exploration and avoidant of humans) that explained the variance among the piglets (Hayne and Gonyou, Reference Hayne and Gonyou2003). These comprehensive descriptions of swine personality are contrary to some reports of a dichotomized proactive/reactive coping style in pigs (Hessing et al., Reference Hessing, Hagelso, Van Beek, Wiepkema, Schouten and Krukow1993). The likely reason for this difference is that many studies attempt to categorize piglets based on early stress or restraint tests (e.g. tonic immobility) in an effort to determine behavioral predictors of coping styles or prospective performance and welfare. Despite this effort, previous studies have failed to find a link between non-social (e.g. restraint tests) and social (e.g. resident-intruder test) challenges in pigs (Forkman et al., Reference Forkman, Furuhang and Jensen1995). In contrast, personality studies using PCA evaluates individual differences based on a continuum of many traits, rather than assign a low v. high category.
Personality traits in gestating sows
Principle component analysis has allowed us to identify three behavioral components that are consistent over time and form the basis for an initial description of personality traits in gestating sows. Several aspects of the individual personality traits are discussed here in more detail.
Aggressive/dominant trait
Feed order ranking of ESF systems has previously been shown to be fairly stable and correlated to social dominance; with more aggressive and older sows eating earlier than other sows (Hunter et al., Reference Hunter, Broom, Edwards and Sibly1988; Chapinal et al., Reference Chapinal, Ruiz-de-la-Torre, Cerisuelo, Baucells, Gasa and Manteca2008). The positive correlation between feed rank at 2 to 4 weeks of gestation and aggressive/dominant scores indicates that sows which displaced others more often, and initiated more aggressive behaviors, also ate their daily feed earlier than other sows. The establishment of social rank in a dynamic gestation pen is mediated through both wins and losses of fighting (Arey, Reference Arey1999). The number of aggressive interactions following the mixing of gilts into a new group pen has been shown to be related to the number and severity of lesions found on pigs (Barnett et al., Reference Barnett, Hemsworth, Cronin, Newman, McCallum and Chilton1992). As expected, sows in the current study which received high scores for the aggression trait had more severe lesions throughout their anterior region. This concentration of skin lesions around the neck and shoulders was most likely a result of the predominant head-to-head fighting stance (inverse parallel pressing) (Jensen, Reference Jensen1980). Taken together, our results suggest a role for the personality trait of aggression in the establishment of social hierarchy in gestating sows similar to what previously has been proposed for younger animals (Forkman et al., Reference Forkman, Furuhang and Jensen1995).
Active/exploratory trait
The open field test has previously been used in swine behavioral research as a measurement of both fear (Fraser, Reference Fraser1974) and activity (Forkman et al., Reference Forkman, Furuhang and Jensen1995), and the behavioral variance of this test has been attributed to genetics (Fabrega et al., Reference Fabrega, Diestre, Font, Carrion, Velarde, Ruiz-de-la-Torre and Manteca2004) and rearing conditions (Beattie et al., Reference Beattie, Walker and Sneddon1995). Due to constraints of adequate arena size, this experiment is most often carried out in pigs younger than 12 weeks. For example, Andersen et al. (Reference Andersen, Bøe, Fœrevik, Janczak and Bakken2000) examined which behaviors observed in exploration experiments (i.e. open field test, elevated puzzle maze and light/dark room exploration) are suitable measurements of anxiety or activity in 84 eight-week old piglets. The authors concluded that number of entries into closed arms of the elevated maze, number of lines crossed in the open field and time spent in the lit compartment were the best measurements for assessing the activity trait in young pigs. Similar to previous work on open field testing on younger animals, our results from gestating sows demonstrate that of all variables measured within an open field test, the number of lines crossed explained the majority of behavioral variance in activity levels among gestating sows.
Newly bred sows that are mixed into a dynamic group often engage in both fighting and social exploration in order to find their place in the established hierarchy (Arey, Reference Arey1999). The frequent nose-to-body and nose-to-nose contact observed in swine has been attributed to the use of olfactory cues (i.e. pheromones) to recognize other individuals (Kristensen et al., Reference Kristensen, Jones, Schofield, White and Wathes2001); which is a fundamental element of maintaining a social hierarchy. Social nosing was a key behavior for the active/exploratory trait. The variance in social nosing when mixed into the gestation pen demonstrates that commercial sows do not investigate their social environment all in the same way. These findings highlight how sows can develop different behavioral strategies in pens, and suggest that the care of group-housed sows could be advanced if stockpeople were trained to appreciate such individual differences.
Avoidant of humans trait
Sows which received high avoidant of humans trait scores were more avoidant of humans and showed greater physical resistance to humans upon being moved out of the gestation pen. These sows also had more severe lesions on their posterior regions 3 days after mixing into the pen. It can be suggested that the sows from the current study which expended energy to avoid human proximity and physical contact may have also actively avoided the approach of conspecifics by running away from them, and thus bare their backsides to the heads of potentially aggressive sows. Our findings are supported by Tönepöhl et al. (Reference Tönepöhl, Appel, Voß, von Borstel and Gauly2013) who also investigated behavior and skin lesions in group housed sows. They reported that sows which displayed stronger aggressive reaction toward stockperson when their piglets were handled were scored to have greater lesions on their posterior region when moved to farrowing. To the contrary, Brown et al. (Reference Brown, Dewey, Delange, Mandell, Purslow, Robinson, Squires and Widowski2009) failed to report a significant relationship between approach latency and lesion severity. However in this study pig-initiated human contact, rather than human-initiation, was observed.
The relationship between sow-human interactions and piglet mortality has been studied. Marchant-Forde (Reference Marchant-Forde2002) reported that gilts labeled as ‘shy’ after a human approach test 6 to 8 weeks before parturition were more likely to savage their piglets, while gilts which were labeled ‘bold’ were highly aggressive toward humans rather than piglets. In addition, Lesink et al. (Reference Lesink, Leruste, Le Roux and Bizeray-Filoche2009) reported that a fear response to a human approach was positively correlated to the number of piglets crushed at farrowing. While no relationship was found between pre-weaning mortality and the behavior traits determined in the present study, sows which received high avoidant of human trait scores, had a significantly lower percentage of stillbirths per litter over their lifetime. Hellbrügge et al. (Reference Hellbrügge, Tölle, Bennewitz, Henze, Presuhn and Krieter2008) reported that sows which displayed highly reactive behaviors following separation from their litter, such as nervous activity or aggression toward stockpersons, had fewer stillborn piglets. In contrast, Hemsworth et al. (Reference Hemsworth, Pedersen, Cox, Cronin and Coleman1999) reported that sows which were quicker to withdraw from a human approach had a higher stillbirth rate than those sows which displayed a reduced withdrawal response. Future research on the difference between fear and avoidance of humans, in addition to the approach of a human v. the response to a human’s behavior toward piglets, may shed light on this discrepancy in the literature.
Practical implications for personality traits
This work demonstrates reproducible differences in individual sow behavior on consecutive gestation periods. However, there was limited correlation of the personality traits with welfare or productivity measures. It is possible that there are other behaviors that could be measured that would be better correlated with sow welfare or productivity. Additional studies that integrate different sow behaviors, such as fear response or mothering skills, may be needed to more directly link sow personality to welfare or productivity. Alternatively, it may be that welfare and productivity in the housing system examined here is relatively robust to sows with different personality traits and facilitates the success of animals across the behavioral spectrum. Typically a small number of sows (6 to 10) are waiting at the feeder entrance and competing for access the feed station. Given that feed order is relatively stable (Hunter et al., Reference Hunter, Broom, Edwards and Sibly1988; Chapinal et al., Reference Chapinal, Ruiz-de-la-Torre, Cerisuelo, Baucells, Gasa and Manteca2008) sows are familiar with their waiting partners and likely have an implicit hierarchy in place. Once inside the electronic feeder the sows eat alone and thus this feeding system is characterized as non-competitive feeding (Bench et al., Reference Bench, Rioja-Lang, Hayne and Gonyou2013). The large dynamic group also offers a pen with sufficient space for timid sows to escape or avoid the aggression of more dominant sows. It will be interesting to see which personality traits are determined in other group housing systems (i.e. group size, time of composition, type of feeding system), and whether those traits correlate with sow welfare and productivity. For instance, will the impact of the aggression/dominant trait be more important to success in a small pen or with a competitive feeding system such as floor feeding.
Acknowledgments
The authors would like to that the staff and students of the University of Pennsylvania’s Swine Teaching and Research Center for assistance in data collection. This work was supported by the Pig Improvement Company, New York Farmers, Pennsylvania Pork Producer Council, Pennsylvania Soybean Growers Board and the American Humane Association.