1 Introduction
Countries around the world are reacting to long-term shortfalls in public retirement income programs with a variety of measures. Moving entitlement ages at which people begin to receive benefits is one of these measures. For example, Germany is phasing in an increase from ages 65 to 67 over the years from 2012 to 2029. In the fall of 2010, a French proposal to move the retirement age from 60 to 62 was met with widespread protest. Similar reforms have been contemplated or planned for Spain, Denmark, the UK and elsewhere. In the USA, the Full Retirement Age is in the process of moving from 65 to 67 for those born between 1937 and 1960.
In all countries, concern about movements in the retirement age centers around a worry that those who are not working before the age of entitlement will suffer. The goal of this paper is to address the concern about hardship among those not working at ages before benefit entitlement in the USA. The focal point of the analysis is a calculation of what different income sources contribute to moving individuals over the federal poverty line. I use data from the Health and Retirement Study, which focuses on older workers and the elderly over the time period from 1992 to 2010. These data combine information on the work environment with detailed income and wealth data, facilitating analysis of the years up to benefit entitlement.
There are several findings of interest. Foremost is that four out of five of those with zero earnings in the age 55–66 age range are able to put together incomes to take them over the poverty line. For men, pension and annuity income are quite important, whereas for women spousal income sources play the largest role. Reaching the early retirement age for Social Security benefits at age 62 lowers poverty, even for those who retire early.
The paper is structured as follows. I start by placing this research in the context of existing literature on retirement and the consequences of early retirement. I then briefly describe the system of government income transfers in the USA to furnish the institutional context. This is followed by a description of the data and some measurement issues. With these steps complete, the results are then presented, looking first at the composition of income, then the avoidance of poverty.
2 Related research and background
In this section, I provide background on the determinants of retirement. To begin, I present the age pattern of labor supply for men and women at older ages. I then provide detail on what is known about early retirement, both its determinants and consequences.
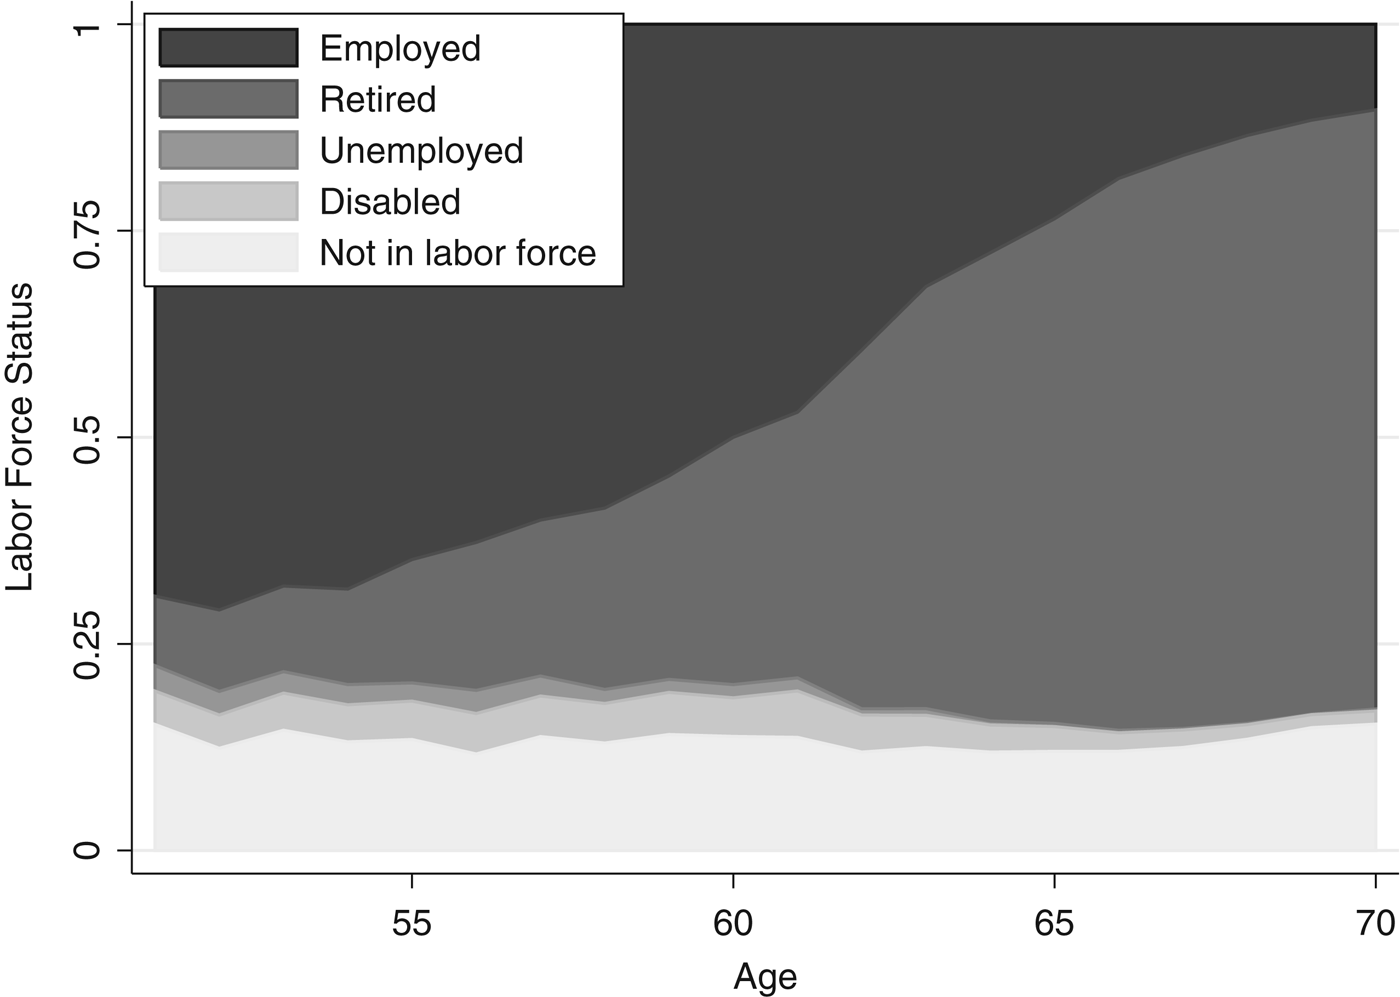
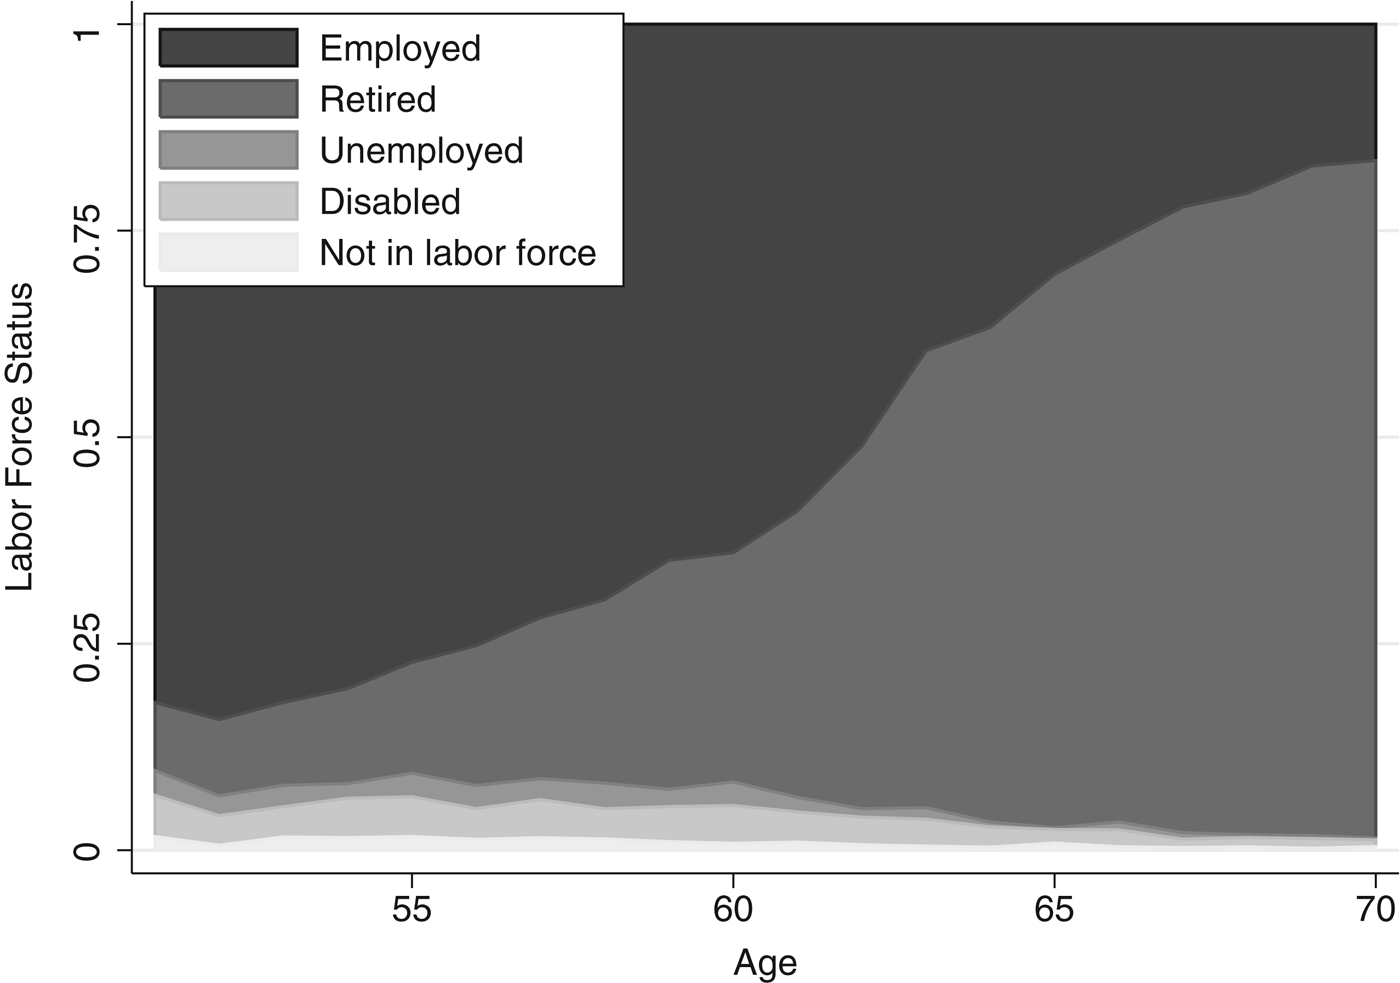
The composition of labor force participation by age for women is presented in Figure 1 for ages 51–70. The sample here comprises everyone, no matter whether they have worked during their life or not. The graph shows the self-reported responses to a question on labor force status in the Health and Retirement Study (HRS) (details on which are provided later in the paper). At age 51, 69% of women are employed and 15% are not in the labor force. Retirement is reported by 8% of the 51-year-old women. At older ages, the proportion reporting being retired grows, rising above 50% at age 63. By age 70, the proportion employed falls to 10%. At all ages, the proportion unemployed or disabled is relatively small. The same data are presented for men in Figure 2. For men, the proportion out of the labor force is much smaller than for women, at fewer than 2% at all ages. For unemployment and disabled, the levels for men are similar to what was seen for women. Employment falls from 82% at age 51–17% at age 70. The large shift from being employed to being retired over the ages from 51 to 70 follows a similar path to women.
Labor force participation by older women.

Labor force participation by older men.
The determinants of retirement have received a great deal of attention. The literature on the determinants of retirement was reviewed in Lumsdaine and Mitchell (Reference Lumsdaine, Mitchell, Ashenfelter and Card1999), who emphasize the importance of institutional factors (Social Security rules, health insurance, employer-pension rules) as well as more fundamental determinants such as health, wealth and preferences for leisure. The role of health is surveyed in Deschryvere (Reference Deschryvere2005), and family-couple interactions are treated in Coile (Reference Coile2004a, Reference Coileb). The effects of institutions and policy on retirement have also been the focus of recent research. Many papers look at the effect of extending the Full Retirement Age from 65 to 67, as legislated in 1983. Blau and Goodstein (Reference Blau and Goodstein2010) find that these changes can explain little of the shifts in retirement patterns in recent years. Mastrobuoni (Reference Mastrobuoni2009), on the other hand does find an effect of the retirement age change using cross-cohort discontinuities generated by the structure of the 1983 reform. Duggan et al. (Reference Duggan, Singleton and Song2007) and Li and Maestas (Reference Li and Maestas2008) look at changes in Social Security Disability Insurance (SSDI) uptake in response to the ongoing change in the Full Retirement Age, finding an increase in SSDI applications driven by the increased Full Retirement Age. Coile et al. (Reference Coile, Diamond, Gruber and Jousten2002) find that not a lot of people delay retirement after reaching age 62, but those with the strongest gain to delay are the most likely to do so. Pingle (Reference Pingle2006) finds some evidence of delayed claiming after the Full Retirement Age, owing to the Delayed Retirement Credit which provides incentives to delay.
Retirement at earlier ages raises a different set of questions than basic leisure and labor choices, out of concern that those leaving the labor force early might be experiencing exaggerated levels of economic hardship (see, for example, Munnell et al., Reference Munnell, Meme, Jivan and Cahill2004). Evidence on this question comes from many sources. Burkhauser et al. (Reference Burkhauser, Couch and Phillips1996) create a profile of the health and income characteristics of those claiming Social Security retirement benefits at age 62 using the first two waves of the Health and Retirement Study. They find that those taking Social Security at 62 are more likely to have an employer pension and are mostly in good health. Li et al. (Reference Li, Hurd and Loughran2008) take another look at this question a decade later with the availability of more data, finding that poor health and lower education are predictors of taking early Social Security.
The consequences of early retirement can be of particular interest. The ‘retirement consumption puzzle’ (see Banks et al., Reference Banks, Blundell and Tanner1998; Hurst, Reference Hurst, Americks and Mitchell2008) has focused economists’ attention on the particulars of the transition from work to retirement. The observed consumption decreases when one hits retirement may indicate that retirement was a ‘surprise’ that hurt wellbeing after retirement. However, Milligan (Reference Milligan2008) and Baker et al. (Reference Baker, Gruber and Milligan2009) find evidence of a divergence between income and consumption based measures of hardship in Canada at near-retirement ages, suggesting that consumption smoothing through the transition may be occurring in spite of temporarily low-income levels before public pension income begins to flow.
Other papers focus on the effect of retirement income on wellbeing and poverty. Engelhardt and Gruber (Reference Engelhardt and Gruber2004) study poverty among the elderly and the role Social Security plays in poverty alleviation. In particular, they implement a measure of relative poverty that compares the incomes of retired people to those who are working. Johnson and Mermin (Reference Johnson and Mermin2009) examine economic hardship during the transition to retirement. The focus in that paper is the effects of employment and health shocks on hardship in the pre-entitlement years. Butrica and Karamcheva (Reference Butrica and Karamcheva2012) look specifically at non-working adults in the age range of 51–61 and characterize their attributes, and how they change over time from 1992 to 2008, finding that some non-workers are struggling with low income and low wealth, while others appear to have accumulated wealth on which to draw.
The work in the present paper is distinguished from Butrica and Karamcheva (Reference Butrica and Karamcheva2012) in two main ways. First, I focus more closely on the age pattern of income receipt over these age ranges, emphasizing how these sources change with age. Second, I provide a unique calculation of how poverty is avoided that sheds more light on precisely which income sources are vital in pulling non-working older Americans out of poverty. A similar analysis for Canada appears in Milligan (forthcoming).
3 Benefit programs for older workers in the USA
When work stops, consumption can be funded from many potential sources of income – spousal income, interest and dividends from saving, employer-provided pensions or government benefits. In this section, I briefly describe the different sources of government benefit income for older Americans. I focus in particular on the ages at which benefit entitlement is earned in order to set up the analysis of income sources by age. The discussion begins with Social Security, and then moves on to unemployment insurance, workers’ compensation and other benefits.
The bulk of government-provided retirement income in the USA comes through Social Security retirement benefits. Complete details on Social Security can be found in Social Security Administration (2013a).Footnote 1 Earnings from the best 35 years are translated into a wage-adjusted average called the Average Indexed Monthly Earnings (AIME). This amount is then pushed through a progressive benefit formula that pays 90% for the first tier of AIME, 32% for the second, and 15% for the rest. The resulting Primary Insurance Amount is the benefit that would be paid if someone retired at the Full Retirement Age. For those retiring earlier, the Primary Insurance Amount is adjusted using an actuarial factor to account for the length of time benefits are expected to be received. The first age at which benefits can be taken is age 62, and the maximum adjustment is 30%. Benefit claiming after the Full Retirement Age (up to age 69) generates entitlement to the Delayed Retirement Credit, currently at 8% per year of delay.Footnote 2 These benefits are partially taxable. Spouses and surviving spouses receive a partial benefit, although spouses entitled to their own retired worker benefit get only the larger of the benefits to which they are entitled, not both. There is also a small death benefit. About 94% of workers are covered by Social Security, with railroad and state and local government employees accounting for most of the uncovered. The average benefit for retired workers as of December 2011 was $1,229 per month.
In addition to retirement benefits, Social Security provides disability insurance (SSDI) to qualifying individuals unable to work. One needs to have worked a certain amount to become eligible, and also the disability must be deemed severe enough to warrant benefits.Footnote 3 At the Full Retirement Age, the SSDI payments are transformed into retirement benefits. Milligan (Reference Milligan and Wise2012) investigates the large upward trends in SSDI usage over the last 30 years. Duggan and Imberman (Reference Duggan, Imberman, Cutler and Wise2009) provide an analysis of this rise in DI, finding it is driven primarily by relaxed disability criteria, but also by increased benefit generosity and population aging. The average payment to disabled workers in December 2011 was $1,111.
The Supplemental Security Income program is available to those without other resources who are age 65 or older, blind or disabled. Full program details are available in Social Security Administration (2013b). Supplemental Security Income benefits are subject to a tight asset test ($2,000 for individuals; $3,000 per couples) and also an income test. The average monthly benefit in January 2013 was $507.
In addition to the above federally administered benefits, there are also several state-administered benefits for which older workers may be eligible. Those who have worked but are now out of a job can be eligible for state-run unemployment insurance schemes. Benefits are typically for a fixed duration, so while they may cover older workers temporarily unemployment insurance will not be a permanent source of income.Footnote 4 Some states have public workers’ compensation, but most states mandate private insurance coverage for employers. The public workers’ compensation programs are integrated into SSDI in the sense that Social Security payments may be adjusted to account for other public payments. See Social Security Administration (2012) for more detail.
4 Empirical approach and data
In this section, I describe some measurement choices taken for the empirical approach that is employed here. I then provide relevant details on the HRS data.
The unit of observation taken for most of the analysis is the individual. This choice derives from the focus discussed in the Introduction. The goal of the paper is to examine the welfare of those who are not working at ages before full public pension entitlement. Working (or not) is an individual concept, so the focus on the individual is natural. The policy concern is how those not working before public pension entitlement are able to survive. The source of income for these non-workers may be from savings, government sources, or other family members (such as a spouse.) To be clear, income from both members of the couple is taken into account in the full analysis, but the starting point is the income and behavior of the individual.
A vexing problem is the definition of retirement. Borland (Reference Borland2005) developed a conceptual framework for defining retirement, whereas Denton and Spencer (Reference Denton and Spencer2009) review the issues that arise in choosing a definition. I guide my choice by the focus of the question posed in the Introduction. The concern is for the wellbeing of those not working during their pre-entitlement years. Whatever the reason for not working, the wellbeing of those not working is the policy concern. Whether they are not working because of unemployment, disability, or because of a choice to retire early, the source of income and wellbeing at these ages is the focus of this analysis. This focus motivates the choice of a zero-earnings definition for retirement for this paper.Footnote 5
The dataset employed in this paper is the HRS. The HRS is a panel dataset that follows older workers from work into retirement. It combines information on labor market activity with questions on incomes health, and wealth, in addition to the normal demographic controls. Five cohort groups are stacked together within the HRS, providing a broader age range across years. I use the processed files for the HRS provided by RAND, version L. The RAND HRS is organized into ten biannual waves, from 1992 to 2010.Footnote 6 I use all of these waves, and always use the provided sample weights.
For most of the analysis, the target range for ages is 55–66, with some special attention paid to those in the subgroups 55–61 and 62–66. Those under 55 are too far from retirement ages to be of interest for the questions posed here. Those over age 66 have reached the Full Retirement Age and are therefore outside the focus. From the raw data, I form the variables used for the analysis. Most variables are taken directly from the coding provided in the RAND L version. I create several aggregations of the provided income variables. The aggregations together sum to the total income measure provided in the raw data; they are mutually exclusive and exhaustive.
The various income categories are defined as follows. Earnings comprise wages, bonuses, tips, overtime and commissions. For non-wage private income, I include capital income (including from a business or self-employment), annuity and employer pension income, and ‘other’ income (includes pension and insurance lump sums, alimony and inheritance; does not include income from friends and family). Government income includes SSDI, Social Security retirement/widow/spouse, unemployment insurance/workers’ compensation, and other government transfers (food stamps, welfare and veterans’ benefits). For capital income and other income, only couple-level income is reported. For these categories, I split the income evenly among married couples.
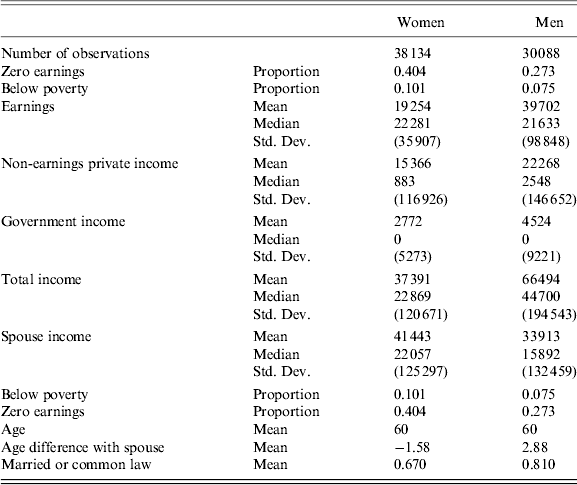
Some descriptive statistics for the sample are provided in Table 1 for women and men, respectively. All dollar values have been transformed to 2010 dollars using the CPI-U. The income measures have both the mean and median reported, along with the standard deviation. For binary variables, I report just the proportion. The sample for Table 1 includes all observations between ages 55 and 64. There are 9,088 women in total in the sample, with 38,134 total observations. For men, the numbers are 7,452 individuals and 30,088 observations.
Descriptive statistics
Note: Data are from HRS. Reported are descriptive statistics of several variables from the sample of women and men between the ages of 55 and 66. The two columns show women and men separately.
Across these ages, 40.4% of the female observations and 27.3% of the male observations show zero income. Poverty rates, however, are much lower, giving a strong indication that many non-workers are able to avoid poverty. For women, 10.1% of the observations have family income below the poverty line, while only 7.5% of male observations do. Mean and median earnings appear low, but it must be remembered that the zero-earners are included here. Non-earnings private income is relatively large at the mean, with $22,258 for men and $15,366 for women. At the median, however, this source of income is much smaller. Government income plays a small role over these ages for most people, with a zero value at the median for both men and women. Spouse income for women is higher than for men, reflecting the larger proportion of wives who have zero income. The average age in this sample is the same, but more men than women are married, reflecting a greater proportion of widows in the female sample.
5 Results
The results are presented in a series of graphs and tables. The description of these results starts with an examination of the evolution of the income distribution and sources over the ages before full benefit entitlement. I then proceed to the accounting of how hardship is avoided.
5.1 Income distribution before age 67
The first question to be addressed is the distribution and composition of incomes in the years before the benefit entitlement age. How do these sources change as the benefit entitlement age approaches? The analysis begins with a quick look at the overall total income distribution, and then proceeds to several graphs exploring the composition of income.
In Figures 3 and 4, I show several moments of the distribution of total income for women and for men. These figures include all observations at these ages; both those with and without earnings. At the median and above, there is a clear downward trend in incomes with age. In a further cut of the data not shown here, it is clear this trend is driven by income drops for those stopping work. For those still working, the income distributions look much more flat with age. At the bottom of the distribution, there is an increase starting at age 62 – the age of Social Security retirement entitlement. The gap between the 10th and 25th percentiles closes noticeably at age 62. For women in Figure 3, the 10th percentile of income increases above zero only at age 62. For men in Figure 4 the increase at age 62 is more subdued, but still present. Combined, the data exhibit a clear compression of the income distribution at older ages as retired higher earners begin living off their lower retirement incomes and those at the bottom of the distribution reach ages of Social Security entitlement.
Distribution of total income for women.
Distribution of total income for men.
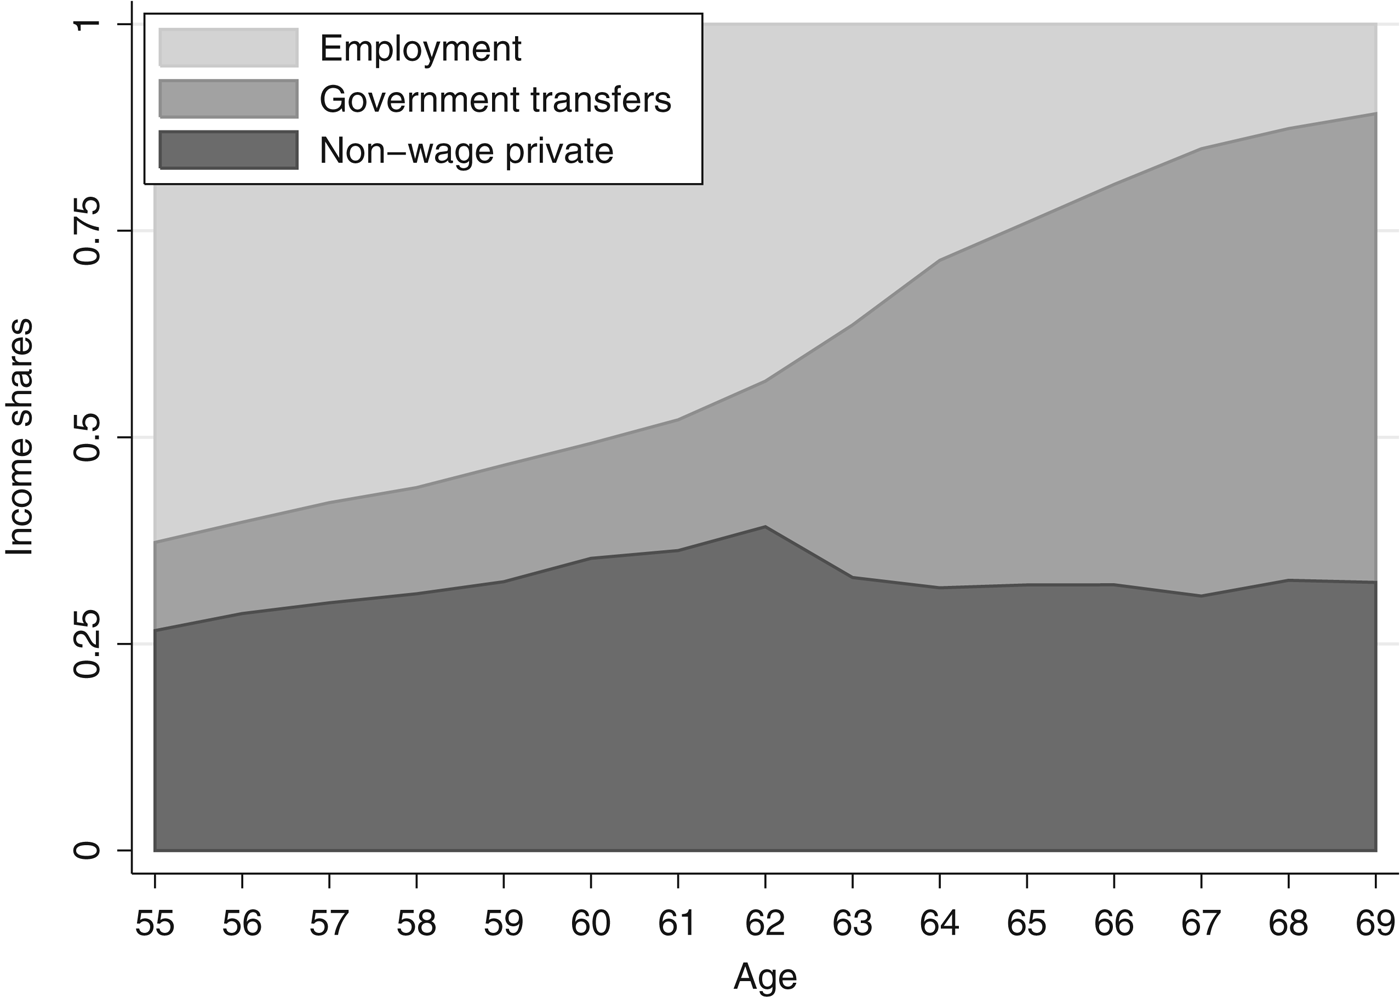
Having looked at the levels of income, I now turn to the composition of income. Figure 5 shows the combined male–female breakdown of individual total income into the three aggregates of income at each age from 55 to 66. Earnings makes up the majority of income until age 62. At age 62, the share of government income starts growing strongly. Non-wage private income sees its share go down after age 62, but not substantially. The next graphs break down the government income and the private non-wage income to understand better the reasons for these patterns.
Income shares.
Figure 6 looks into the sources of government income for women and for men pooled together. The graph shows the proportion of women and men who are in receipt of each of the listed sources of income. SSDI, unemployment insurance, and other government sources are fairly constant. The immediately obvious effect is the widespread receipt of Social Security retirement benefits after age 62.Footnote 7 It is these Social Security retirement benefits that drive the government income share previously seen in Figure 5.
Sources of government income.
The same analysis is repeated for non-wage private income in Figure 7. The incidences for men and women are similar, so they are again pooled together here. Capital income (which includes self-employment income) is received by over 60% of both men and women.Footnote 8 However, the amount of capital income is fairly small for most people. Among men with any capital income, the median is about $2,500 at all the ages in this range, while for women it is about $2,000. The mean for capital income overall is $12,206 and $17,823 among those with any capital income. Comparing these means and medians, it is clear that capital income is quite skewed. Pension and annuity income incidence grow steadily across ages, but even by age 69 fewer than half of the individuals show any income from this source. The amounts of pension and annuity income are quite a bit larger than the other sources at the median. At the median among those with any pension and annuity income, men receive about $20,000 across the ages of concern here, and women about $10,000. The means among those reporting any pension income are only slightly larger than the medians ($15,523 for women and $24,102 for men), indicating less skewness in the distribution of pension income than with capital income.
Sources of non-wage income.
This analysis has revealed three major findings about the distribution and composition of income at ages approaching retirement. First, the income distribution compresses across ages as the retirement of those in the top half of the income distribution lowers their income and those at the bottom see their incomes rise when they reach age 62 and become eligible for Social Security retirement benefits. Second, government income is small in aggregate until age 62, when Social Security retirement benefits take a large and important position in total income. Third, non-wage private income is fairly widely held, but the distribution is skewed. This skewness is strong for capital income, but more muted for pension and annuity income.
5.2 How poverty is avoided
The analysis in the previous section makes clear the important role played by Social Security income after reaching age 62. However, a not insubstantial proportion of Americans is not working at ages earlier than 62. What sources of income are important for these early retirees, and how do non-workers avoid poverty? In this subsection, I examine these questions. First, I show the rates of poverty for those who exit early and those who exit later. I then conduct an accounting exercise to see what sources of income lift the non-working men and women in the sample above the poverty line.
The proportion of respondents living in families under the poverty line is graphed in Figure 8, separately by age of exit from paid work. Men and women are pooled together, and only the data from 2002 are used.Footnote 9 The upper line shows those who exit before age 62, including those who are not working when they are first observed in the data. The lower line shows those who eventually exit between the ages of 62 and 66. Both lines are shown for all ages, including ages both before and after the exit is recorded. Men and women are pooled together here as there was not much difference between them when graphed separately. For those exiting early, poverty rates are much higher, at about 15% until age 62. At age 62, however, the poverty rate begins to shrink. By ages 68 and 69 the difference in poverty between the early and later exiting respondents is about two percentage points. This interesting finding reflects in part the fact that as individuals reach ages of Social Security eligibility, incomes at the bottom end of the distribution grow, which pulls down poverty of the early exit group.
Poverty rates by age of exit from earnings.
To dig deeper into the avoidance of poverty at these ages, I conduct an accounting analysis on those who are not working at ages 55–66. The goal of the accounting exercise is to gain a deeper understanding of how the individuals who are not working are able to avoid living in poverty. The policy concern that motivated the paper was a worry that those retiring before the age when Social Security retirement benefits begin to flow might suffer increased hardship if entitlement ages are raised. The accounting analysis addresses this question directly by showing how poverty is avoided, for those able to do so.
I take each source of income, and several aggregates of these sources, and see how important each source and aggregate is to the avoidance of poverty. In doing so, there are some limitations imposed by the HRS. The HRS provides a measure of each respondent's family income that can be used to compare to the federal poverty line. This adjusted family income is provided only for years starting in 2002, so I perform my accounting exercise only for observations in the 2002–2010 part of my sample. The second limitation is that the income components provided in the RAND HRS do not add up directly to form the income used for federal poverty comparisons. To make this clear, at the bottom of the accounting exercise I compare total income as determined by the sum of the individual income components to the total income provided by the HRS for poverty comparisons.Footnote 10
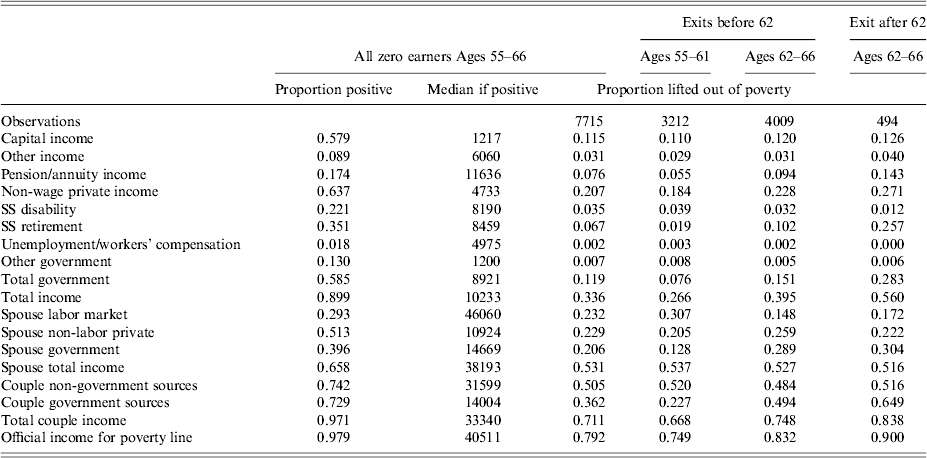
Table 2 presents the accounting analysis for women. Going down the table, I list the income categories and the aggregates. As I reach the bottom of the table, I report the results both for total couple income and for the income level used for the poverty line, as provided by the HRS. The columns of the table show first the proportion of women with a positive value for the income measure, and then the median among those with positive values. The last four columns show the proportion of women for whom each income measure, taken by itself, lifts the family above the poverty line. This is shown for the whole age 55–66 sample, as well as for subsamples determined by age of observed exit.
Proportion of women lifted out of poverty by income source
Data are from the HRS, 2002 onward. Calculations by the author as described in the text. Each row shows a different measure of income. Columns show the proportion of respondents with a positive amount of each income source, the median among those with positive amounts and the proportion lifted above the poverty line by that income source.
I will first focus on the first three columns, which examine all zero earners between the ages of 55 and 66. Capital income assigned to the women is present for 57.9%, but the level at the median is fairly small, at $1,217. Still, 11.5% of women are lifted out of poverty by capital income alone. Other income is not widespread and lifts few above the poverty line. Pension and annuity income are received by 17.4% of women, and on its own this lifts only 7.6% above the poverty line. SSDI and retirement benefits are received by around one-fifth and one-third of women, respectively. However, neither plays a large role in lifting women out of poverty on their own, although retirement benefits do much better after age 62, naturally. Total government income overall lifts only 11.9% out of poverty. Much more important for women are spousal sources of income. Labor earnings, non-labor sources and government income of the husband together lift 53.1% of women over the poverty line, with each of these three components making a substantial contribution. Using the total couple income as reported in the HRS, 71.1% of women without earnings are lifted out of poverty. In the last row, the income measure used for the official poverty line calculations is shown, which shows 79.2% of zero-earning respondents having been lifted out of poverty.
The next three columns of Table 2 break down the sample of zero earners into two groups – those who exit before and after age 62. Those exiting before age 62 can be observed both in the ages 55–61 and ages 62–66 subgroups, while those exiting after age 62 can only be observed in the later age group.Footnote 11 For those exiting before age 62, there are several interesting differences between what happens at the ages of 55–61 and 62–66. While spouse total income carries about 53% of zero-earning women over the poverty line both before and after age 62, the composition of this spousal income shifts sharply from earnings to government sources. In addition, the proportion of women for whom their own Social Security retirement income takes them over the poverty line goes up from 1.9 to 10.2%. Both pension and non-wage private income also see substantial jumps before and after age 62 for the early exiting women. The women who wait until after age 62 to exit show levels of both government and private non-wage income that are stronger than for the early exit women. Overall, fewer of the later-exiting women are in poverty.
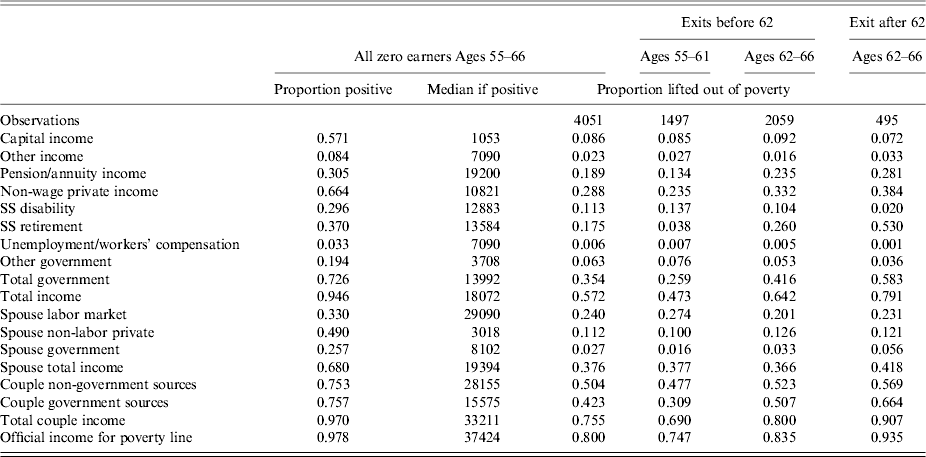
Table 3 repeats the accounting exercise for men. Using the poverty income measure at the bottom of the table, 80% of zero-earning men are able to pull together income sources to get them over the poverty line. Men rely less than women on spousal income sources, but still 37.6% of age 55–66 men are pulled over the poverty line by spousal income alone. As with the women, the source of spousal income switches from labor market earnings to government sources as the men cross over age 62. Pension and annuity income for men are much more important source, pulling 18.9% of zero earning men out of poverty compared to only 7.6% in Table 2. For men who exit before 62, 13.7% are lifted over the poverty line by SSDI alone. This demonstrates the importance of SSDI for men exiting early. In contrast, those not exiting until after age 62 are unlikely to be on SSDI (since SSDI is only available before the Full Retirement Age). Only 2.0% of those exiting after age 62 are lifted out of poverty because of SSDI alone. For the men exiting early, 74.7% of them are under the poverty line before age 62, but the same men do better after age 62 when Social Security retirement benefits become important. Those exiting after age 62 also benefit from stronger Social Security retirement benefits – which are enough to pull 53% of men over the poverty line. Late exiting men show 93.5% pulled out of poverty in the age 62–66 range.
Proportion of men lifted out of hardship by income source
Data are from the HRS, 2002 onward. Calculations by the author as described in the text. Each row shows a different measure of income. Columns show the proportion of respondents with a positive amount of each income source, the median among those with positive amounts and the proportion lifted above the poverty line by that income source.
The analysis of poverty has revealed several important findings. Foremost is that around four out of five of people not working at ages 55–66 are able to avoid poverty through some combination of government and non-wage private income. For women, spousal income is quite important. For men, SSDI benefits are important before age 62, while Social Security and pension and annuity income help significantly after age 62. Those who exit before age 62 seem to experience higher levels of poverty both before and after they begin to receive Social Security, but hitting age 62 improves their income position relative to their standing before hitting entitlement age.
6 Conclusions
This paper has addressed the wellbeing of Americans who are not working during the ages just before entitlement to Social Security retirement benefits. The incomes of those not working at ages 55–66 are interesting in several ways. The income distribution becomes more compressed at older ages. Social Security benefits play a large role for incomes after age 62, whereas pension and annuity income are more important for men than for women. Poverty among those who are not working at ages 55–66 is fairly high, but is mitigated in four out of five cases by some combination of non-wage private income and government benefits. Among those remaining in poverty, Social Security entitlement at age 62 offers some important respite.
This research sheds some light on the potential implications of many current social trends on the ability of future retirees to avoid impoverishment before the ages of government benefit entitlement. For example, intact couplehood is very important, as is having a source of private non-wage income. This suggests that monitoring trends in areas as disparate as the rate of divorce and the prevalence of employer-provided pension will be important to predicting the wellbeing of the near-elderly in years to come.
There are also important policy implications of these findings if the USA were to consider increasing the Earliest Eligibility Age up from its current setting at age 62. For those exiting before age 62, the taper in poverty rates currently observed at age 62 may push upwards along with any Earliest Eligibility Age increase. Also, the sources of income (pensions; spousal earnings) that currently matter mostly for non-workers would have to continue to make strong contributions at older ages if the Earliest Eligibility Age increased. Finally, the relative importance of SSDI for those exiting at earlier ages is a good reminder of the possible interactions and substitutions between programs that would affect overall fiscal consequences if the Earliest Eligibility Age were increased.