Introduction
Inkjet, screen printing, and aerosol jet printing (AJP) offer widely advertised benefits for applications to flexible hybrid electronics. Each of these technologies and the individual materials involved lead to very different advantages and limitations [Reference Wu1, Reference Seifert, Sowade, Roscher, Wiemer, Gessner and Baumann2] but both the effective resistivity and its increase under a moderate strain are invariably higher than for, say, electroplated Cu. Depending very much on the flexible electronics application, the associated reliability concerns are often very different from those that we are used to for conventional electronics, but one concern common to a wide variety of products is fatigue of the conductors [Reference Glushko, Klug, List-Kratochvil and Cordill3, Reference Sim, Won and Lee4]. As for other materials, the response to repeated loading is much more complex than the effects of a monotonically increasing load [Reference Glushko, Klug, List-Kratochvil and Cordill3, Reference Sim, Won and Lee4, Reference Glushko, Cordill, Klug and List-Kratochvil5, Reference Kim, Lee, Yang, Haas, Gruber, Choi, Kraft and Joo6, Reference Kim, Haas, Friederich, Lee, Nam, Binder, Bauer, Choi, Joo and Gruber7]. A comprehensive ongoing study of the combined and often interactive effects of design, process, and materials parameters, ambient exposure, long-term aging, and thermomechanical history aims to identify and characterize the degradation and damage mechanisms with the goal of allowing for optimization and perhaps even prediction of actual reliability under realistic use conditions. The present work is focused on a small part of this, interactions between AJP nano-Ag traces and two common flex substrates.
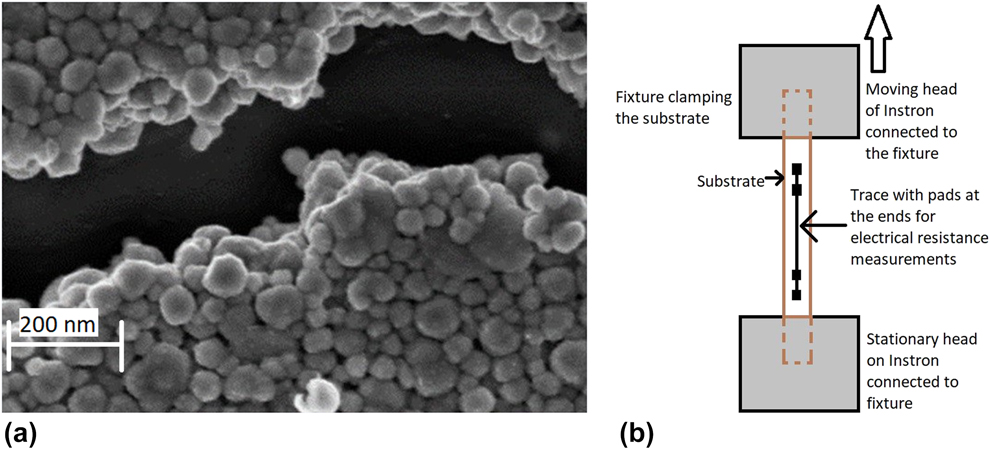
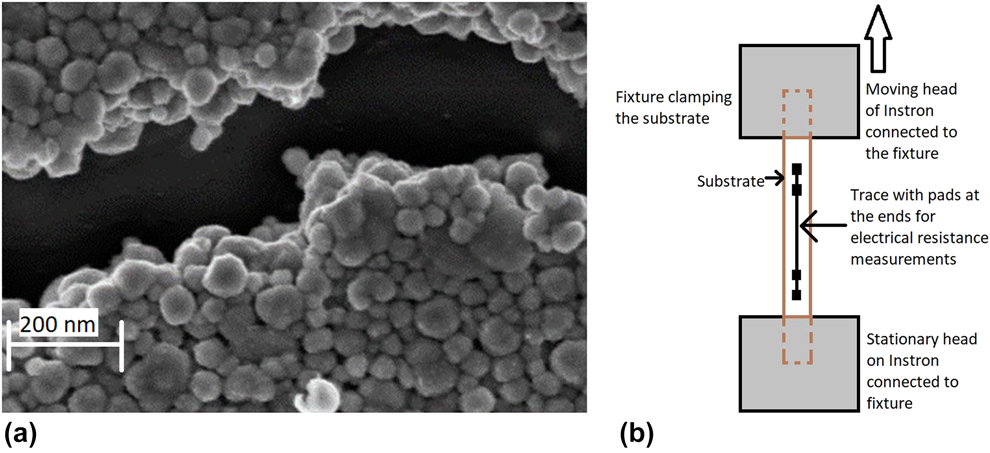
Initial sintering of the printed traces leads to the formation of a highly porous network of fused Ag nanoparticles [Fig. 1(a)]. This is very different from many inkjet or screen-printed traces, in which many of the metal particles are only in pressure contact with each other, held together by a polymer matrix, so that the effective resistivity tends to be significantly higher. However, this also means that in the absence of a substrate, any deformation of an AJP trace would lead to almost immediate localization of the strains at the relatively narrow “bridges” between the particles. Work is ongoing to assess the behavior of the much denser structures achievable with laser sintering, but the present work is focused on thermally sintered structures. The only thing preventing catastrophic failure during mild deformation of one of these is the presence of the substrate. As far as the trace is concerned, if it is thin enough and the substrate modulus or thickness is large enough, the initial response to deformation is a relatively uniform distribution of strain. Even for very rigid substrates, failure still occurs by cracking of individual bridges but almost independently of each other, so that electrical continuity is maintained much longer. The distribution in strength of the bridges leads to a distribution of cracks with strain and with cycle number in cycling, so that overall failure is not as abrupt as for self-supporting brittle materials.
(a) Secondary electron image of nanoporous aerosol jet printed Ag trace with brittle crack. (b) Sketch of experimental setup.
The distribution of cracking as a set of (almost) independent local events means that experimental trends and models for continuous coatings on polymer substrates [Reference ur Rehman, Ahmed, Schmid, Schaufler and Durst8, Reference Chen, Hwang, Chen, Yu and Huang9, Reference Suo and Hutchinson10, Reference Zhang, Chen, Gray, Tirawat and Larsen11] cannot all be counted on to apply either, but some simple general arguments should. Overall, the thinner the trace and the more rigid the substrate, the less the strain on the trace is localized [Reference Li, Huang, Suo, Lacour and Wagner12, Reference Sim, Lee, Lee and Vlassak13]. On the other hand, the application of a given strain to a less compliant substrate tends to put a higher load and thus a higher average strain on the trace. The immediate effects of these counteracting factors under monotonic loading are relatively easy to quantify. The gradual accumulation of damage under repeated loading (cycling) is much more complex.
Actual use of a flexible product will normally involve combinations of loading modes, loading rates, dwells, and perhaps temperatures. Ongoing work addresses the cumulative results of these, but for now, observations of the behavior of traces in tensile cycling with fixed amplitudes and strain rates reveal qualitative trends that are expected to lend themselves well to generalization [Reference Sivasubramony, Adams, Alhendi, Khinda, Kokash, Lombardi, Raj, Thekkut, Weerawarne and Yadav14]. Fatigue damage rates for traces on two common polyimide substrates, Kapton and Upilex, are, for example, seen to be affected not only by differences in the Young’s moduli but also by viscoelastic deformation and the buildup of different viscoelastic strains in the substrates under repeated loading. Also, we find the fatigue life to be greater on the more rigid substrate and to increase faster with decreasing cycling amplitude. Fatigue results for nonporous thin films on polymer substrates are complicated by interactions between a reduction in yield stress and an increase in rigidity with increasing film thickness when the strain range is varied [Reference Sim, Lee, Lee and Vlassak13], but this should not be as much of an issue for the relatively brittle nanoporous traces considered here.
Results and discussion
Except for bending with the trace on the inside relative to the neutral plane, no other simple deformation puts a trace in significant compression. The present effort is focused on tensile cycling between a (often nominally zero) minimum strain and a maximum strain (amplitude) on the flex. This may be worth noting when comparing with results for other structures in reversed amplitude shear cycling, but we do not expect it to matter for a generic comparison below.
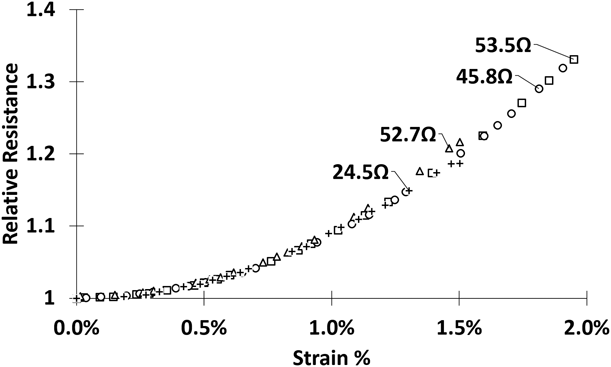
Stretching obviously makes the conductor longer and volume conservation means that sections along the way shrink accordingly. In the absence of porosity, the combined effect on the electrical resistance would be reflected in the well-established scaling with the square of the relative length, (L/L o)2 [Reference Lu, Wang, Suo and Vlassak15]. Sim et al. [Reference Sim, Won and Lee4] found 100 nm thick thermally sintered nano-Ag traces on PET to follow this up to a strain of about 4%, but only to about half that for 380 nm traces. We argue, however, that this cannot be a general trend. For purposes of that discussion, the present structures [Fig. 1(a)] can be viewed as a set of fused particles with narrower bridges between them. To the extent that the strain is allowed to localize in the bridges, volume conservation would lead the resistance to increase faster than (L/L o)2, perhaps considerably faster, but a simple model suggests a variation of the relative resistance with (L/L o)n, where n is approximately constant. In fact, we find an n-value of about 4.5 below 0.5% strain, but this increases to about 20 above 1% strain (Fig. 2). Even if we assume n = 4.5 to represent the effects of stretching on the resistance in the absence of damage, this means that by the time the strain reaches 2% damage must have led to an additional increase of more than 20%. We suggest that this reflects fracture of some of the bridges.
Relative resistance versus engineering strain for AJP traces with different initial resistances on Upilex.

Of course, the picture is actually more complicated because the bridges between the particles are not all lined up in the length direction, leading to a longer effective length of the trace, and even more so because the dimensions of particles and bridges [Fig. 1(a)] are on the order of the electron mean free path [Reference Gall16]. Indeed, we find the resistance of an unloaded trace to vary linearly with temperature between −70 °C and 22 °C, but about a factor of three slower than predicted based on the resistivity of bulk Ag. This suggests that most of the resistance is due to scattering at surfaces, grain boundaries, and dislocation structures [Reference Steinhögl, Schindler, Steinlesberger, Traving and Engelhardt17] and thus unlikely to agree with the predictions of the simple model above. Nevertheless, as shown previously [Reference Sivasubramony, Adams, Alhendi, Khinda, Kokash, Lombardi, Raj, Thekkut, Weerawarne and Yadav14], while the resistance drops again during unloading, it remains considerably higher than during loading, and it increases further during a second loading to the same strain (below).
Reproducibility remains a clear issue for the present samples. The response of a sample to cyclic loading was seen to vary significantly from batch to batch, and within a batch, it varied systematically with the initial resistance. Comparing samples from the same batch with similar initial resistances, their behavior tended to be very reproducible [Reference Sivasubramony, Adams, Alhendi, Khinda, Kokash, Lombardi, Raj, Thekkut, Weerawarne and Yadav14], so great care was taken to identify trends based on comparisons between such traces. However, interestingly, the variations in question all seem to be associated with the evolution of damage in cycling. In contrast, as shown in Fig. 2, the relative response to stretching the first time was very reproducible, not depending at all on the initial resistance. Efforts are ongoing to reconcile this with a simple model of damage initiation.
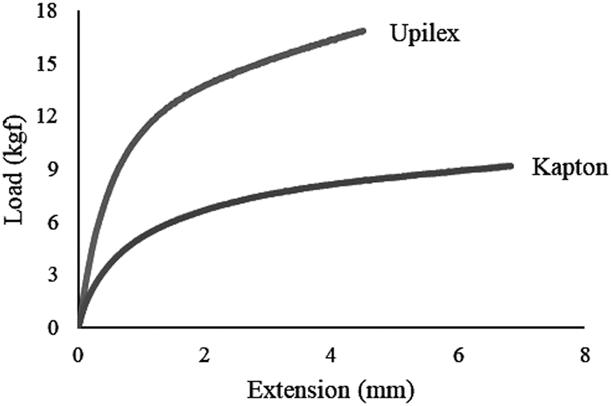
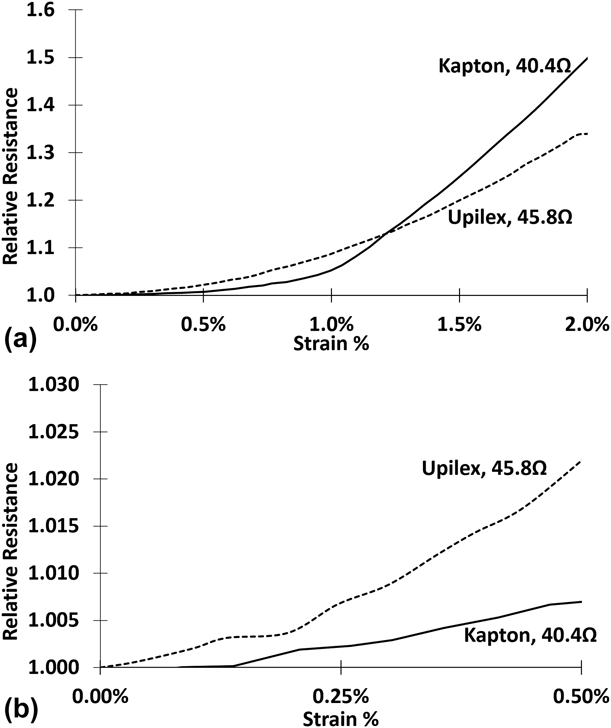
Figure 3 compares the responses of the Kapton and Upilex substrates to loading. Both are far from rigid and although the effective stiffness of the trace is unknown, it seems credible that it may affect the deformation of a near-surface part of the flex to some extent. Overall, the Kapton is considerably more compliant, suggesting that the near-surface part of it will tend to deform to put less of a stress (and thus strain) on the trace for a given overall strain on the substrate. Indeed, Fig. 4(b) shows the initial increase of the resistance of a trace versus the nominal strain on the substrate to be slower on Kapton than on Upilex. In both cases it is, as said, possible that the resistance increase up to a strain of about 0.5% is a result of stretching the narrow bridges between the fused particles. However, above that damage becomes evident and progresses significantly faster on Kapton than on Upilex [Fig. 4(a)]. We suggest that this is a result of greater strain localization on Kapton, the greater compliance of the substrate allowing cracking of a bridge between two particles to affect neighboring bridges more.
Load versus displacement on Kapton and Upilex substrates in tension.

(a) Relative resistance versus engineering strain on Kapton and Upilex substrates in first tensile loading. (b) Zoomed in curves for lower strain.

Glushko et al. [Reference Glushko, Kraker and Cordill18] simulated the effects of cracks on the resistance of a thin (nonporous) trace by finite element modeling and developed an empirical fit to the variation of the relative (effective) resistivity:
 $${\rho \over {{\rho _{\rm{o}}}}} = 1 + x + {x^2}\quad ,$$
 $$x = {1 \over {\sqrt 2 }}{C_{\rm{a}}}{l_{\rm{o}}}^2\quad ,$$
where l o is the crack length (perpendicular to the current direction and much smaller than the trace width) and C a is the areal density of the cracks. Simulations were only done for through-thickness cracks in a very thin film, but symmetry suggests that lengths in the width and the thickness direction must have the same effect. As expected, a longer (localized) crack must have a much stronger effect than several shorter cracks with the same total length (height). To use Eq. (1), we must first convert the resistance to resistivity, i.e., divide out effects of stretching without damage. If we treat our trace as a stack of separate layers and approximate that effect by an (L/L o)4.5 dependence, as discussed above, we can convert the Upilex curve in Fig. 4 to relative resistivity versus strain. Then, the assumption of Eq. (1) would lead to x-values on the order of 1% already before reaching a nominal strain of 0.7%, or an average spacing of 10 crack lengths between cracks in either direction. At 2% strain, the average spacing would be on the order of 2 crack lengths. Of course, the empirical fit in Eq. (1) did not extend to such high crack densities and/or lengths. More importantly, the results of Glushko et al. are nondimensional, ignoring any effects of crack spacings approaching the electron mean free path. Still, there is little doubt that some degree of strain localization must occur on Upilex as well. Nevertheless, even high-resolution secondary electron microscopy did not reveal any cracks.
As we shall see next a greater strain localization on Kapton is also consistent with a faster accumulation of damage in repeated loading (cycling). Still, even cycling to a much higher increase in resistance (Fig. 5) did not lead to identifiable cracks. It is of course possible that larger cracks may tend to form first at the interface with the flex, where the stresses are certain to be highest and thus not be visible from the surface. Ongoing work suggests that this depends not only on the resistance increase but also on the cycling parameters, apparently reflecting differences in the nature of the damage. The present work is, as said, focused on the non-visible fatigue damage.
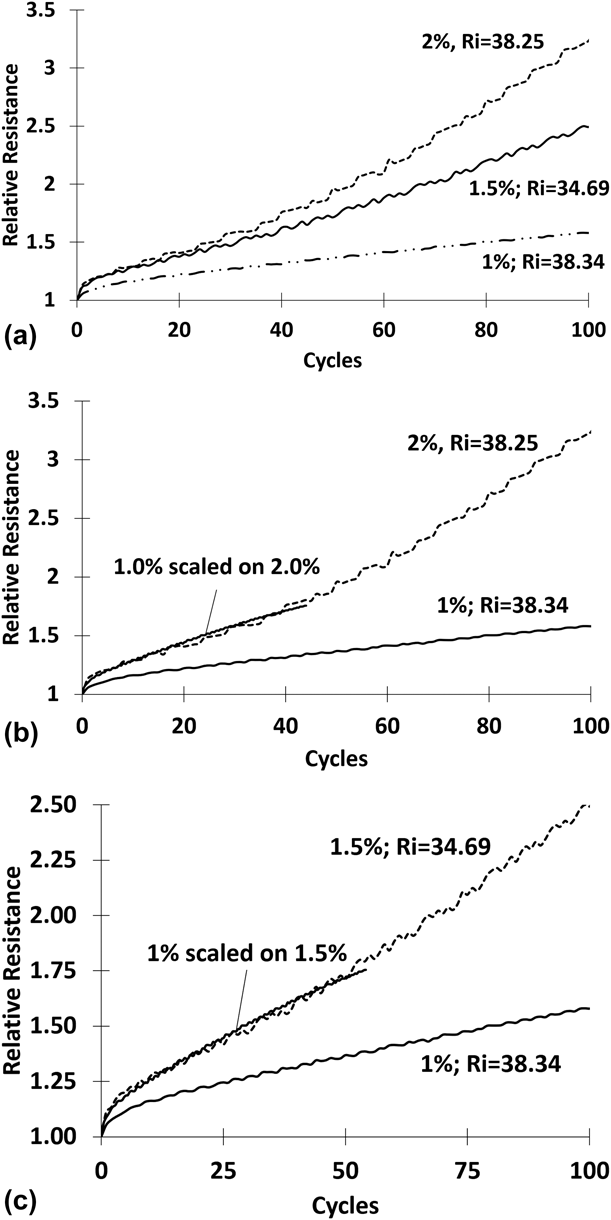
(a) Relative resistance of AJP nano-Ag traces of comparable initial resistances on Kapton versus number of tensile cycles—Comparison of strain amplitudes of 1, 1.5, and 2%. (b) Results for 1 and 2% amplitude together with the former scaled by dividing the number of cycles by 3.4. (c) Results for 1 and 1.5% amplitude together with the former scaled by dividing the number of cycles by 2.75.

Separate studies on fused but self-supporting structures of nano-Cu [Reference Kokash, Sivasubramony, Cuevas, Zamudio, Borgesen, Zinn, Stoltenberg, Chang, Tseng and Blass19, Reference Hamasha, Sharma, Schnabl, Cheng, Desir, Bretz, Wentlent, Zinn, Beddow and Schnabl20] have shown the bridges between the particles in those to start out with very high concentrations of dislocations. These concentrations were then strongly reduced in subsequent annealing. However, even after 20 h at 230 °C fracture surfaces of the nano-Cu structures in both reversed amplitude cycling and in unidirectional shear remained brittle. We find the same to be true for our nano-Ag, which was only sintered for 1 h at 200 °C. Figure 1(a) shows seemingly brittle fracture in a case of much more severe deformation than otherwise used in the present work. This is common for printed Ag nanoparticles [Reference Glushko, Klug, List-Kratochvil and Cordill3].
The isothermal fatigue life of different generations of the self-supporting nano-Cu structures in reversed amplitude cycling was repeatedly found to vary with the cycling amplitude to a power of 15 [Reference Glushko, Kraker and Cordill18, Reference Kokash, Sivasubramony, Cuevas, Zamudio, Borgesen, Zinn, Stoltenberg, Chang, Tseng and Blass19, Reference Hamasha, Sharma, Schnabl, Cheng, Desir, Bretz, Wentlent, Zinn, Beddow and Schnabl20, Reference Schnabl, Wentlent, Mootoo, Khasawneh, Zinn, Beddow, Hauptfleisch, Blass and Borgesen21], which is typical of brittle damage. However, we showed the life of AJP nano-Ag traces on Upilex in tensile cycling to vary slower than the amplitude to a power of 5 [Reference Sivasubramony, Adams, Alhendi, Khinda, Kokash, Lombardi, Raj, Thekkut, Weerawarne and Yadav14] and failure was gradual rather than abrupt, i.e., the macroscopic behavior of the traces appeared ductile. Notably, this did not reflect a power dependence on the amplitude. Rather, the rate of damage increased by a factor of 7× when the amplitude was increased from 1 to 1.5%, but only by 10×, when it was raised from 1 to 2% [Reference Sivasubramony, Adams, Alhendi, Khinda, Kokash, Lombardi, Raj, Thekkut, Weerawarne and Yadav14].
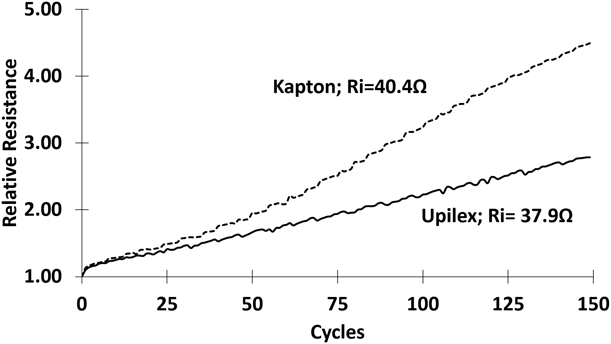
Like in our earlier work [Reference Sivasubramony, Adams, Alhendi, Khinda, Kokash, Lombardi, Raj, Thekkut, Weerawarne and Yadav14], we quantify the damage versus number of cycles in terms of the resistance measured at a strain of 0.5% during the loading part of each cycle. As explained above, this ensures that we know the actual strain on the trace, except for an additional local relaxation of the interface region. Figure 5(a) shows the evolution of the resistance of comparable AJP traces on Kapton versus number of cycles with strain amplitudes of 1, 1.5, and 2%. Figure 5(b) shows how the 1% curve can be scaled onto the 2% curve by dividing the number of cycles by a factor of 3.4, i.e., the rate of damage per cycle is 3.4× greater in cycling to 2% than in cycling to 1%. Figure 5(c) shows a similar scaling with a factor of 2.75 from 1 to 1.5%. The overall trend was similar on Upilex, except that the rate of damage increased significantly faster with amplitude than on Upilex [Reference Sivasubramony, Adams, Alhendi, Khinda, Kokash, Lombardi, Raj, Thekkut, Weerawarne and Yadav14]. Nevertheless, the rate is still 1.5× higher on Kapton for a strain amplitude of 2% (Fig. 6), suggesting that low cycle fatigue will remain slower on Upilex at most practically relevant amplitudes and that the difference will increase toward lower amplitudes (longer life).
Relative resistance on Kapton and Upilex versus number of tensile cycles with strain amplitude 2%.

Unlike the damage induced by the initial stretching, which is affected by the modulus and associated viscoelastic compliance of the substrate as discussed above, further accumulation of damage in cycling is also sensitive to one more aspect of the substrate deformation. Unloading after the experiment leading to Fig. 3, the load was seen to reach zero before the nominal extension did, i.e., the substrates remained longer than their original length as the nominal extension was further reduced. A major part of this viscoelastic strain did relax slowly over a period of hours [Reference Sivasubramony, Adams, Alhendi, Khinda, Kokash, Lombardi, Raj, Thekkut, Weerawarne and Yadav14], but in the absence of a significant dwell without load, this means that we are only cycling the trace between a non-zero strain and the selected amplitude.
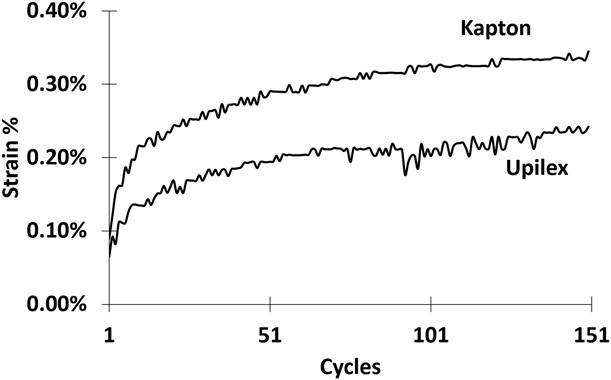
Figure 7 shows the viscoelastic strain after each cycle for an amplitude of 2%. The strain remaining after a given cycle is almost twice as high on Kapton as on Upilex, i.e., a trace on Kapton remains at a higher strain than one on Upilex during part of the same (nominal) cycle. However, this does not contribute to the faster damage on the Kapton, quite on the contrary.
Viscoelastic strain at zero load on Kapton and Upilex substrates versus number of tensile cycles to 2% strain.

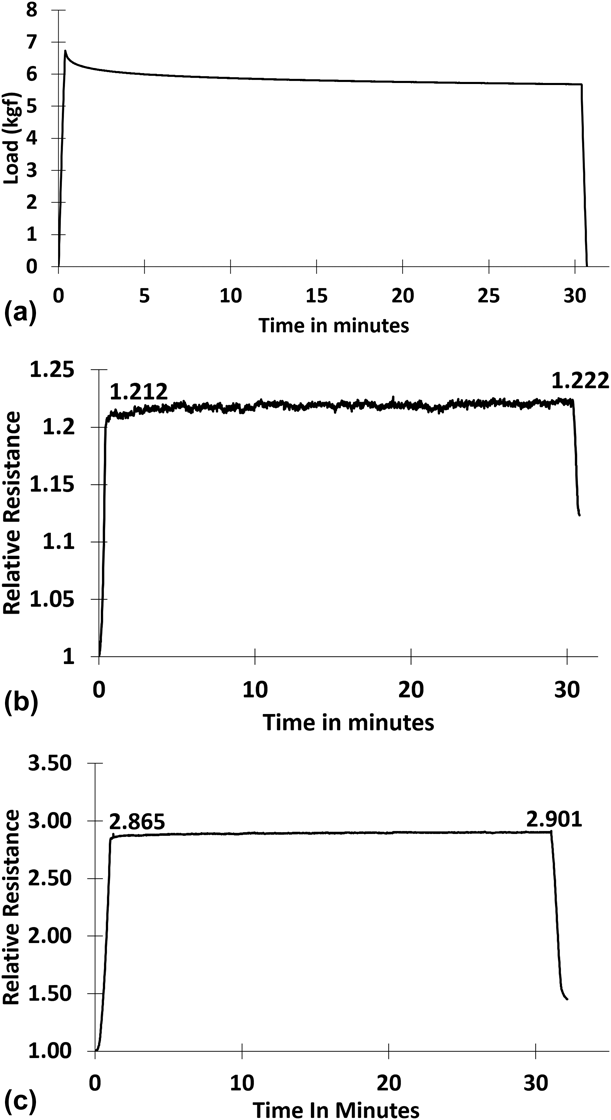
Figure 8(a) shows the load versus time on a Upilex substrate held at a nominal strain of 2%. Indeed, as shown in Fig. 8(b), the resistance increases, although only by 0.65%. This may not seem significant but holding one at a nominal strain of 5% instead the resistance increase is about twice as high [Fig. 8(c)]. Still, the rate of damage is extremely low during any hold even at strains much higher than the viscoelastic strains in Fig. 7.
(a) Load versus time on Upilex substrate for strain raised to and held at 2%. (b) Resistance of trace on substrate for load history in (a). (c) Resistance versus time of trace on Upilex substrate for strain raised to and held at 5%.

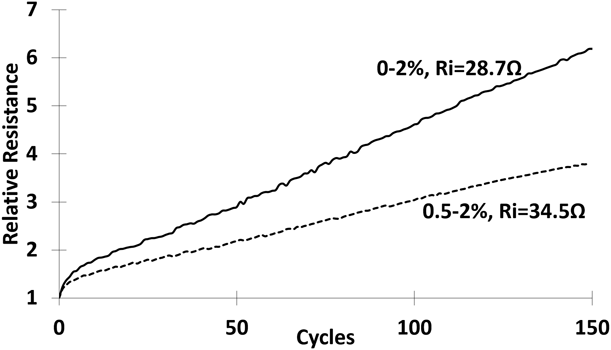
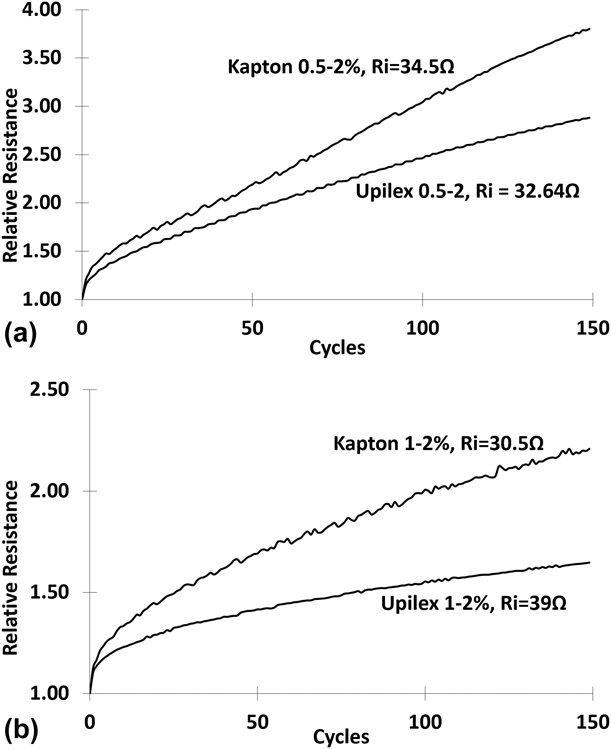
This does not mean that the viscoelastic strain on the substrate does not have a significant effect. In fact, a higher minimum strain on the trace is seen to lead to a strong reduction in damage rate. Figure 9 compares traces on Kapton in cycling to an amplitude of 2% from a strain of 0.5% and from a nominal strain of 0%. The latter trace had a lower initial resistance, so everything else equal the rate of increase in the relative resistance should be too. However, the 0.5–2% cycling is seen to reduce the damage rate by 2× compared with cycling from a viscoelastic strain that varies from about 0.1% to over 0.3% (Fig. 7). Considering this, it is not surprising that cycling from 1 to 2% [Fig. 10(a)] reduces the rate of damage by another 3× compared with the 0.5–2% cycling.
Resistance of AJP traces on Kapton versus number of (nominal) 0–2% and 0.5–2% cycles.

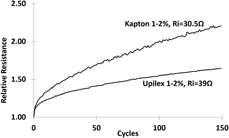
(a) Resistance of AJP traces on Kapton and Upilex versus number of cycles from 0.5 to 2% strain. (b) Resistance of AJP traces on Kapton and Upilex versus number cycles from 1.0 to 2% strain.

Consistently with the other observed trends raising the minimum strain had less of an effect on traces on Upilex. Like in 0–2% cycling (Fig. 6), the rate of damage remains 1.5× as high for traces on Kapton in 0.5–2% cycling [Fig. 10(a)], although this raised the minimum strain on traces on Upilex more, and in 1–2% cycling, the rate of damage was 3× higher on Kapton than on Upilex [Fig. 10(b)].
Overall, the substrate properties are seen to affect the tensile fatigue behavior of the AJP traces in systematic but nontrivial ways. We suggest that this is a result of counteracting effects of substrate compliance on the overall load on the trace and on the localization of strains near cracks. As the nominal strain on the substrate increases, the rate of increase in the load on the trace is increasingly reduced by ever stronger viscoelastic relaxation of the interface, an effect that is more pronounced on Kapton (Fig. 3). This explains the stronger variation in damage rate with maximum nominal strain and the weaker relative effect of the minimum substrate strain on Upilex.
An additional factor may in principle be differences in adhesion to the different surfaces. However, a simple tape test showed adhesion to be very good on both surfaces even after cycling.
Summary
Sintering/fusing of aerosol jet printed nano-Ag traces leads to nanoporous structures that could not survive even moderate deformation without the presence of a substrate to counteract strain localization. Common polyimide substrates lead to a general fatigue behavior typical of ductile metals, such as damage rates that vary slower than the cycling amplitude to a power of 5 or 6, but the Coffin–Manson relationship does not apply. A more compliant substrate tends to stress the trace less when subject to a given deformation, but a more rigid substrate will reduce strain localization near individual cracks in the trace more. Overall, the fatigue behavior will depend on these counteracting effects and thus on the combination of substrate modulus and viscoelastic deformation properties.
Cycling to a given strain amplitude on the substrate leaves a higher viscoelastic strain remaining in between cycles for Kapton than for Upilex, reducing the rate of damage per cycle more. In addition, greater viscoelastic relaxation of the interface leaves lower stresses on the trace at any nominal strain, also reducing the rate of damage. The latter also means that the rate of damage varies faster with the maximum strain and slower with the minimum strain in the cycle on Upilex. Nevertheless, Upilex reduces strain localization at individual cracks, once they form, more leading to lower rates of damage for all strain ranges considered.
Methodology
An Optomec AJ-300 Aerosol Jet Printer (Optomec/Huffman, Clover, South Carolina) was used to deposit 60 mm long, 80 μm wide, and approximately 5 μm thick traces of Paru PG-007 ink onto 50 μm thick Kapton and Ube UPILEX-50S substrates using a pneumatic atomizer and a 200 μm nozzle. Traces were printed in two passes at a speed of 8 mm/s. Otherwise, printing process parameters were as described and discussed in detail elsewhere [Reference Salary, Lombardi, Tootooni, Donovan, Rao, Borgesen and Poliks22, Reference Salary, Lombardi, Rao and Poliks23]. The boiling point of the solvent is 120 °C. The ink is often sintered at relatively low temperatures, for reasons such as protection of the substrate, which may not completely remove all organic stabilizers by decomposition, but this is still believed to be enough to allow for significant fusing of the Ag particles [Reference Wünscher, Abbel, Perelaer and Schubert24, Reference Ingham, Lim, Dotzler, Henning, Toney and Tilley25, Reference Volkman, Yin, Bakhishev, Puntambekar, Subramanian and Toney26]. The supplier of the Paru PG-007 ink offers several sintering options. We chose the highest temperature and longest time, sintering the traces at 200 °C in air in a convection oven for an hour [Reference Salary, Lombardi, Tootooni, Donovan, Rao, Borgesen and Poliks22, Reference Salary, Lombardi, Rao and Poliks23].
120 mm × 10 mm pieces of flex with a trace in the middle [Reference Sivasubramony, Adams, Alhendi, Khinda, Kokash, Lombardi, Raj, Thekkut, Weerawarne and Yadav14] were pressure gripped in an Instron 3344 (Instron, Norwood, Massachusetts) Single Column Load Frame mechanical testing machine with 2 kN load capacity. Stretching such a sample in the length direction [Fig. 1(b)] increased the load ever faster with displacement until the flex was tight at a load of approximately 50 g in the present experiment. After that, the load increased slightly slower than linearly with displacement as the flex was stretched and the inflection point (50 g) was defined as zero (nominal) strain. Samples were cycled from there up to a fixed tensile strain and back. In this configuration, the strain on the trace obviously varies with the location but keeping it in the middle and thus more than 60× its width from the edge of the flex while ignoring any effects of the much thinner trace on the deformation the strains on the trace were implicitly assumed to be the same as the nominal strains on the flex. We emphasize that the conclusions of the present work all rely only on comparisons, not absolute values. It is evident from Fig. 1(a) that anything but a fatal or near-fatal crack is at best exceedingly difficult to observe and being focused on much earlier stages we chose to quantify damage in terms of electrical resistance increase. As discussed below, even this means that dense distributions of significant cracks are involved. Cu leads were attached to the traces in a 4-point probe configuration near the ends of the trace and resistances measured in situ during cycling [Reference Sivasubramony, Adams, Alhendi, Khinda, Kokash, Lombardi, Raj, Thekkut, Weerawarne and Yadav14].
The buildup of a viscoelastic strain in the flex means that the strain on the trace does not actually return to zero in between tensile cycles. The strain did, however, never exceed 0.5% in the present experiment. The evolution of damage versus number of cycles was therefore quantified in terms of the measured resistance at a nominal strain of 0.5% during the loading part of each cycle [Reference Sivasubramony, Adams, Alhendi, Khinda, Kokash, Lombardi, Raj, Thekkut, Weerawarne and Yadav14].
Acknowledgments
This work was funded, in part, by a contract sponsored by the Air Force Research Laboratory under agreement number FA8650-15-2-5401 via Flex Tech Alliance, Inc., as conducted through NextFlex, the flexible hybrid electronics manufacturing innovation institute. The U.S. Government is authorized to reproduce and distribute reprints for Governmental purposes notwithstanding any copyright notation thereon.