Introduction
The hypothesis of escalation as originally proposed by Vermeij (Reference Vermeij1987) and later tested by Kelley and Hansen (Reference Kelley and Hansen1993) posits that through time, as biological hazards such as increased effectiveness of a predator become more severe, adaptations to these hazards in other taxa become more greatly expressed. During the Early Mississippian Period, following the end-Devonian Hangenberg event, durophagous fish generic richness and camerate crinoid generic richness increased in concert, until camerate richness declined during the Viséan (Sallan et al. Reference Sallan, Kammer, Ausich and Cook2011). Many Mississippian camerates displayed increased plate convexity and spinosity compared to their Devonian counterparts. Substantial increase in spinosity and plate thickness first occurred during the Mid-Paleozoic Marine Revolution (MPMR) in the Middle Devonian (Meyer and Ausich Reference Meyer and Ausich1983; Signor and Brett Reference Signor and Brett1984; Brett and Walker Reference Brett and Walker2002) and are inferred to have evolved as an anti-predatory strategy. These were legacy adaptations during the Mississippian and represent traits that were once selectively beneficial during the Devonian, eventually became obsolete after the middle Mississippian, and did not transition to new optimum conditions (Sallan et al. Reference Sallan, Kammer, Ausich and Cook2011). Huntley and Kowalewski (Reference Huntley and Kowalewski2007) documented that mean predation frequencies determined from predation traces and global mean generic-level diversity track each other through the Phanerozoic. Similarly, camerate crinoid anti-predatory adaptations, such as plate convexity and spine length, may have increased through time in concert with generic-level diversity. If escalation is common during times of changing environmental conditions, as suggested by Vermeij (Reference Vermeij1987), then we might expect to see evidence of escalation following the Hangenberg event. This line of thinking was also supported by the work of Kelley and Hansen (Reference Kelley and Hansen1993), who concluded that drilling frequencies in gastropods and bivalves increased following extinction events at the Cretaceous/Paleocene and Eocene/Oligocene boundaries. In this project, we tracked spinosity and plate convexity in three genera of camerate crinoids through the Lower Mississippian to examine whether escalation occurred in these crinoids in response to increasing durophagous predation.
Background
Sallan and Coates (Reference Sallan and Coates2010) concluded that the Hangenberg extinction event (Devonian/Carboniferous boundary) represented a faunal turnover for gnathostome fishes. Whereas the Devonian was dominated by placoderms, sarcopterygians, and acanthodians, the Mississippian was marked by rises in generic richness in chondrichthyans, actinopterygians, and tetrapods (Sallan and Coates Reference Sallan and Coates2010). Sallan and Coates (Reference Sallan and Coates2010) also examined species-level faunal composition for 66 geographically widespread gnathostome localities and determined that Devonian and Mississippian localities are compositionally distinct with regard to gnathostome faunas. This vertebrate turnover yielded an increase in durophagous vertebrates with a crushing dentition, compared to dominant shearing dental morphology of the Devonian (Sallan and Coates Reference Sallan and Coates2010). At the end of the Tournaisian, 51% of chondrichthyans were crushers, whereas during the Famennian, only 21% of chondrichthyans displayed a crushing dental morphology (Sallan and Coates Reference Sallan and Coates2010). This change in dental morphology is also coincident with a change in breakage patterns of shell fragments from Devonian to Mississippian European Paleozoic localities, which is indicative of increased durophagous predation over this interval (Salamon et al. Reference Salamon, Gorzelak, Niedzwiedzki, Trzesiok and Baumiller2014).
A major extinction at the Givetian/Frasnian boundary reduced crinoid generic richness by approximately one-third (Baumiller and Messing Reference Baumiller and Messing2007). Following this extinction event, crinoid richness increased almost continuously as crinoids passed through the Frasnian/Famennian Kellwasser anoxic event relatively unscathed (Waters and Webster Reference Waters and Webster2009). Unlike vertebrates, which experienced significant faunal turnover at the subsequent Hangenberg glaciation event, crinoids underwent a sharp rise in diversity from the Famennian to the Tournaisian (Kammer and Ausich Reference Kammer and Ausich2006; Sallan et al. Reference Sallan, Kammer, Ausich and Cook2011). Camerate crinoid richness increased into the Viséan but began to decline sharply through the remainder of the Mississippian. Thereafter, crinoid faunas were dominated by advanced cladids (Kammer and Ausich Reference Kammer and Ausich2006). Kammer and Ausich (Reference Kammer and Ausich2006) attributed the increased richness of camerates during the Tournaisian and into the Viséan to newly abundant carbonate ramp environments, preferred by camerates (Kammer Reference Kammer1985; Kammer and Ausich Reference Kammer and Ausich1987), following the loss of Frasnian–Famennian rimmed shelf environments (Kammer and Ausich Reference Kammer and Ausich2006). They additionally proposed that the demise of camerates beginning during the Viséan was due to habitat destruction and the inability of camerates to cope with the increase of siliciclastic input into the oceans during the Middle to Late Mississippian (Kammer and Ausich Reference Kammer and Ausich2006). Sallan et al. (Reference Sallan, Kammer, Ausich and Cook2011) attributed the decline to the inability of camerates to defend themselves adequately in the face of the new Mississippian durophagous predators. Both factors undoubtedly played a role (Ausich and Kammer Reference Ausich and Kammer2013). In this study, we examine the expression of defensive phenotypic traits in three genera of camerate crinoids to test for escalation in the interval leading up to the decline of camerate generic diversity in the Viséan.
Crinoid-Fish Ecological Interactions during the Early Mississippian
In order to test for escalation in the fossil record, it is necessary to demonstrate the existence of a predator-prey relationship. Despite the difficulties in preserving such information, much direct and indirect evidence indicates that crinoids fell prey to durophagous fish. Malzahn (Reference Malzahn1968) noted that the stomach remains of the Permian petalodontid holocephalan Janassa bituminosa included brachiopod shell fragments, foraminifera, and most importantly for this study, crinoid arm plates. Zangerl and Richardson (Reference Zangerl and Richardson1963) reported crinoid columnals from a Pennsylvanian coprolite, although they posited that columnals must have been a poor source of food and were unable to determine if the crinoid was prey or if the columnals were ingested from the substratum. Laudon (Reference Laudon1957) also noted the co-occurrence of Mississippian encrinites with bone beds containing abundant durophagous shark teeth. This co-occurrence of durophagous fish teeth and crinoids in the Mississippian rocks of North America has been known since the work of St. John and Worthen (Reference St. John and Worthen1875).
Evidence of regeneration has also been interpreted as a proxy for non-lethal predation against crinoids. For example, Lane and Webster (Reference Lane and Webster1966) noted irregularities in the arms of cladid crinoids, indicative of regeneration, due either to breakage from turbulent water conditions or predation, and Lane (Reference Lane1984) figured a regenerated anal sac of the cladid crinoid Cyathocrinites sp. from the Ramp Creek Formation of Montgomery County, Indiana. Springer (Reference Springer1920) also noted a specimen of Taxocrinus colletti that had regenerated its entire crown above the basal plates, presumably as a response to an episode of predation. Of relevance to this project, Hattin (Reference Hattin1958) figured a regenerated spine from the Pennsylvanian crinoid Lobalocrinus wolforum. Furthermore, Baumiller and Gahn (Reference Baumiller and Gahn2004, Reference Baumiller and Gahn2012) and Gahn and Baumiller (Reference Gahn and Baumiller2005, Reference Gahn and Baumiller2010), in their extensive examination of crinoid regeneration, found evidence of regeneration from the Ordovician to the Pennsylvanian (Baumiller and Gahn Reference Baumiller and Gahn2004), even at the individual assemblage level (the Lagerstätte from the Tournaisian of LeGrand Iowa [Gahn and Baumiller Reference Gahn and Baumiller2005]).
The Mississippian is known as the “Age of Crinoids” because it was then that crinoids reached their peak Phanerozoic richness (Kammer and Ausich Reference Kammer and Ausich2006), and “crinoid gardens” are realized in the rock record in the form of widespread regional encrinites (Ausich Reference Ausich1997). Given the widespread nature of these encrinites, and thus the abundance of crinoids on the seafloor, crinoids apparently were a potential major food source for Mississippian durophagous predators. Much of the arms and column of a crinoid were likely calorically deficient, although on average up to 50% of the volume of a crinoid ossicle consists of mesodermal tissue termed stroma (Savarese et al. Reference Savarese, Dodd and Lane1997). Despite the apparent low energetic content, several lines of evidence have been proposed to explain predation on crinoids. Lane (Reference Lane1984) hypothesized that camerate crinoids housed their gonads within the plated thecae, making a gravid crinoid a preferred prey (Lane Reference Lane1984). Interactions between crinoids and fish may also have yielded collateral damage as a result of fish predation on crinoid infesters (e.g., Meyer Reference Meyer1985; Baumiller and Gahn Reference Baumiller and Gahn2002; Gahn and Baumiller Reference Gahn and Baumiller2005), such as platyceratid gastropods (Brett and Walker Reference Brett and Walker2002; Brett Reference Brett2003). It was first proposed that platyceratid gastropods attached to crinoid tegmens were engaged in the act of coprophagy (e.g., Hinde Reference Hinde1885; Bowsher Reference Bowsher1955; Lane Reference Lane1984; Meyer and Ausich Reference Meyer and Ausich1983). Lane (Reference Lane1984) proposed that they were gametophagous feeding on gametes released from the anal vent. More recently it has been proposed (and tested by Baumiller [Reference Baumiller2002] and Gahn and Baumiller [Reference Gahn and Baumiller2003]) that platyceratids were gastrophagous, stealing food from the gut. These platyceratids presumably stole food from the ambulacral food grooves of their crinoid hosts by attaching to and occasionally drilling into their calices (Baumiller Reference Baumiller1990, Reference Baumiller2002; Baumiller and Gahn Reference Baumiller and Gahn2002; Gahn and Baumiller Reference Gahn and Baumiller2003; Gahn et al. Reference Gahn, Fabian and Baumiller2003). Regardless of the nature of the interaction, platyceratids would have represented a rich source of nutrients to durophagous predators, such as fish. Brett (Reference Brett2003) provided evidence that platyceratid gastropod infestation was associated with crinoids displaying spinosity during the Devonian, and Syverson and Baumiller (Reference Syverson and Baumiller2014) documented that camerates are more likely to be infested than non-camerates and that regeneration frequencies are higher in taxa known to be platyceratid hosts than those that are not. This may support the hypothesis that crinoid predation was due to collateral damage, or it may indicate that spinosity arose in certain lineages in order to deter platyceratid infestation.
In addition to direct evidence of predation and regeneration, other, indirect evidence has been inferred, such as the appearance of spines and increased thickness of plates coincident with the appearance of durophagous predators during the MPMR (Meyer and Ausich Reference Meyer and Ausich1983; Signor and Brett Reference Signor and Brett1984; Brett and Walker Reference Brett and Walker2002). Signor and Brett (Reference Signor and Brett1984) proposed that with the evolution of durophagous predators during the Devonian, crinoids evolved thicker calyx and tegmen plates and more spinose thecae. Expected arm loss is another indirect proxy; these values also decrease in camerates (indicating the evolution of more predation resistant morphologies) from the Middle Devonian to Mississippian and thus may indicate heightened levels of fish predation over this interval. However, it should be noted that arm-branching morphologies are likely better at repelling grazing predation than durophagy (Syverson and Baumiller Reference Syverson and Baumiller2014).
Baumiller and Gahn (Reference Baumiller and Gahn2012) treated regeneration in crinoids as evidence of sublethal predation and used it to infer predation pressures on crinoids in both the Paleozoic and the modern. Their data indicated that Lower Mississippian crinoids experienced less predation pressure than modern crinoids, supporting Vermeij’s (Reference Vermeij1987) hypothesis that predation pressures increased through time. Additionally, from their examination of crinoid Lagerstätten through time, Baumiller and Gahn (Reference Baumiller and Gahn2004) concluded that arm-regeneration frequencies in camerate crinoid populations increased from the Tournaisian of LeGrand, Iowa (time bin 1 in Ausich and Kammer [Reference Ausich and Kammer2013]) to the Viséan of Crawfordsville, Indiana (time bin 6 in Ausich and Kammer [Reference Ausich and Kammer2013]). Although they did not find this to be a significant increase in regeneration frequency, in light of evidence for increased predation pressure (Sallan et al. Reference Sallan, Kammer, Ausich and Cook2011), the role of predation during this time interval should be examined more closely.
Finally, Sallan et al. (Reference Sallan, Kammer, Ausich and Cook2011) demonstrated that following the Hangenberg event camerate generic richness mirrored that of Mississippian durophagous fishes until the Viséan, when camerate richness and durophagous fish richness became negatively correlated. They attributed this initial correlation of increased richness to independent radiations. However, the rise in camerate richness may have been driven in part by new taxa evolving more effective anti-predatory morphologies, such as more convex plates and longer spines. Similarly, Waters and Maples (Reference Waters and Maples1991) attributed echinoderm community changes during the Mississippian to predation from durophagous fish. Herein, we test the hypothesis that species-level trait escalation (more convex plates, longer spines, and calyx size) in Early Mississippian camerate crinoids is coincident with radiations of durophagous fish and camerate crinoids following the Devonian/Mississippian Hangenberg event.
Anti-Predatory Traits
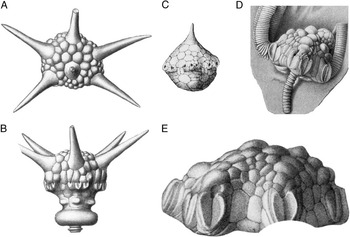
The three morphological features studied herein are tegmen spines, protruding from the tegmen of Dorycrinus (Fig. 1A,B) and Aorocrinus (Fig. 1C), the nodose peristomial cover plates on the tegmen of Agaricocrinus (Fig. 1D,E), and the size of the calyx in all three taxa. These traits have received extensive treatment in literature and have been considered as anti-predatory (see discussion above). Spinosity can confer a number of anti-predatory advantages for crinoids and other prey. Spines reduce the effectiveness of drilling (Leighton Reference Leighton2001) and durophagous predation (Johnsen et al. Reference Johnsen, Ahmed and Leighton2013) on Devonian brachiopods. Leighton (Reference Leighton2003) also documented that increased shell ornamentation, which effectively increases shell thickness, impeded drilling predation on Devonian brachiopods. Palmer (Reference Palmer1979) demonstrated that in recent gastropods, spinosity and shell thickness reduce vulnerability to durophagous fish. Also, pronounced shell ornamentation, in the form of attached artificial spines, was found to be effective at deterring muricid gastropod predation on epifaunal bivalves (Stone Reference Stone1998), and removal of spines from the shell of the muricid gastropod Chicoreus dilectus decreased the work to failure required to break the shell (Miller and LaBarbera Reference Miller and LaBarbera1995).
Drawings of Dorycrinus cornigerus (A, B), Aorocrinus subaculeatus (C), and Agaricocrinus americanus (D, E). From Wachsmuth and Springer (Reference Wachsmuth and Springer1897).

Spinosity may deter predation through a variety of means. First, longer spines effectively increase overall prey size (Vermeij Reference Vermeij1976; Palmer Reference Palmer1979). Spinosity may also increase the handling time of the predator, increasing the chances that the act of predation will be interrupted. Vermeij (Reference Vermeij1978) reported that many recent crabs break away the tops of spines of their gastropod prey without inflicting much structural damage to the gastropods’ shells. This increases both the time of handling and the amount of energy expended by the predator, thus presumably reducing the effectiveness of predation (Miller and LaBarbera Reference Miller and LaBarbera1995). Finally, shorter, stout spines, such as those examined by Palmer (Reference Palmer1979) and Miller and LaBarbera (Reference Miller and LaBarbera1995) increase the strength, and thus resistance to crushing, of the shell or, in the case of crinoids, an individual plate.
To test whether predation pressure led to a size refuge by increasing effective theca size through spinosity and larger calyces, we examined spine length and calyx diameter in Aorocrinus and Dorycrinus. In camerates, longer and wider spines may confer a selective advantage by increasing the amount of thecal material a durophagous predator must remove before it can access the viscera. In addition to spine length, we measured width of the spines at the distal end, and mid-length of the spines of Dorycrinus. Finally, we measured the width at the base in Aorocrinus and Dorycrinus to test whether the spine base became wider, thus distributing applied forces over a larger surface area and decreasing susceptibility to crushing.
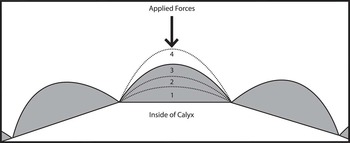
In addition to spinosity, we examined plate convexity as an anti-predatory adaptation. Convexity is a useful metric for analysis, because it numerically quantifies the cross-sectional shape of the plate. Plates with high convexity are “sharper” and begin to approach a spine in cross-section, and because plates are solid CaCO3, they achieve much the same anti-predatory benefit as a spine (discussed above) (Fig. 2). Given the advantages of more convex plate shapes, one might predict that more convex plates evolved through time as an escalatory response. Because the size of a parabolic surface scales isometrically, the convexity metric used in this study is size independent and primarily reflects plate cross-sectional shape. In addition to convexity, we considered both plate size/calyx diameter and absolute calyx size. These may be indicative of escalation because they may both lead to size refugia.
Diagram depicting application of applied forces from vertebrate jaw onto tegmen plates of camerate crinoids. 1–4 represent different plate convexities with 1 being the least convex and 4 being the most convex.

Methods
Three genera, Agaricocrinus, Dorycrinus, and Aorocrinus, were chosen for analysis because of their long stratigraphic ranges through the Lower Mississippian and their easily quantifiable anti-predatory traits. Agaricocrinus has nodose tegmenal plates that can be used to track changes in plate convexity, and Aorocrinus and Dorycrinus both have tegmenal spines. These three genera belong to the monobathrid camerate family Coelocrinidae (see Lane Reference Lane1978: Fig. 277).
Specimens were photographed and measured from the National Museum of Natural History (USNM), the Ohio State University Orton Geological Museum (OSU), the Cincinnati Museum of Natural History (CMCIP), the Field Museum of Natural History (FMNH), and the University of Illinois (RX). A few measurements were also taken from systematic literature including Laudon et al. (Reference Laudon, Parks and Spreng1952) and Ausich and Kammer (Reference Ausich and Kammer1991). Spine length and width were measured with calipers. The central spine on the top of the tegmen in Aorocrinus and Dorycrinus was measured as well as two marginal spines on the tegmen of Dorycrinus, in the C and E ray. We chose these three spines because they were the most commonly preserved. Most examined specimens were preserved without articulated arms, thus allowing for access to the tegmenal spines and plates. Because of this preservational bias, data regarding regeneration frequency were unavailable. All spine lengths and spine widths are reported as ratios standardized to the calyx diameter of the specimen from which they were measured. Basal spine width was measured at the base of each spine, mid-length width was measured at the midpoint of the total length of the spine, and distal spine width measurements were taken 1 mm below the distal end of each spine.
Plate convexity measurements for Agaricocrinus were obtained from photographs. Photographs of each plate were taken along a consistent axis in order to maintain concordance through all photos. For each specimen of Agaricocrinus, (except those from the Ohio State University) two plates were photographed. These plates are primary peristomial cover plate 1 (PPCP1) and primary peristomial cover plate 3 (PPCP3) (Sumrall and Waters Reference Sumrall and Waters2012; Kammer et al. Reference Kammer, Sumrall, Zamora, Ausich and Deline2013). All PPCP1 photographs were taken with the camera lens oriented down an axis passing through the A ray to the CD interray (n=183). All PPCP3 photographs were taken down an axis passing through the AE interray to the C ray (n=165). Both peristomial cover plates in each individual were photographed twice. After the first photograph was taken, the orientation of the calyx was changed and then readjusted to the original orientation before the second photograph was taken. Plate width and calyx diameters were also measured for specimens of Agaricocrinus from the USNM (n=197) in order to provide information regarding plate size evolution. Data are from museum collections that have inherent biases. These collections, however, are from multiple localities and the potential for size bias should be reduced because the same bias should exist for each collection.
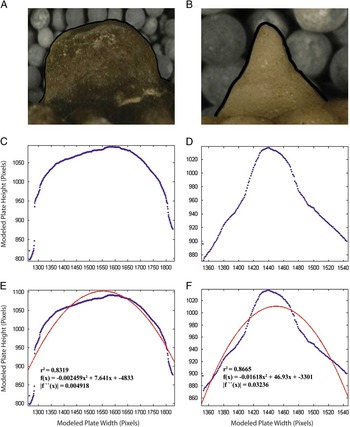
Because it is necessary to convert photographic data into numerical data in order to perform statistical analyses, the convexity value of each photographed plate was determined by modeling the outline of the cross-sectional view of the plate and fitting a parabola to this modeled outline, using the computational software package MATLAB® (MathWorks, Inc. Reference MathWorks2012). The cross-sectional view of the plate was modeled with an algorithm that traces the outline of the plate by plotting points where the RGB pixel values of the photograph change from those of the color of the crinoid calyx to those of the photograph’s background. A second-order polynomial was fit to this modeled plate outline (Fig. 3). With the parabola fit to the modeled plate outline, MATLAB gives an output consisting of the equation for the parabola, and an r 2 value representing how well the parabola fits the modeled data (MathWorks, Inc. Reference MathWorks2012). The second derivative of the equation was taken as the concavity of each parabola. Because the fitted parabolas are concave down, the second derivative is negative and may be referred to as the convexity. The absolute value of the convexity was used and are reported in pixels−1. Not all photographs were taken at the same distance from the specimen. However, the best-fit parabolas scale isometrically, allowing for analysis of data from photographs taken at different magnifications. Convexity is deviation from flatness of a shape, and this is used here to examine how plates change from flat, non-nodose plates to more nodose and spine-like convex plates (Fig. 2). Because two convexity values were determined for each plate, the average of each of these two values was taken to account for slight differences in convexity values due to slight variation in photographic axis orientation and morphometric algorithm output. Size trends in Agaricocrinus are reported separately from convexity trends.
New method used to determine convexity of Agaricocrinus plates. A, C, and E correspond to a specimen of Agaricocrinus americanus. B, D, and F are for Agaricocrinus fiscellus (USNM S999).

For temporal analysis, specimens were organized into time bins as defined by Ausich and Kammer (Reference Ausich and Kammer2006) from Gradstein et al. (Reference Gradstein, Ogg and Smith2004) and modified in Ausich and Kammer (Reference Ausich and Kammer2013). Of Ausich and Kammer’s 11 time bins of Mississippian crinoid occurrences spanning the interval from the base of the Tournaisian to the top of the Serpukhovian, we examined only specimens from time bins 1, 3, 4 and 6, from the early Tournaisian to the Viséan. All specimens were collected from within the same basin, and paleoenvironmental settings varied from shallow water carbonate platform and ramp environments to toe-of-the-slope carbonate buildups (Ausich and Kammer Reference Ausich and Kammer2013). Analyses were performed on convexity values for PPCP1 and PPCP3, calyx diameter, and plate width/calyx diameter values in Agaricocrinus. Spine length/calyx diameter values and spine width/calyx diameter values were evaluated in Aorocrinus, and the central, C-ray, and E-ray spines of Dorycrinus. Agaricocrinus and Aorocrinus data were obtained for time bins 1, 3, 4, and 6, whereas data for Dorycrinus were obtained for time bins 3, 4, and 6. These time bins span the first appearance and last appearance of each genus. Data for spine width/calyx diameter in the C and E ray spines of Dorycrinus were available only for time bins 4 and 6. Mann-Whitney U-tests were run on distributions between traits in each time bin. For the Mann-Whitney U-tests, H 0 was that the distributions were the same, and H a was that the distribution from the younger time bin was greater than the distribution from the older time bin. Each taxon examined occurred in only one time bin. Data were excluded for one specimen of Agaricocrinus illinoisensis and all specimens of Agaricocrinus hodgsoni and Aorocrinus suboviformis, because stratigraphic data from these nineteenth-century collections were imprecise and could not be assigned to a single time bin.
Results
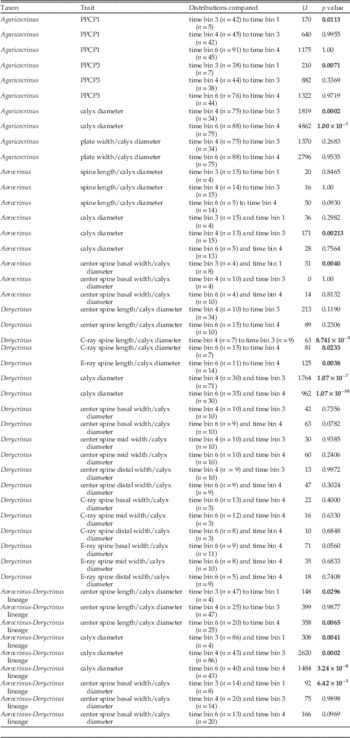
Results of Mann-Whitney U-tests are reported in Table 1. Distribution ranges, which are the minimum value subtracted from the maximum value in each distribution, are reported in Table 2, and distribution variances are reported in Table 3. Number of species of each genus and mean values for convexity and spine length present in each time bin are reported in Supplementary Tables 1–4.
Results of Mann-Whitney U-tests comparing distributions of trait values for plate convexity and plate width in Agaricocrinus, spine length and spine width in Aorocrinus and Dorycrinus, and calyx diameter in all three genera. Boldface values represent p values less than 0.05.

Range of trait value distributions in each time bin for convexity values in Agaricocrinus and spine length values in Aorocrinus and Dorycrinus. Spine length values rounded to two decimal places.

Variance of trait distributions in each time bin for convexity values in Agaricocrinus and spine length values in Aorocrinus and Dorycrinus. Spine length values rounded to two decimal places in Dorycrinus and four decimal places in Aorocrinus.

Convexity in Agaricocrinus
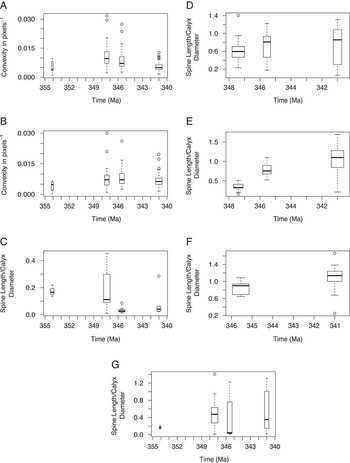
In Agaricocrinus both PPCP1 and PPCP3 display a significant increase in plate convexity from time bin 1 to time bin 3 (Mann-Whitney U-test, p<0.05, Fig. 4A,B). However, the distributions of convexity values were not significantly different between time bins 3 and 4 and between times bins 4 and 6 (Mann-Whitney U-test, p>0.05). Distributions for both PPCP1 and PPCP3 exhibit greater variances of convexity values in time bins 3 and 4 than they do in either time bins 1 or 6 (Table 3, Fig. 4A,B). Again, this increase between time bins 1 and 3 may be an artifact of low sample size in time bin 1. However, decreased variance in time bin 6 is not an artifact of sample size, because time bin 6 has the largest sample size, both in number of specimens and number of taxa, compared to any other time bin.
Boxplots of convexity and spine length. Box widths are proportional to the square root of the number of specimens in each time bin. A, PPCP1 in Agaricocrinus (time bins 1, 3, 4, and 6). B, PPCP3 in Agaricocrinus (time bins 1, 3, 4, and 6). C, Spine length/calyx diameter of Aorocrinus (time bins 1, 3, 4, and 6). D, Dorycrinus spine length/calyx diameter of central spine (time bins 3, 4, and 6). E, Dorycrinus spine length/calyx diameter of C-ray spine (time bins 3, 4, and 6). F, Dorycrinus spine length/calyx diameter of E-ray spine (time bins 4 and 6). G, Aorocrinus-Dorycrinus lineage spine length/calyx diameter of central spine (time bins 1, 3, 4, and 6).

Size in Agaricocrinus
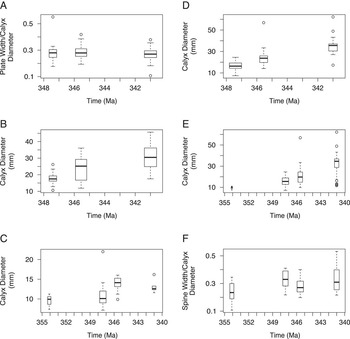
Size data in Agaricocrinus were available only for taxa at the USNM thus no taxa from time bin 1 are included. From time bin 3 to 6, calyx diameter in Agaricocrinus increases significantly (Fig. 5B). Calyx diameter values in time bin 4 are greater than those in time bin 3 (Mann-Whitney U-test, p<0.0005), and calyx diameter values in time bin 6 were in turn larger than those in time bin 4 (Mann-Whitney U, p<0.0000005). However, plate width/calyx diameter in Agaricocrinus had no significant increases from time bin 3 to 4 (Mann-Whitney U-test, p>0.05, Fig. 5A) or from time bin 4 to 6 (Mann-Whitney U-test, p>0.05). Additionally, when examined using an H a where plate size decreases, plate width/calyx diameter decreases significantly (Mann-Whitney U-test, p<0.05) between time bins 4 and 6.
Boxplots of measurements of Agaricocrinus, Aorocrinus, and Dorycrinus. Box widths are proportional to the square root of the number of specimens in each time bin. A, Plate width/calyx diameter of Agaricocrinus (time bins 3, 4, and 6). B, Calyx diameter of Agaricocrinus (time bins 3, 4, and 6). C, Diameter of Aorocrinus (time bins 1, 3, 4, and 6). D, Calyx diameter of Dorycrinus (time bins 3, 4, and 6). E, Calyx diameter of Aorocrinus-Dorycrinus lineage (time bins 1, 3, 4, and 6). F, Spine width/calyx diameter for the Aorocrinus-Dorycrinus lineage (time bins 1, 3, 4, and 6).

Spine Length/Calyx Diameter in Aorocrinus
In Aorocrinus, there is no significant increase in spine length/calyx diameter values though time (Mann-Whitney U-tests p>0.05, Fig. 4C). However, because of the small sample size in time bin 1 (n=4), interpretation of comparisons between time bins 1 and 3 is tentative. Between time bins 3 and 4 variance decreases and spine length/calyx diameter values become more uniform and there is a homing in on very low spine length/calyx diameter values (Table 3, Fig. 4C). This trend is attributed to the fact that all 17 examined individuals in time bin 4 are Aorocrinus sp. from the upper part of the Burlington Limestone, which has a mean convexity value of 0.031 (Fig. 4C).
Spine Base Width/Calyx Diameter in Aorocrinus
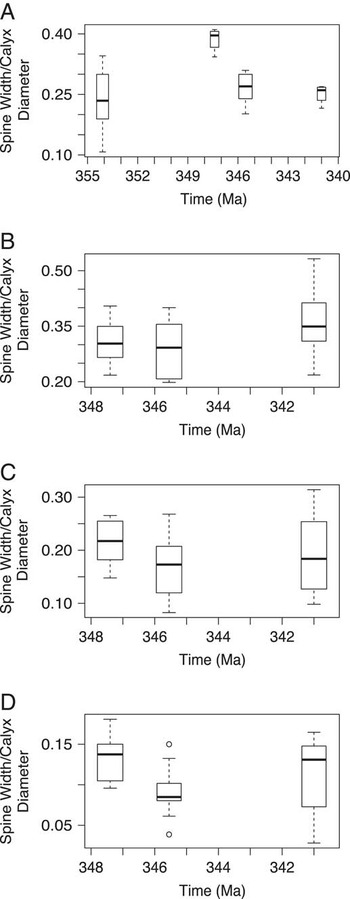
Sample size for spine width/calyx diameter in Aorocrinus is small for time bins 3 (n=4) and 6 (n=1), so analyses should be treated with caution. From time bin 1 to time bin 3, there is a significant increase in spine width/calyx diameter (p<0.005) (Fig. 6A). Between time bins 3 and 4 and time bins 4 and 6, there is no significant increase in plate width (p>0.05).
Boxplots of spine measurements for Aorocrinus and Dorycrinus. Box widths are proportional to the square root of the number of specimens in each time bin. A, Spine width/calyx diameter for Aorocrinus central spine base (time bins 1, 3, 4, and 6). B, Spine width/calyx diameter at the base of on the central spine of Dorycrinus (time bins 3, 4, and 6). C, Spine width/calyx diameter at mid-height of central spine of Dorycrinus (time bins 3, 4, and 6). D, Spine width/calyx diameter at distal end of central spine of Dorycrinus (time bins 3, 4, and 6).

Size in Aorocrinus
Calyx diameter in Aorocrinus does not increase significantly between time bins 1 and 3 (p>0.05). However, between time bins 3 and 4 it does (p<0.005). This trend does not continue into time bin 6, however (time bin 4 vs. 6, p>0.05) (Fig. 5C).
Spine Length/Calyx Diameter in Dorycrinus
Similar to Aorocrinus, the ratio of spine length to calyx diameter of the central spine of Dorycrinus had no significant increase through time (Mann-Whitney U-test, p>0.05) (Fig. 4D). In contrast, comparisons in the C-ray spine from time bins 3 to 4 and from 4 to 6 both show significant increases (p<0.05) in trait values when compared using the Mann-Whitney U-test (Fig. 4E). No data were available for comparisons between time bins 3 and 4 for the E-ray spines; however, from time bin 4 to time bin 6 there is a statistically significant increase in these trait values (Mann-Whitney U-test, p<0.05) (Fig. 4F).
Spine Width/Calyx Diameter in Dorycrinus
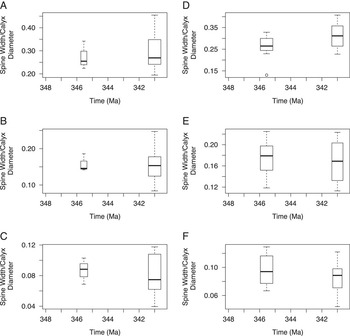
There was no significant increase in the width of the base of the central spine of Dorycrinus between time bins 3 and 4 or 4 and 6 (p>0.05) (Fig. 6B). Nor was there a significant increase in the basal spine width/calyx diameter in either the C-ray spine or the E-ray spine (p>0.05) (Fig. 7A,D). Similarly, values of spine width/calyx diameter at the mid-length point for the central (Fig. 6C), C-ray (Fig. 7B), or E-ray (Fig. 7E) spines in Dorycrinus did not increase between any of the time bins (p>0.05). Between time bins 3 and 4 and between 4 and 6 there is no significant increase in distal spine width/calyx diameter for the central spine (p>0.05) (Fig. 6D), and there is no significant increase in distal spine width/calyx diameter between time bins 4 and 6 in the C and E-ray spines (p>0.05) (Fig. 7C,F).
Boxplots of spine measurements on Dorycrinus. Box widths are proportional to the square root of the number of specimens in each time bin. A, Spine width/calyx diameter for the C-ray spine base (time bins 4 and 6). B, Spine width/calyx diameter for the C-ray at mid-height (time bins 4 and 6). C, Spine width/calyx diameter for the C-ray at distal end (time bins 4 and 6); D, Spine width/calyx diameter for the E-ray spine base (time bins 4 and 6). E, Spine width/calyx diameter for the E-ray at mid-height (time bins 4 and 6). F, Spine width/calyx diameter for the E-ray at distal end (time bins 4 and 6).

Size in Dorycrinus
Dorycrinus increases in size between time bins 3 and 4 (p<0.000005) and between time bins 4 and 6 (p<0.000000005) (Fig. 5D).
Central Spine Length/Calyx Diameter in Aorocrinus-Dorycrinus lineage
Because Dorycrinus is thought to have descended from Aorocrinus we grouped the two taxa together to analyze changes in the central spine length/calyx diameter in this lineage (Fig. 4G). Both of these genera possess a central spine, and between time bin 1 and time bin 3 the change in distribution of spine length/calyx diameter values for this spine is significant (Mann-Whitney U-test, p<0.05) (again note that sample size in time bin 1 is small [n=4]). Also, no significant change exists between time bins 3 and 4 (Mann-Whitney U- test p>0.05), but an increase in values between time bins 4 and 6 is significant (Mann-Whitney U-test, p<0.05).
Spine Base Width/Calyx Diameter in Aorocrinus-Dorycrinus lineage
If specimens from Aorocrinus and Dorycrinus in each time bin are grouped together there is a significant increase in basal spine width between time bins 1 and 3 (p<0.005). However, between time bins 3 and 4 and time bins 4 and 6, there are no significant increases (p>0.05) (Fig. 5F).
Size in Aorocrinus-Dorycrinus lineage
Size in this lineage displays the most consistent, significant trend of all the traits we examined (Fig. 5E). Calyx diameter values increased significantly between time bin 1 and time bin 3 (p<0.005) and then again between time bins 3 and 4 (p<0.0005) and time bins 4 and 6 (p<0.00000005).
Discussion
The hypothesis tested here is that predator-prey interactions between fish and camerate crinoids would result in escalation and, therefore, that anti-predatory traits would become more greatly expressed through time. However, only Agaricocrinus and Dorycrinus display this trend, and only in some of the traits examined.
There is no significant change in absolute plate convexity from time bins 3 to 6 in Agaricocrinus (Table 1, Fig. 4A,B). The shift in time bin 6 is to a restricted distribution of decreasing range and variance of convexities within each distribution (Tables 2, 3). Although this character did not increase as predicted by the hypothesis of escalation, it is possible that these data indicate directional evolution toward either an anti-predatory optimum or a minimum threshold value. This interpretation is strengthened by the fact that the number of species is the same in each time bin (n=9). An optimum or Alroy’s (Reference Alroy2000) “point attractor” may be a result of stabilizing selection at which the anti-predatory efficiency of a convex plate is reached. If this is the case, it appears that these values are centered on the mean convexity of each trait, approximately 0.0053 in PPCP1 and 0.0067 in PPCP3. Calyx size in Agaricocrinus increased through the interval of study (Fig. 5B). This increase may also explain why no significant changes in plate convexity occurred. If increase in size alone was sufficient to deter predation by durophagous fish, then selection may not have been acting on traits such as plate convexity. Thus, the observed increases in calyx size and the decrease in variance and range in convexity distributions of PC1 and PC3 are consistent with escalation. Additionally, it is important to note that this study considered the convexity of single plates, whereas the structural integrity of the plates (incorporating plate thickness and radii of curvature) and of the entire theca may be more ecologically relevant (yet are much more difficult parameters to obtain).
In Aorocrinus, the lack of a trend and fluctuating variances and mean values through time in spine length (Table 3, Fig. 4C, Supplementary Table 2) also indicate random, non-directional evolution. This argues against escalation in spine length and a size refuge due to spines or an increase in handling time in Aorocrinus. Additionally, because there is no trend of increasing basal spine width/calyx diameter values (Fig. 6A), there appears to be no escalation toward plates more resistant to crushing. There does appear to be directional change in Aorocrinus toward increasing size between time bins 3 and 4 (Fig. 5C), which may indicate evolution between these two time bins toward a size refuge. However, this trend did not continue into time bin 6, and size appears to have stabilized between time bins 4 and 6. Thus, there appear to be no morphological trends within Aorocrinus that are consistent with the escalation hypothesis.
The data on central spine length in Dorycrinus may suggest morphological stasis. There is no consistent decrease in variance or range through time in the distributions (Fig. 4D), indicating that this trait may not have been experiencing high selective pressures during the time intervals examined. Basal, mid-height, and distal spine width/calyx diameter in all spines of Dorycrinus also display stasis. There are no instances where a trend was present (Table 1), suggesting a lack of selection for wider spines, both at the spine base and in the more distal portions.
In contrast to the central spine, the trend in the spine length/calyx diameter values in the spines above the C and E rays indicate directional evolution from the early Tournaisian to the early Viséan. This may be evidence of predator-driven directional change as predicted by the hypothesis of escalation. The distribution changes from lower ratio values ( $$\overline{x} $$
=0.36) in time bin 3 to higher ratio values in time bin 4 (
 $$\overline{x} $$
=0.83), and it increased further in time bin 6 (
 $$\overline{x} $$
=1.05). This trend is also mirrored by the changes in calyx diameter among the species of Dorycrinus. Between time bins 3 and 4 and time bins 4 and 6, there were statistically significant increases in calyx size within Dorycrinus (Table 1, Fig. 5D). Thus, the trends in increasing spine length and calyx size are consistent with escalatory changes.
Evolution is commonly thought of in terms of hierarchies (Vrba and Eldredge Reference Vrba and Eldredge1984; Eldredge Reference Eldredge1996) with different processes acting at and influencing evolution on different hierarchical levels. It has been proposed that processes acting at lower levels have little effect on the dynamics of evolution at higher levels (Gould Reference Gould1985; Erwin Reference Erwin2000, Reference Erwin2010). The above increases in spinosity and size are significant not only because they support the hypothesis of escalation but also because they parallel the increase in generic richness of camerate crinoids and durophagous fish (Sallan et al. Reference Sallan, Kammer, Ausich and Cook2011). Here, a trend occurring through the mechanism of speciation, specifically the increase in spine length/calyx diameter in Dorycrinus tegmenal ray spines, mirrors the trend of increasing generic richness in camerate crinoids as demonstrated by Sallan et al. (Reference Sallan, Kammer, Ausich and Cook2011). This is interpreted as consistent with a causal mechanism of predation on crinoids, resulting in microevolutionary changes due to differential selection on the level of the individual and species (Figs. 4, 5) and also on the generic level (Sallan et al. Reference Sallan, Kammer, Ausich and Cook2011). If this is the case, this pattern of upward causation (Campbell Reference Campbell1974; Vrba and Eldredge Reference Vrba and Eldredge1984) demonstrates species sorting in the vein of Vrba’s “effect macroevolution” (Reference Vrba1980, Reference Vrba1983, and discussed in Vrba and Gould Reference Vrba and Gould1986 and Lieberman and Vrba Reference Lieberman and Vrba1995), whereby Darwinian selection on the level of the individual affects origination and extinction rates. Thus, it is responsible for trends at higher macroevolutionary levels—in this case, the species and genus levels.
It is difficult to establish a direct relationship between evolutionary mechanisms that occur on the microevolutionary level and higher-level, macroevolutionary changes (Erwin Reference Erwin2000, 2010). Processes such as species selection or different modes of speciation due to biogeography may be responsible for observed trends. In this study, however, all of the sampled crinoids were collected from the same basin (Ausich and Kammer, Reference Ausich and Kammer2013), so biogeographic differences arising from tectonically induced vicariance speciation (e.g., Lieberman Reference Lieberman2008) are unlikely to have played a role in the evolution within these genera. However, species selection, including the differential origination and extinction of species due to selection on species-level traits (Vrba Reference Vrba1984; Vrba and Eldredge Reference Vrba and Eldredge1984; Vrba and Gould Reference Vrba and Gould1986), may have been occurring in this example. If this is the case, the observed directional trends could be due to differential extinction and origination of species within Dorycrinus whereby species with lesser spine length/calyx ratio values experienced higher extinction rates than those with greater values. Although we agree with Erwin that “macroevolution is more than repeated rounds of microevolution” (Erwin Reference Erwin2000: p. 82), the example documented herein involving camerate crinoids may indicate that microevolutionary processes are responsible for patterns on the species and genus levels.
It is interesting to note that although there is a directional increase in spine length/calyx diameter values for the spines situated above the arms, there is no such trend in the central spine if Dorycrinus is analyzed alone. However, when the specimens of Dorycrinus in each time bin are combined with those of Aorocrinus, a directional trend is apparent. First, between time bins 1 and 3 there is a marked increase in spine length/calyx diameter (Fig. 4G), and although this could be due to the small sample size in time bin 1, it may also be attributable to the divergence of Dorycrinus from Aorocrinus. Within the family Coelocrinidae, only two genera are known from time bin 1, Aorocrinus and Agaricocrinus; although no phylogeny currently exists for the Coelocrinidae, morphological similarities in the tegmen and thecal plates suggest that Dorycrinus arose from Aorocrinus. The increase in spine length/calyx diameter between time bins 1 and 3 (Fig. 4G) represents the appearance of Dorycrinus and is concurrent with the appearance of spines above the arm rays in Dorycrinus. Additionally, although there is no statistically significant increase between time bins 4 and 6 in the central spine length of Dorycrinus or Aorocrinus when examined separately, when distributions are combined, there is a statistically significant increase in spine length/calyx diameter of the central spine (Fig. 4G). This shift in the central spine is concomitant with the shift toward increased spine length/calyx diameter values in the tegmenal spines above the C and E rays. Thus, within the Aorocrinus-Dorycrinus lineage, directional evolution through escalation may have occurred. A similar trend is present in basal spine width/calyx diameter in the Aorocrinus-Dorycrinus lineage. This takes place only between time bins 1 and 3 and represents an increase in spine width during the evolution of Dorycrinus from Aorocrinus. Thus, one might interpret the divergence of Dorycrinus from Aorocrinus as the evolution of more predator-resistant morphologies, which may be tied to escalation between time bins 1 and 3.
The Aorocrinus-Dorycrinus lineage also displays the most concrete evidence of escalatory change observed in this study: an increase in size through time (Fig. 5E). Size distributions increased significantly from one time bin to the next, consistent with escalatory changes toward size refugia (Table 1).
The above trends have been examined in the context of escalation, however, coevolution may also have been a part of this predator-prey system. In a predator-prey arms race, escalation commonly focuses on the role of the predator as a driver of the evolution of prey and downplays the role of the prey taxon in the evolution of the predator (Dietl and Kelley Reference Dietl and Kelley2002; Dietl Reference Dietl2003). In contrast, coevolution is an evolutionary response in two (or more) organisms in response to each other (Dietl and Kelley Reference Dietl and Kelley2002; Dietl Reference Dietl2003). Because the tegmental spines of Dorycrinus were presumably capable of injuring any fish predators (see Hlavin Reference Hlavin1990 for an example of the deadly effect spines can have on a predator), it is logical to consider these taxa as dangerous prey (Brodie and Brodie Reference Brodie and Brodie1999; Dietl and Kelley Reference Dietl and Kelley2002). Thus, coevolution, rather than just escalation, might be expected between crinoids and their durophagous fish predators (Brodie and Brodie Reference Brodie and Brodie1999). Further examination of the teeth and bite strength of Mississippian durophagous fishes is necessary to make an argument for coevolution. Further study of species-level trends in post-Givetian extinction and in the pre-Hangenberg interval is necessary to determine the full extent of escalation in crinoids before the Tournaisian rise in diversity.
Conclusion
The escalation hypothesis, as first proposed by Vermeij (Reference Vermeij1987), is not supported by trends in plate convexity in Agaricocrinus, in spine length/calyx diameter ratio in Aorocrinus, calyx size in Aorocrinus, central spine length in Dorycrinus, or spine width in Dorycrinus. However, evidence exists for escalation in the evolution of size and spine length in Dorycrinus from Aorocrinus, calyx size of Agaricocrinus, and lateral spine length in Dorycrinus as a response to increased predatory pressures during the early Mississippian. The trends in increasing lateral spine length and in calyx size match the genus-level, macroevolutionary trend documented by Sallan et al. (Reference Sallan, Kammer, Ausich and Cook2011). Coincidence of microevolutionary and macroevolutionary increase, perhaps manifested through effect macroevolution, provides evidence for a linkage of these two evolutionary processes and may represent a case in which ecological interactions have played a role in macroevolutionary trends. These results are also interesting because they demonstrate how closely related taxa, presumably under the same selective pressures, responded differently to similar pressures.
Acknowledgments
We would like to thank W. Panero, A. Rytel, J. Pigott, and J. Balsiger for assistance in operating MATLAB. K. Hollis, B. Hunda, P. Mayer, and D. Blake were also instrumental in this project for providing access to specimens. For assistance in gathering data, thanks to K. Best, without whom the sample size of Dorycrinus unicornis would have been much smaller; and to G. Hunt for discussion regarding morphological evolution through time and for teaching us R through his online tutorials. And finally, we thank the reviewers and had extremely insightful discussions with D. Wright, P. Hull, L. Cole, and L. Tackett regarding distribution analysis, morphological evolution through time, and predation in the fossil record. This research was funded in part by support from Shell Exploration and Production Company through the Shell Undergraduate Research Experience and the Undergraduate Research Scholarship through the Ohio State University College of Arts and Sciences Honors and Scholars Office.
Supplementary Material
Supplemental materials deposited at Dryad: doi:10.5061/dryad.c0kt5