Child behavior problems subsumed under “externalizing” affect not only children but also their families, schools, and communities. Oppositional and aggressive behaviors account for approximately half of all referrals to children's mental health agencies (Patterson, Dishion, & Chamberlain, 1993; Stouthamer-Loeber, Loeber, & Thomas, 1992). Adolescents with antisocial problems are more likely to become criminals in adulthood (Blumstein, Cohen, Roth, & Visher, 1986; Farrington, 1989). They are also at risk for overdosing on drugs (Robins & Price, 1991), dropping out of high school (Ensminger & Slusarcick, 1992), being unemployed (Farrington, 1988), remaining in a low-income bracket (Farrington, 1988), and being involved in physically abusive romantic relationships (Capaldi & Clark, 1998; Giordano, Millhollin, Cernkovich, Pugh, & Rudolph, 1999).
Despite the attention given to the development of treatment programs for externalizing disorders over the last two decades, many children do not show clinically significant change after treatment (Dumas, 1989; Kazdin, 1995; Southam-Gerow & Kendall, 1997). What accounts for this variability? One important factor may be the fundamental heterogeneity of children with externalizing problems (Hinde, 1992; Hinshaw & Zupan, 1997; Moffitt, 1993). Multiple structural and causal processes with distinct etiologies appear to underlie aggressive trajectories (Cicchetti & Richters, 1993). Although this is recognized by most clinicians, many researchers continue to employ methodologies which presume homogeneity in childhood externalizing disorders (Granic & Hollenstein, 2003; Richters, 1997). Moreover, when subtypes are identified, we suggest that they are usually based on superficial behavioral differences, with little attention to the psychobiological mechanisms underlying them. Such subtyping may not be best suited for tailoring treatments to the diverse cognitive and emotional capacities of externalizing children.
Given the recent advances in noninvasive neuroimaging techniques such as functional magnetic resonance imaging (fMRI), magnetoencephalography, and dense-array EEG, it is now possible to examine the brain mechanisms that may be involved in the development of externalizing problems in children. Moreover, it may be possible to use neurophysiological methods to help elucidate the brain processes that differentiate subgroups of externalizing children, and thus point toward more effective treatment strategies. As a first step along this route, the goal of the current study was to employ dense-array EEG techniques to investigate neurophysiological variables that might distinguish subtypes of externalizing children, with particular attention to the cognitive processes recruited for emotion regulation.
Subtypes of Externalizing Children
Although several subdivisions of children with externalizing behavior problems have been proposed, most rely on parsing different forms of problem behavior. For example, distinctions have been made between instrumental, goal-directed, and proactive aggression and hostile, retaliatory, and reactive patterns (Dodge, 1991; Dodge & Coie, 1987; Hinshaw & Zupan, 1997). Other schemes distinguish between direct, overt aggression (openly physical or verbal aggression) and indirect, covert aggression (e.g., shunning a peer, starting rumors; Hinshaw & Zupan, 1997). Perhaps the most widely recognized typology is based on distinct developmental taxonomies: child onset versus adolescent onset. Compared to the adolescent-onset subtype, child-onset individuals are more physically aggressive, more likely to show neuropsychological impairments, and more likely to show problems that persist into adulthood (Hinshaw, Lahey, & Hart, 1993; Moffitt, 1993).
However, given that a significant proportion of externalizing children exhibit co-occurring internalizing symptoms (e.g., anxiety, depression, somatic disorders; see Zoccolillo, 1992, for a review), classification of subtypes can also be based on comorbidity. Clinical researchers have found it useful to differentiate youth who exhibit “pure” externalizing problems (EXT) from those who have co-occurring externalizing and internalizing problems (MIXED; see Granic & Lamey, 2002, for a review and synthesis). Findings from large-scale studies have revealed differences in developmental pathways and responses to treatment, depending on the presence and type of psychopathology comorbid with externalizing behavior (e.g., Capaldi & Stoolmiller, 1999; Hinshaw & Anderson, 1996; Lahey & Loeber, 1994; Verhulst & van der Ende, 1992). Unlike most other strategies, this subtyping approach is based on hypotheses concerning differences in emotion regulation processes: EXT children are considered aggressive because they do not or cannot inhibit their anger, whereas MIXED children may be aggressive partly because they have difficulties regulating anxiety and/or sadness.
Although the advantage of this last approach is that it calls for an emphasis on mechanisms of emotion regulation, these mechanisms are difficult to identify using behavioral techniques. Moreover, neurobiological research has uncovered distinct neural correlates of emotion regulation, and these appear to covary with clinical syndromes from depression (e.g., Mayberg et al., 1999) to aggression (e.g., Blair, 2001). The purpose of this study was to use neurophysiological methods to tap cognitive mechanisms of emotion regulation that differentiate subtypes of children with externalizing problems. This was intended to point toward a causal substrate that corresponds with global differences captured by traditional questionnaire methods. We reasoned that differences in emotion regulation mechanisms could be inferred from distinct patterns of brain activity, observed during an emotion-induction procedure. We expected these patterns to relate to cortical regions associated with self-regulation and cognitive–emotional processes.
Emotion Regulation, Executive Control, and Aggressive Behavior
Many children with externalizing problems are referred for treatment because of their aggressive behavior. Aggressive behavior, in turn, may often result from inadequate or atypical emotion regulation. When emotion regulation is inadequate, emotionally challenging situations may flood the child with anger and other negative emotions including anxiety, leading to aggressive responses. What factors are responsible for poor emotion regulation in aggressive children? According to many theorists, poor emotion regulation reflects limitations in executive function (EF): the cluster of psychological processes involved in the control of thought, affect, and action (Zelazo & Mueller, 2002). These processes include the ability to monitor one's own actions, focus on alternative appraisals or strategies, disengage from distressing cues, and inhibit impulses (e.g., Posner & Rothbart, 2000). EF or cognitive control has been explicitly linked to aggression at various ages (Séguin & Zelazo, 2005). Young children who are less able to voluntarily shift their attention and inhibit their impulses have higher levels of aggression (Rothbart, Ahadi, & Hershey, 1994). In contrast, children with good attentional control are able to shift attention away from anger-inducing cues, use nonhostile verbal methods, and function more appropriately in conflict situations (Eisenberg et al., 1997; Eisenberg, Fabes, Nyman, Bernzweig, & Pinuelas, 1994). Inhibitory control contributes to the development of conscience in young school-aged children (Kochanska, Murray, & Coy, 1997), and children's self-control fosters a sense of responsibility for their actions (Derryberry & Reed, 1996). In these and related studies, behavior regulation and emotion regulation are considered extensions of a more fundamental capacity for executive or “effortful” control (Posner & Rothbart, 1998, 2000), and decrements in this regulatory capacity are thought to be responsible for aggressive behavior problems (see Hill, 2002, for a review).
Neural Correlates of Emotion Regulation Related to Aggressive Behavior
Correlations between aggressive behavior and neurocognitive deficits are well documented in the literature, and deficits in frontally mediated functions appear to be particularly relevant (Hawkins & Trobst, 2000; Moffitt, 1993). There is now considerable evidence from animal studies, as well as lesion and neuroimaging studies of human patients, linking prefrontal cortex (PFC) to aggression and antisocial behavior (Dahl, 2001). Both dorsal and ventral prefrontal activities are thought to contribute to this association. Ventromedial PFC lesions suffered in adulthood lead to impairments in affective decision making and are associated with increased aggression (Grafman, Schwab, Warden, & Pridgen, 1996; Volkow & Tancredi, 1987). Damasio and colleagues (2000) suggested that the behavioral syndrome associated with ventral and medial lesions may be referred to as “acquired sociopathy.” Blair (2001) has summarized this evidence and suggested that a closely related ventral structure, the orbitofrontal cortex (OFC), is especially important for the regulation of reactive aggression. The OFC, extending across the ventral surface of both frontal lobes, is considered a key “paralimbic” region responsible for the appraisal of emotional information, assessing reinforcement contingencies, and inhibiting impulsive behavior (e.g., Rolls, 1999; Schore, 1994). There is also some evidence linking dorsal activities, especially in the anterior cingulate cortex (ACC), to the regulation of aggression. The ACC is a second key paralimbic region in the medial–frontal cortex, associated with self-monitoring, attentional focusing, and directing attention and action in situations that require conflict resolution (e.g., Botvinick, Nystrom, Fissell, Carter, & Cohen, 1999; Posner & Rothbart, 1998, 2000). Electrophysiological measures of error monitoring, generally localized to the dorsal ACC, show less activity for low-socialized individuals who do not control their aggression (Dikman & Allen, 2000). Similarly, Davis, Bruce, and Gunnar (2002) reported that poor performance in tasks tapping Posner's ACC attentional circuit are related to externalizing problems in young children. In a recent imaging study, Sterzer, Stadler, Krebs, Kleinschmidt, and Poustka (2005) reported that many adolescents with conduct disorder show deactivation of the dorsal ACC while viewing negative (as opposed to neutral) emotion-eliciting pictures. They concluded that abnormal suppression of activity in this region represents a failure in emotional control and may account for “an impaired capability to constrain outbursts of emotional behavior, leading to an increased propensity for impulsive aggression” (p. 12). According to Davidson, Putnam, and Larson (2000), OFC and ACC activation may jointly contribute to an automatic regulatory response that controls the intensity of expressed anger, and these systems may respond abnormally in individuals prone to aggression.
The distinction between dorsal and ventral regulatory systems can be characterized more precisely, even within the ACC itself. Neuroimaging studies have shown that the ACC is composed of at least two functionally distinct regions: the ventral or “affective” region, and the dorsal or “cognitive” region (Bush, Luu, & Posner, 2000). The ventral region is involved in the evaluation of emotional and motivational information (Bush et al., 2000; Devinsky, Morrell, & Vogt, 1995) and is especially important for processing negative emotions (Marinkovic, Trebon, Chauvel, & Halgren, 2000; Kawasaki et al., 2001). The dorsal region is implicated in the modulation of attention, executive function, and working memory, and is more active during cognitively demanding tasks (Bush et al., 2000). These regions are thought to compete with each other in certain circumstances. In conditions of induced negative emotion, for example, increased activation of the ventral region appears to suppress dorsal activation (see review by Drevets & Raichle, 1998). Moreover, individuals suffering with anxiety or depressive disorders generally show ventral overactivation and dorsal underactivation compared with normal controls (Drevets, 2000; Mayberg et al., 1999). Our neural modeling of subtypes of externalizing children capitalizes on these findings. We propose that children with pure EXT problems, who do not control their angry impulses, are likely to show underactivation of both dorsal and ventral prefrontal systems (including the ACC and OFC) in situations requiring emotion regulation. We also propose that children comorbid for MIXED problems are likely to show underactivation of dorsal ACC and, because of the presence of anxiety and/or depression, overactivation of the ventral ACC or OFC when regulating their emotions.
ERP Studies of Aggressive Children
Of all the neural assessment tools available, event-related potential (ERP) methodologies have been most attractive to clinical researchers, partly because of their nonintrusive nature and relatively low cost. ERP methods involve recording EEG signals at the surface of the scalp and time locking them to the presentation of stimuli or to motor responses. Repeated time-locked trials are then averaged, so that background brain activity unrelated to the task is cancelled out, and the morphology, amplitude, and timing of the neural response to the identified event are most clearly delineated.
Most ERP research with aggressive or antisocial populations has been carried out using the P300 component. The P300 is known to reflect aspects of cognitive information processing such as orienting to stimuli and processing stimulus valence (Raine & Venables, 1987). Studies investigating P300 differences in aggressive or antisocial children and adolescents have produced inconsistent results, including both higher and lower amplitudes for these populations depending on the task (e.g., Bauer & Hesselbrock, 1999; Gerstle, Mathias, & Stanford, 1998; Lincoln, Bloom, Katz, & Boksenbaum, 1998; Raine & Venables, 1987). A similar, mixed pattern of results has been reported for other ERP components, including the N2, reflecting response inhibition (Dwivedi, Beaumont, & Brandon, 1984; Satterfield & Schell, 1984), and the N1, reflecting stimulus intensity (Raine, Venables, & Williams, 1990; Satterfield, Schell, & Backs, 1987). Few studies have specifically examined ERPs in children with comorbid externalizing and internalizing problems. However, Hill and Shen (2002) report decreasing P300 amplitudes from 8 to 18 years for comorbid, externalizing, and internalizing children as well as reduced change in this component over development.
Collectively, these ERP studies highlight various information-processing abnormalities in antisocial and aggressive children and adolescents, but there is no unique and consistent ERP signature characteristic of this population. There may be several reasons for these inconsistencies. First, few investigators have specifically studied subgroups of externalizing or aggressive children. As we have already suggested, neural differences could reflect important distinctions in the characteristics of these participants, including subtypes of externalizing behavior, the presence of hyperactivity and/or attention problems, and the presence of comorbid internalizing psychopathology. Age and gender differences may also be important. Second, the P300, maximal at more posterior sites, does not appear to tap inhibitory control or effortful attention subserving emotion regulation. Moreover, the majority of studies investigating the neurophysiological correlates of childhood psychopathology have relied on paradigms tapping perceptual processing (e.g., the oddball paradigm in P300 research). Perceptual functions may not be central to children's behavior problems. As reviewed earlier, the disturbances related to aggressive behavior problems are thought to involve executive functions recruited in the service of emotion regulation. These processes are consistently linked with frontal cortical regions including the ACC and ventral PFC, and with ERP components that are related to responding (e.g., response control and action monitoring) rather than to stimulus processing. Given that the ACC is thought to represent a point of integration for attentional and emotional information, and to mediate action monitoring, inhibition, and deliberate self-regulatory processes, it would not be surprising if ERP components associated with ACC functioning turn out to be better candidates for investigating the neural correlates of externalizing behavior problems.
ERP Components Tapping Self-Regulation
Two ERP components are of particular interest. First, a component known as the “inhibitory” N2 is thought to tap response inhibition or impulse control, particularly when prepotent response tendencies are present. The N2 is observed at frontal–central electrode sites about 200–400 ms poststimulus. It is generally greater on successful “no-go trials,” when subjects withhold a learned response (Eimer, 1993; Falkenstein, Hoormann, & Hohnsbein, 1999; Jodo & Kayama, 1992), but robust N2s are found on “go” trials as well (e.g., Davis, Bruce, Snyder, & Nelson, 2003; Nieuwenhuis, Yeung, Van den Wildenberg, & Ridderinkhof, 2003). Although the frontal N2 is usually associated with inhibition, some authors propose that it marks the monitoring of conflict between competing responses or task representations (Botvinick, Braver, Barch, Carter, & Cohen, 2001; Nieuwenhuis et al., 2003). Thus, the N2 might best be considered an “evaluative negativity,” whose psychological functions are effortful attention and self-monitoring (Tucker et al., 2003). Source analysis of the N2 points to a cortical generator in the frontal midline area, consistent with the location of the dorsal ACC (e.g., Nieuwenhuis, Yeung, & Cohen, 2004; van Veen & Carter, 2002). However, two recent studies localized the generator of the N2 to the right ventral prefrontal cortex (Bokura, Yamaguchi, & Kobayashi, 2001; Pliszka, Liotti, & Woldorff, 2000). The inhibitory N2 has been associated with behavior problems involving poor inhibitory control. For example, Pliszka and colleagues (2000) found a marked reduction of the inhibitory N2 for children with attention-deficit/hyperactivity disorder (ADHD), a reduction they attribute to an inability to initiate response inhibition. However, Yong-Liang et al. (2000) suggested that inhibition is difficult to maintain rather than initiate for this population. The overlap between characteristics of ADHD and aggressive children (Barkley, 1998; Hinshaw, 1994) suggests that this ERP component may be a good place to look for a first neural correlate of poor emotion regulation in externalizing children.
Second, an ERP known as the error-related negativity (ERN) is thought to index executive functions that are related to action monitoring or self-regulation. ERNs are detected at frontal–central midline sites, 50–100 ms postresponse, but only when subjects have made a questionable or incorrect response and only when they are motivationally engaged in correcting their performance (Luu, Collins, & Tucker, 2000). Thus, differences in ERN amplitude may reflect individual differences in self-monitoring or self-control in motivationally “hot” situations. Based on event-related fMRI and ERP source localization, the ERN is thought to tap ACC activation (Dehaene, Posner, & Tucker, 1994; Gehring, Himle, & Nisenson, 2000; van Veen & Carter, 2002). As already noted, the ACC is associated with self-monitoring and directed attention in situations that require response control or conflict resolution (e.g., Botvinick et al., 1999; Luu & Pederson, 2004; Posner & Rothbart, 2000). Moreover, personality differences have been linked to unique ERN profiles (e.g., Luu et al., 2000). As noted previously, low-socialized individuals (a construct related to psychopathy) who cannot control their impulses show smaller amplitude ERNs when faced with negative consequences (Dikman & Allen, 2000). Conversely, overcontrolled individuals (e.g., individuals with obsessive–compulsive disorder) show greater amplitude ERNs than normals, with the effects localized to the ACC (Gehring et al., 2000). Similarly, higher amplitude and shorter latency ERNs have been associated with greater anxiety (Hajcak, McDonald, & Simons, 2005).
There have been very few studies examining these ERP components over development, but two are particularly relevant for the present report. In a study using the same task as the present study, normal children from 7 to 16 years of age showed a linear decrease in amplitude of the inhibitory N2 (Lewis, Lamm, Segalowitz, & Stieben, 2006). This decrease was interpreted in terms of increasing cortical efficiency with age, consistent with neuroimaging studies of attentional control in children (Casey, Giedd, & Thomas, 2000). Amplitudes were also greater following the emotion induction component of the task for adolescents only, suggesting that younger children may have already been applying maximal effort in their inhibitory processes early in the task. In contrast, the first study to evaluate ERN amplitudes developmentally indicated increasing amplitudes from age 7 through adulthood, using a flanker task, as well as greater variability in amplitudes in younger children (Davies, Segalowitz, & Gavin, 2004). These results were interpreted as suggesting delayed maturation of the ACC and related circuitry.
In sum, despite differing profiles of developmental change, the N2 and ERN appear to tap cognitive mechanisms related to emotional processes, mediated by the ACC and related prefrontal networks. These mechanisms are hypothesized to be essential for effective emotion regulation. We predicted that recruitment of these neural mechanisms would differ between subtypes of aggressive children and between these children and age-matched controls. We expected that these differences would be tapped by differences in the amplitude and source localization of the inhibitory N2 and ERN when recorded during an emotion-inducing task.
Design and Hypotheses
Most neuroscientific studies of problem behavior have not measured emotion regulation directly. In fact, emotion regulation has rarely if ever been measured directly in any domain of psychological research (Cole, Martin, & Dennis, 2004). To distinguish externalizing subtypes based on mechanisms of emotion regulation, it would be necessary to (a) devise an experimental method in which negative emotion is specifically induced, (b) examine changes in ERPs tapping response control and self-regulation following this emotion induction, and (c) compare ERPs of subtypes of externalizing children with each other and with a group of normal age-matched peers. Therefore, we designed an emotion induction procedure embedded within a classical paradigm for studying response control, and recorded dense-array EEG as well as behavioral data. The paradigm chosen for this study was a modified version of the go/no-go task. In our design, children had to press a button rapidly when they saw a letter on the screen, but inhibit responding on approximately one-third of all trials when the same letter appeared twice in a row. They were motivated to perform well to gain points, displayed periodically on-screen, to be cashed in for a valued prize. They steadily gained points in the first block of trials, but then steadily lost all their points in the second block, presumably inducing frustration, anger, and/or anxiety. In the final block, they regained most of their points and were duly awarded their prize. However, the emotion induction was expected to continue to recruit regulatory processes during this block, so that the first and third blocks would be structurally identical except for the onset of emotion regulation processes.
Thus, we assumed that the loss of points would serve to recruit mechanisms of emotion regulation that would help the children maintain task performance, and that subtypes of externalizing children (EXT and MIXED) would show distinct neural patterns related to these mechanisms. Several specific predictions followed from the research we have reviewed. EXT children, who hypothetically apply less effortful cognitive control to regulate their emotions, were expected to show smaller amplitude N2s and ERNs than normal children, especially in the third block. We also predicted that source localization would reveal reduced activation of frontal cortical generators, especially in the region of the ACC, for the EXT group. Given the positive correlation between anxiety and ERN amplitudes, we predicted that the MIXED subtype would show larger amplitude ERP components than the EXT group, but it was unclear whether they would be greater than those of controls as well. For MIXED children, we also expected these components to be localized to more ventral regions of the PFC (or ventral ACC), consistent with evidence for dorsal/ventral competition and the tendency for anxious and depressed individuals to revert to ventrally mediated mechanisms of control. Finally, it was expected that response slowing following errors would be compromised for the clinically referred children, as a reflection of their poorer self-regulation, and that this effect would be greatest for the EXT group, because of their presumably high impulsivity and low anxiety.
Method
Participants
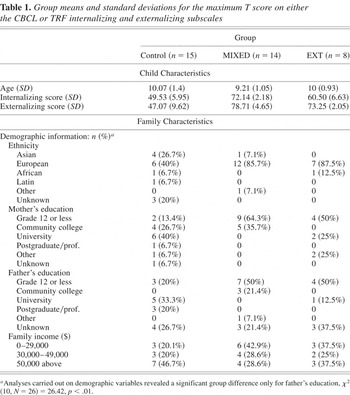
We recruited 8- to 12-year-olds from two outpatient group treatment programs for aggressive children. Participants were referred to the program by a mental health professional, teacher, or parent. In addition, age-matched controls were recruited from the community through ads placed in newspapers. These families were screened for psychiatric disorders. To be included in the study, referred children had to score within the clinical or borderline-clinical range (95th percentile) on the externalizing subscale of either the Child Behavior Checklist (CBCL; Achenbach, 1991a) or the Teacher Report Form (TRF; Achenbach, 1991b). Exclusion criteria included significant developmental delay and residence outside the large urban center where the study took place. Very few girls were referred for clinical treatment, and no girls were included within the definition of the EXT subtype, thus potentially skewing the effect of gender on the results. For these reasons, girls were excluded from the analysis. Four subjects (one EXT, two MIXED, one control) were excluded from the analysis because of excessive eye-blink and movement artifacts resulting in low trial counts for one or both ERPs. This left us with usable data for 44 boys. Seven more children were excluded from the present analyses to maximize the distinction between clinical groupings, as explained in the section on group classification. Table 1 presents demographic information broken down by subtype (see below).
Group means and standard deviations for the maximum T score on either the CBCL or TRF internalizing and externalizing subscales

Measures
CBCL
The CBCL (Achenbach, 1991a) is a standardized, highly reliable, and valid measure of children's emotional and behavioral problems. Parents are asked to indicate whether, and to what degree, their child exhibits a list of symptoms. The instrument yields standardized T scores for total behavior problems, internalizing problems, and externalizing problems, as well as T scores for a number of narrowband subscales. For the purposes of the current study, only the standardized broadband externalizing and internalizing T scores were used.
TRF
The TRF (Achenbach, 1991b) is equivalent to the CBCL but is completed by the child's teacher. It is also a standardized, highly reliable, and valid measure and generates the same broadband T scores as the CBCL. Again, only the externalizing and internalizing scales were used. TRF scores were unavailable for the control group.
Group classification criteria
Children were classified into two distinct groups based on a combination of information from the CBCL and TRF. Scores on at least one of the two instruments had to reach borderline or clinical cutoffs for a diagnostic criterion to apply. This simple combinatorial strategy has been shown to approximate best-estimate diagnoses made by clinicians (e.g., Bird, Gould, & Staghezza, 1992) and to be just as effective as more elaborate strategies, including logistic regression techniques (e.g., Loeber, Brinthaupt, & Green, 1990; see Offord et al., 1996, for a review).
“Pure” externalizing
To be in the “pure” externalizing (EXT) group, children had to score at or above the borderline clinical cutoff (T = 67) on the Externalizing scale of either the CBCL or the TRF, and to score below this cutoff on the internalizing scale of both the CBCL and TRF.
“Comorbid” externalizing and internalizing
Children were included in the internalizing/externalizing (MIXED) group if they scored at or above the borderline clinical cutoff (T = 67) on the externalizing scale of either the CBCL or the TRF and scored at or above the clinical cutoff (T = 70) on the internalizing scale on either the CBCL or TRF as well. Thus, to differentiate the clinical groups as much as possible, children were excluded from both groups if their internalizing scores were between 67 and 69 (inclusive), the borderline region between the EXT and MIXED criteria. Where there were disagreements between the CBCL and TRF scores, the maximum score was assigned. Disagreements occurred for eight MIXED children and three EXT children. For disagreements in the MIXED group, scores from the TRF were used to classify three children and scores from the CBCL were used to classify four children. One child had scores derived from the CBCL internalizing scale and the TRF externalizing scale. For disagreements in the EXT group, scores on the TRF were used for one child and the CBCL for two children.
This classification procedure resulted in groups consisting of 15 control children, 14 MIXED children, and 8 EXT children. Means and standard deviations of the externalizing and internalizing T scores for each group are presented in Table 1.
Procedure
Children were accompanied to the lab by a parent. Following a brief introduction to the testing environment, electrode sensor nets, and recording system, consent and child assent were obtained. Children were informed that they would receive a prize for playing the computer game and were shown two toy bins. One of the bins contained small, undesirable toys such as small plastic cars, whereas the second bin contained more desirable, age-appropriate toys such as large action figures, arts and crafts sets, large stuffed animals, and games. The children were informed that, with successful performance (accumulation of points) in the game, they would have their choice of toys from either of the toy bins. They were told that less successful performance would limit their choice to the less desirable toy bin. The children were asked to choose a toy they would like to earn. Then the electrode sensor net was applied while the child was seated near a computer monitor, and impedances were checked until all were acceptable. This took about 10 min. Finally, the chair was moved into position in front of the monitor, with the distance and alignment to the monitor controlled by use of a chin rest. Children were instructed to make responses in the game by clicking a button on a response pad using the index finger of their dominant hand (writing hand). Children were given a practice block of 30 trials to ensure proficiency with the task, with the opportunity to repeat the practice block if needed.
Task
The emotion induction go/no-go task used in the present study was adapted from a task developed by Garavan, Ross, and Stein (1999) and presented using E-Prime software (Psychological Software Tools, Pittsburgh, PA). In standard go/no-go paradigms, participants are required to press a button as fast as possible given a particular category of stimuli (the go condition) and withhold responding given another category of stimuli (the no-go condition). Our participants were instructed to click the button for each letter presented but to avoid clicking when a letter was repeated a second time in succession. Different pairs of similarly shaped letters were used for each block (Block A: x, y; Block B: o, p; Block C: u, d) to enhance novelty without modifying the level of difficulty. The error rate for no-go trials was maintained at 50 ± 10% by adjusting the stimulus duration (and thus the intertrial interval) dynamically. When participants correctly withheld their response on a no-go trial (preceded by a correct go trial, to ensure that they were paying attention), the stimulus duration was decreased by 50 ms in Blocks A and C (60 ms in Block B). When they responded incorrectly on a no-go trial, the stimulus duration was increased by 50 ms in Blocks A and C (30 ms in Block B). The error rate adjustment was intended to provide the same level of challenge for all participants at all ages and to obtain a sufficient number of correct and incorrect no-go trials for ERP averaging. The floor and ceiling times for stimulus duration were 300 and 1,000 ms, respectively. The intertrial interval for the correct no-go condition ranged between 700–1,400 and 1,350–2,050 ms for error trials (this included stimulus duration and error feedback).
Children were reminded at the beginning of the task and the outset of each block that a high number of points was needed to win the “big prize” they had chosen. Every 20 trials, their accumulated points were displayed in red in a window on the screen. Points were added for correct no-go responses and deducted for response errors on both go and no-go trials. The algorithm for adjusting points was maintained at +50 for correct responses and −10 for errors for Blocks A and C and +15 and −55, respectively, for Block B. Error feedback was provided by a red bar in the middle of the screen following incorrect responses, omitted responses, and late responses (i.e., responses that occurred following the stimulus window). No feedback was provided after correct responses. Blocks A and C were structurally identical, each consisting of 200 trials (including 66 no-go trials in pseudorandomn sequence). Block B consisted of 150 trials (40 no-go trials). The shorter duration of this block was meant to moderate the impact of induced negative emotion. In Block A, children saw their points steadily increase, usually to over 1,000. However, changes in the point-adjustment algorithm caused them to lose all their points and remain at zero by the end of Block B. The adjusted algorithm also produced more rapid response times in Block B. With a return to the more generous algorithm, children then regained their points in Block C to win the desirable prize. The loss of points in Block B was intended to induce emotions of anxiety and/or anger at the possible loss of the prize. At the end of the task, the children rated each of the three blocks (using the different letter pairs as reminders) on a 10-point Likert scale for five emotions: “upset,” “mad,” “nervous,” “satisfied,” and “excited.” Cards showing animated emotion faces of different intensities were used to aid recall. These were cartoon faces with eyebrow and mouth features drawn at more severe angles for faces representing greater intensity.
EEG data collection and analysis
EEG was recorded using a 128-channel Geodesic Sensor Net (Tucker, 1993) and sampled at 250 Hz, using EGI software (EGI, Eugene, OR). Impedances for all EEG channels were kept below 50 kΩ. All channels were referenced to Cz (channel 129) during recording. Eye blink and eye movement artifacts (70-μV threshold), signals exceeding 200 μV, and fast transits exceeding 100 μV were edited out during the averaging. Trials with a response time of <200 and >1,000 ms were excluded from all further analyses. The EEG was then rereferenced against an average reference (Bertrand, Perrin, & Pernier, 1985; Tucker, Liotti, Potts, Russell, & Posner, 1994). Data were filtered using an FIR bandpass filter with a low-pass frequency of 30 Hz and a high-pass frequency of 1 Hz. Stimulus-locked data were segmented into epochs from 400 ms before to 1,000 ms after the stimulus whereas response-locked data were segmented from 400 ms preresponse to 800 ms postresponse. ERP components were scored as follows. The N2 was coded as the largest negative deflection at 200 to 500 ms poststimulus, on successful no-go trials. The ERN was identified as the largest negative deflection from −20 to 200 ms postresponse, on unsuccessful no-go trials. These windows are somewhat larger than are typically considered for adult participants, to make allowances for the increased variability in child ERP latencies. Correct no-go trials that were not preceded by and followed by correct go trials were removed because they probably reflected attentional lapses or chronic nonresponding. ERPs were visually checked across both midline and adjacent electrodes from Cz to Fz. When two or more roughly equivalent peaks appeared in the target time window, spatiotemporal information from the dense-array topographical animations (head surface potential maps) was used to select the best candidate. Priority was given to peaks with a stronger midline focus. Scoring of the ERP data was carried out by a trained coder who was blind to the group membership of the participants. Final trial count means were calculated by block (ERN: 20.11 for Block A, 15.41 for Block B, and 19.81 for Block C; N2: 20.76 for Block A, 9.03 for Block B, and 23.16 for Block C) and by group (ERN: 15.51 for controls, 20.31 for MIXED, and 20.67 for EXT; N2: 17.78 for controls, 17.29 for MIXED, and 18.04 for EXT). A baseline correction factor was calculated over 400 ms preceding the stimulus or the response.
Source analysis
To estimate the cortical generators of each ERP component, temporal–spatial dipole source modeling was performed on nonbaseline-corrected, grand-averaged data using brain electrical source analysis (Berg & Scherg, 1994). Equivalent dipole models were derived using a spherical head model with an isotropic realistic head approximation factor of 20 (as recommended for child participants). Dipoles were consecutively fitted along each waveform commencing 100 ms prestimulus for the stimulus-locked components and 200 ms preresponse for the response-locked components. Dipoles were fitted across the entire length of the waveform and a final solution was considered adequate when the residual variance was <10%.
Results
To explore group differences in behavioral and neurophysiological patterns, we performed repeated-measures analyses of variance (ANOVAs) with group as the between-subjects factor and block as the within-subjects factor. Results are presented in the following order. We first report on the manipulation check for the effect of the emotion induction. Next, we present the behavioral data, including error rates, response times, and response-slowing effects. Finally, results for the N2 and ERN analyses are reported, beginning with the ERP waveforms and ANOVA comparisons and ending with the source analyses. All behavioral and ERP analyses included a dichotomous covariate representing the presence or absence of stimulant medication. Hence, the effects of medication have been removed from these analyses. Finally, age was entered as a covariate to test its effect on all behavioral and ERP analyses. All effects for age were small and nonsignificant. Hence, we removed age from the analyses in order to minimize the final number of variables.
Manipulation check
To test for the induction of negative emotion in Block B, subjective ratings for each emotion category were compared in a 3 (Group) × 3 (Block) repeated-measures ANOVA. We expected that positive emotions (“satisfaction” and “excitement”) would be endorsed less in Block B, whereas negative emotions (“nervous,” “upset,” and “mad”) would be endorsed more in Block B.
Results showed strong support for the effectiveness of the emotion induction. As shown in Figure 1, all means were in the expected direction. Positive emotions were endorsed least and negative emotions were endorsed most for Block B. There were significant quadratic block effects for all the emotion categories: “satisfied,” F (1, 34) = 37.55, p < .001, partial η2 = .53; “excited,” F (1, 34) = 35.95, p < .001, partial η2 = .51; “nervous,” F (1, 34) = 8.40, p < .01, partial η2 = .19; “upset,” F (1, 34) = 19.53, p < .001, partial η2 = .36; and “mad,” F (1, 34) = 10.43, p < .01, partial η2 = .24. There were no main effects for group, but paired comparisons revealed greater “satisfaction” for EXT than MIXED children in Block C (mean difference [MD] = 4.02, p < .05). Thus, as measured by self-report, MIXED children did not recover from the negative emotion induction as quickly or as thoroughly as EXT children.

Emotion ratings by block. [A color version of this figure can be viewed online at www.journals.cambridge.org]
Behavioral analyses
Error rates and response times (RTs)
In go/no-go tasks, error rates and response times are generally measured separately for go and no-go conditions. For the go condition, participants were required to respond to a stimulus when it appeared on the computer screen, thus errors were logged whenever the participant failed to respond. For the no-go condition, participants were required to refrain from responding when a stimulus appeared on the screen; thus, errors were logged whenever the participant responded. Both go and no-go response times were measured from stimulus onset. Error rates and response times for both go and no-go trials were submitted to a 3 (Group) × 3 (Block) repeated-measures ANOVA. We did not expect a group difference in error rate, because the dynamic adjustment algorithm adjusted the rate of stimulus presentation to roughly equalize error rates for all children. However, we were interested in possible group differences in response time.
Analysis of the error rates for the go condition revealed no significant main or interaction effects. Only the analysis of the no-go condition revealed a significant quadratic block effect with a decrease in accuracy in Block B, F (1, 33) = 23.19, p < .001, partial η2 = .413. This was not surprising given that the task was speeded and more stressful during Block B. Analysis of response times for the go condition revealed a significant block effect, F (1, 33) = 8.52, p < .01, partial η2 = .21. Response times decreased (responding became more rapid) in Block B and increased again (became slower) in Block C. There was also a Group × Block interaction effect, F (2, 33) = 3.38, p < .05, partial η2 = .17. MIXED children had significantly greater response times than controls in Block C (MD = 53.96, p < .05), suggesting more caution or vigilance following the emotion induction. The analysis of the no-go condition revealed a significant quadratic block effect, F (1, 33) = 5.21, p < .05, partial η2 = .13, with decreased reaction times in Block B. This was expected given the speeding of the task in this block. When go and no-go error trials were compared in a 2 (Condition) × 3 (Block) × 3 (Group) ANOVA, a main effect for condition was found: no-go (error) response times were faster than go (correct) response times for all three groups, F (1, 33) = 4.58, p < .05, partial η2 = .12. In other words, children responded more quickly when making errors on no-go trials than they did on correct go trials, suggesting that errors (by far more frequent in the no-go condition) were made when children responded quickly or impulsively.
Response slowing
In addition to measuring error rate and response time, we were interested in assessing children's response slowing when they received feedback about their performance (signaled by the points window). Response slowing generally indicates attentional control or performance monitoring induced by the realization of having performed poorly. We computed the difference in response time between the average of three consecutive go trials before the appearance of the points feedback window and the average of three trials after the termination of the window. Positive differences indicated a decrease in response time (speeding up), whereas negative differences indicated response slowing. Results of this analysis indicated a significant quadratic effect for block, F (1, 33) = 11.18, p < .01, partial η2 = .25. Given that points were rarely deducted in Blocks A and C because of the generous algorithm for assigning points, we examined group differences in Block B only. As shown in Figure 2, response slowing was greatest for the control group, followed by the MIXED group and then the EXT group. Analysis of Block B scores revealed a significant group effect, F (2, 33) = 4.19, p < .05, partial η2 = .20. Planned contrasts showed greater response slowing for the control group than the EXT group (MD = 58.17, p < .01). The MIXED and EXT groups also differed at the level of a trend (MD = 37.19, p = .07).
Response slowing by block and group. Means have been adjusted to remove the effect of stimulant medication. [A color version of this figure can be viewed online at www.journals.cambridge.org]
These results suggest that the EXT children had difficulty slowing their responses even when performance feedback was consistently negative.
ERP results
We began the ERP analyses by comparing amplitudes at three medial–frontocentral sites (Geodesic sensor net sites 11, 6, and 129, corresponding to Fz, FCz, and Cz, respectively) and selecting the site that showed the greatest amplitude for each component. For both the ERN and N2, the largest amplitudes were identified at site 129 (Cz). Indeed, this site is often used for evaluating both of these components (e.g., Falkenstein et al., 1999; van Veen & Carter, 2002). We therefore used amplitude data from this site for all graphical and statistical analyses.
N2 amplitudes
Figure 3 presents the stimulus-locked grand-averaged waveforms for correct no-go trials for Block A (top panel), Block B (middle panel), and Block C (bottom panel). The N2 appears as the first prominent negative deflection following the perceptual N1–P2 complex, peaking roughly 300 ms after the no-go stimulus. Figure 4 presents the overall means (corrected for the drug covariate) for the N2 by group and block. There was a multivariate effect for block at the level of a trend, F (2, 31) = 2.89, p = .07, partial η2 = .16, driven by the MIXED group, who showed a significant difference in amplitudes across blocks, F (2, 31) = 3.56, p < .05, partial η2 = .19. Inspection of Figure 4 reveals a sharp increase in amplitude for these children in Block B, with only partial recovery in Block C. Indeed, planned contrasts revealed significantly greater amplitudes for MIXED than EXT children (MD = 4.08, p < .05) and greater amplitudes for controls than EXT children at the level of a trend (MD = 3.39, p = .08) in Block C only. These results portray a differentiation of N2 responses by group following the emotion induction, with the MIXED children looking similar to the EXT children prior to the induction but showing greater activation related to response control following the induction. This finding supports our first hypothesis.
Group and block differences in grand-averaged waveforms for the N2 at site channel 129 (Cz) for Blocks A, B, and C. [A color version of this figure can be viewed online at www.journals.cambridge.org]
The N2 scalp amplitudes measured at channel 129 (Cz) by block and group. Means have been adjusted to remove the effect of stimulant medication. [A color version of this figure can be viewed online at www.journals.cambridge.org]
ERN amplitudes
Figure 5 presents the response-locked grand-averaged waveforms for no-go errors for Block A (top panel), Block B (middle panel), and Block C (bottom panel). The ERN is evident as a sharp negative deflection peaking roughly 50 ms after the response. Figure 6 presents the overall means (corrected for the drug covariate) for the ERN by group and block. There was a main effect for group at the level of a trend, F (2, 33) = 3.05, p = .06, driven in part by a significant group difference in Block A, F (2, 33) = 3.68, p < .05, partial η2 = .18. Contrasts for Block A revealed greater amplitudes for controls than EXT children (MD = 4.98, p = .01), with MIXED children showing intermediate values, as is evident in Figure 6. We had predicted that the clinical groups would show larger differences in amplitude following the emotion induction, but in fact the opposite was true. Group differences were greater before the emotion induction, and they disappeared by Block C.
Group and block differences in grand-averaged waveforms for the error-related negativity (ERN) at site channel 129 (Cz) for Blocks A, B, and C. [A color version of this figure can be viewed online at www.journals.cambridge.org]
ERN scalp amplitudes measured at channel 129 (Cz) by block and group. Means have been adjusted to remove the effect of stimulant medication. [A color version of this figure can be viewed online at www.journals.cambridge.org]
Source analyses
N2 source models
Figure 7 displays source models and topographic maps for the N2. For the control children, we identified a source in the region of the posterior cingulate cortex (PCC) in Block A, the dorsal and ventral ACC in Block B, and the dorsal ACC in Block C. For EXT children, the dominant sources were in the region of the PCC in Blocks A and C. A source suggestive of the left anterior PFC was also evident in Block B. In contrast to both the EXT and control groups, source models for the MIXED children indicated activity in the region of the ventral ACC or nearby PFC across all three blocks. Thus, the prediction of augmented ventral activity for the MIXED group was borne out, but this finding was not specific to the emotion induction or its aftermath, and normal children also showed strong ventral activity during the emotion induction itself. In addition, MIXED children showed activity in the region of the PCC in Blocks A and C. Thus, dorsal–midline activity for the control children was more anterior than for the other two groups predominantly in Block C, suggesting more deliberate control when the emotional stakes were raised.
Brain electrical source analysis equivalent-dipole models for the three groups, based on grand-averaged, stimulus-locked, correct no-go waveforms, shown at peak N2 amplitudes for Blocks A, B, and C.
ERN source models
Source models and topographic maps for the ERN are presented in Figure 8. As predicted, the ERN for control children across all three blocks was best accounted for by sources in the region of the dorsal ACC. In Block C, an additional weak source appeared in the region of the ventral PFC, perhaps indicating greater concern or anxiety following the emotion induction. Source models for the EXT group showed no dorsal ACC activity, consistent with our hypotheses. For all blocks, their ERN was best explained by sources in more posterior regions including the PCC. This “posteriorization” fits with the lower ERN amplitudes observed for this group. Also consistent with our predictions, source models underlying the ERN for the MIXED group indicated activity in the region of the (right) ventral PFC or ventral ACC. In addition, MIXED children showed activation in the posterior midline region across all three blocks, with greatest activation in Block C. Like the EXT children, and in contrast with the controls, this group showed no activity in the region of the dorsal ACC, suggesting reduced selective attention or deliberate cognitive control.
Brain electrical source analysis equivalent-dipole models for the three groups, based on grand-averaged, response-locked, no-go error waveforms, shown at peak error-related negativity amplitudes for Blocks A, B, and C. [A color version of this figure can be viewed online at www.journals.cambridge.org]
Discussion
In the present study, neurophysiological and behavioral data were collected from children with externalizing problems and normal controls in a task designed to recruit cognitive mechanisms of emotion regulation. We had predicted that EXT children who do not regulate their angry impulses would show smaller amplitude ERPs tapping response inhibition and error monitoring than their normal counterparts, and that these ERPs would correspond to source models showing less prefrontal activation. We also predicted that MIXED children would show greater amplitude ERPs than EXT children, consistent with their internalizing dynamics, and that these ERPs would correspond to sources in the ventral regions of the PFC and/or ACC, suggesting a more anxious regulatory style. Results were generally consistent with these hypotheses for both the N2 and ERN. However, subtype differentiation became statistically significant following the emotion induction, as predicted, in the case of the N2, whereas subtype differentiation was statistically significant only prior to the emotion induction, contrary to predictions, in the case of the ERN. For the N2, MIXED children surpassed controls in amplitude by about 50% in Block B, resulting in a significant effect of block for this group only. MIXED children also responded more slowly than controls in Block C, suggesting greater vigilance or caution following a negative experience. For the ERN, amplitudes were greatest for normal children and smallest for EXT children, with the MIXED group in between, across all blocks at the .06 level. It is important that these differences paralleled differences in response slowing, whereby normal children slowed down the most following negative feedback and EXT children slowed down the least. Source analyses suggested posterior cingulate and other posterior generators for the EXT group and both posterior and ventral cingulate generators for the MIXED group. In contrast, normal children showed sources suggestive of dorsal ACC activity underlying the ERN in all blocks and underlying the N2 in Blocks B and C. These results suggest functional differences between pure externalizers, children comorbid for externalizing and internalizing problems, and normal children, in cortical systems mediating response control. They are also suggestive of differences in emotion regulation, but the impact of the emotion induction depended on the component in question. In addition, our findings would suggest that response monitoring as indexed by the ERN is present in children younger than 10 years. The reward-based emotion induction paradigm developed for this study effectively increased the motivational salience of the task thereby enhancing response monitoring and cognitive control.
Although there were no group differences in N2 amplitudes prior to the emotion induction, differences resulted from a sharp increase in amplitudes for MIXED children during and after the induction. Conversely, group differences in ERN amplitudes were present prior to the emotion induction, but these differences diminished over the following blocks, because of an increase in amplitudes for the EXT group and little change for the normal children. Thus, the two components differentiated groups in contrasting ways in the context of a negative emotional experience. How might this be interpreted? The N2 is thought to tap neurocognitive mechanisms of attentional control when response inhibition is required. Thus, this component reflects anticipatory attentional efforts. Evidently, the recruitment of these efforts was augmented for MIXED but not EXT children when the situation became emotionally negative or challenging, and this was expected given their internalizing dynamics. The ERN is thought to tap neurocognitive mechanisms of self-monitoring following an error. For normal and, to a lesser degree, MIXED children, these mechanisms may have already been fully activated early in the task. However, this may not have been the case for EXT children who often ignore the consequences of their actions. For these children, negative emotional feedback may have been needed to sharpen attention to inappropriate responses. If these results are replicated, then the use of multiple ERPs may be seen as beneficial for pinpointing differences in the regulatory capacities of subtypes of externalizing children.
EXT children made only minor adjustments in speed of responding when confronted with feedback about their performance errors, compared with same-aged peers. Their failure to slow responding more substantially suggests that these children do not adequately monitor their performance or utilize environmental feedback to correct disadvantageous strategies. Both the N2 and ERN are thought to tap cortical activities mediating attentional control, response inhibition, and/or self-monitoring. Thus, EXT children's relatively small amplitudes on both these components suggest a convergence between behavioral evidence for poor self-control and neural evidence for the underactivation of specialized cortical attentional systems. However, as gleaned from the ERN results, EXT children appeared to augment neurocognitive mechanisms of self-regulation following errors when the emotional stakes were raised, making them more similar to other children in Blocks B and C. This finding might suggest treatment strategies that involve emotional highlighting of the negative consequences of certain behaviors, to help these children pay closer attention to their actions through the activation of appropriate cortical controls. Source models indicating posterior rather than anterior cingulate generators point to an anatomical correlate of poor self-regulation. Posterior cingulate cortex is thought to mediate context updating in routine situations rather than learning novel contingencies (Gabriel, Burhans, & Scalf, 2002; Luu & Tucker, 2002). It may be important that EXT children activate this region even when faced with the challenge of a new and emotionally compelling problem. Taken together, these behavioral and neural anomalies suggest limitations in EF that make it difficult for EXT children to control their behavior in social situations. The findings suggest that “pure” externalizers have deficits in attentional systems mediated by frontal and frontocingulate regions that are important for self-monitoring, inhibition, and cognitive control of behavior.
MIXED children responded more slowly than normal controls in Block C, whereas EXT children showed no such difference. This finding, coupled with the lower satisfaction reported by these children, also in Block C, suggests increased caution, concern, or vigilance following a negative experience. This interpretation is consistent with the prominence of anxiety in internalizing symptomatology. Yet, excessive caution or vigilance should have produced greater response slowing (in Block B) than was shown by normal children, and this was not the case. We speculate that the aggressive, impulsive tendencies shown by the MIXED group mark an intermittent loosening of control, possibly to the degree of disengagement or dissociation, such that performance ends up as a compromise between over- and underregulation. A role for situationally induced anxiety and vigilance also fits with the neurophysiological results. The MIXED children's N2 amplitudes diverged from those of the EXT group only after the emotion induction. To explain why MIXED children's amplitudes increased sharply in Block B, and then remained elevated in Block C, we suggest that the anxiety produced by the loss of points greatly increased the recruitment of anticipatory attentional processes associated with response control. If the regulatory efforts of MIXED children are indeed highly sensitive to situational stressors, it may be necessary for therapeutic interventions to tone down negative emotional cues, both in treatment and in interactions with parents, so that more moderate levels of anticipatory attention can prevail. Finally, the appearance of cortical generators in both the posterior cingulate area and the ventral cingulate/prefrontal area also suggest anomalies in mechanisms of self-regulation. Like EXT children, MIXED children appeared unable to utilize dorsal ACC activities mediating smooth, deliberate attentional control, and relied instead on posterior cortical systems that are generally not associated with self-regulation (except in younger children: see Lewis et al., 2006). However, unlike EXT children, they also utilized ventral prefrontal/ACC systems that are associated with self-regulation, albeit of a type that is enmeshed with the experience of negative emotion (Kawasaki et al., 2001; Marinkovic et al., 2000). Response control mediated by ventral prefrontal systems has been dubbed “hot” EF because it is recruited in emotionally demanding circumstances (Zelazo & Mueller, 2002). Thus, MIXED children may rely on regulatory mechanisms that maintain rather than override their negative appraisals. It is premature to propose a model for the etiology of MIXED behavior problems. However, as reviewed earlier, the hypothesized competition between ventral and dorsal prefrontal activities may be relevant. It may be that the anxiety and/or depression experienced by these children shuts down “higher” (dorsal) controls, such that a more enmeshed style of self-regulation is all that is available whenever negative emotions threaten immediate goals.
Our results suggest that EXT and MIXED subtypes of externalizing children are distinct, not only in terms of their behavior patterns but also in terms of the neural mechanisms that mediate their attentional controls and shape their emotional experiences. However, these neural differences do not necessarily imply that their difficulties are “hard wired.” Functional differences in brain activity patterns have been shown to shift in response to treatment (e.g., Mayberg et al., 1999), indicating that such differences may arise as a result of experience. We speculate that EXT and MIXED patterns emerge over development through feedback between behavioral habits and the progressive consolidation of unique cortical configurations. According to Johnson, Halit, Grice, and Karmiloff-Smith (2002), unique patterns of cortical specialization build on themselves over time. Lewis (2005) emphasizes the role of emotion and its regulation in selecting synaptic networks that become sculpted through this process. The inability to successfully predict social outcomes may blunt the sense of personal control experienced by both EXT and MIXED children, resulting in reduced recruitment of dorsal ACC circuitry. Underdevelopment of the dorsal ACC might promote compensatory development of other subsystems, including the posterior cingulate for both subtypes, and the ventral cingulate/PFC for MIXED children. The strengthening of these neural substrates would, in turn, reinforce less effective habits of self-control: impulsivity and underregulation for EXT children, and perhaps overcontrol and withdrawal interspersed with impulsivity and dissociation for MIXED children. These habits would then further augment social appraisals of inefficacy or helplessness. This sort of reciprocation between neurocognitive development and recurring socioemotional appraisals may carve out unique developmental trajectories for these and other types of problematic behavior patterns (Lewis, 2005). Longitudinal studies linking neural and observational methods, both over development and over the course of treatment, will be necessary to test this kind of modeling.
This study was the first to examine neurocognitive mechanisms of emotion regulation underlying heterogeneity in children's externalizing problems. Although the paradigm we have developed has shown some promising results, a number of shortcomings limit the confidence with which we can interpret these findings. First, the low rate of clinical referrals, challenges inherent in the ERP procedure, and noncompliance of some clinically referred children resulted in a relatively small N overall. Second, the breakdown of our clinical sample into subtypes resulted in a particularly small N for the EXT group. Both of these issues limited the power of our statistical analyses, contributing to effect sizes in the low to moderate range. Low effect sizes for the neurophysiological results require very cautious interpretations of the data and necessitate replication before firm conclusions are warranted. A third limitation of the study concerns the use of the CBCL and TRF as exclusive measures of children's problem behavior. Additional measures will be important to substantiate differentiation into subtypes and provide additional information about the emotional and behavioral proclivities of clinically referred children. Fourth, the reliable extraction of values from the ERP data was hampered by a high degree of variability in ERP latencies and morphologies. For example, it was not always obvious where to mark peak ERPs, especially for children who showed excessive latency “jitter.” This problem may be endemic to the neural assessment of children. Fifth, cortical source modeling is still a relatively new and controversial technique, and the reliability of localizing cortical generators is subject to dispute. This problem is exacerbated with small sample sizes and high within- and between-subject variability, both of which characterized the present study. Despite these limitations, this study demonstrates an approach to brain–behavior relations in developmental psychopathology that may be of use to other investigators as well as preliminary findings that point to specific avenues for further research.