1. INTRODUCTION
Laser induced breakdown spectroscopy (LIBS) is an analytical technique, which was first reported in early 1960s and has been reviewed by several researchers. This sensitive technique is based on optical detection of certain atomic and molecular species by monitoring their emission signals from the laser induced plasma. It provides a useful method to determine the chemical composition of a wide range of materials including metals, liquids, aerosols, plastics, minerals, and biological tissues, etc. (Miziolek et al., Reference Miziolek, Palleschi and Schechter2006; Cremers & Radziemski, Reference Cremers and Radziemski2006; Singh & Thakur, Reference Singh and Thakur2007). It is a simple analytical technique as compared to many other types of elemental analysis because of its straightforward experimental set-up. In this technique, one requires a pulsed laser for generating micro-plasma on the target surface and elemental analysis is accomplished by studying the emission of the plasma plume. The laser induced plasma characteristics depend upon several parameters, which include the features of the target, properties of the ambient medium, laser wavelength, and pulse duration etc. The first direct spectral analysis made by LIBS can be attributed to Pasquini et al. (Reference Pasquini, Cortez, Silva and Gonzaga2007) and Rung and Minck (Reference Runge and Minck1964). However, in the 1980s, this technique is in continual increase as an analytical instrument in research (Rusak et al., Reference Rusak, Castle, Smith and JWinefordner1998).
Manganese sulfate (MnSo4) is an important chemical compound. Its constituent elements are manganese, sulfur, and oxygen. Basically, it can be identified as a colorless, odorless, solid substance. This naturally occurring mineral is mostly found in hydrated state. MnSo4 has a number of medical as well as non-medical uses. Due to its importance and wide utility, it remained a subject of interest for many researchers. Sun et al. (Reference Sun, Tran, Smith and Winefordner2000) have studied the determination of Mn and Si in iron ore by Laser-induced plasma spectroscopy. Horiba et al. (Reference Horiba, Ohguchi, Kobayashi, Kumigashira, Oshima, Nakagawa, Lippmaa, Ono, Kawasaki and Koinuma2004) studied the In situ Mn 2p-3d resonant photoemission study on La0.6Sr0.4MnO3 epitaxial thin films grown by laser MBE. Hakola et al. (Reference Hakola, Heczko, Jaakkola, Kajava and Ullakko2004) reported the Ni-Mn-Ga films on Si, GaAs and Ni-Mn-Ga single crystals by pulsed laser deposition. Dhananjay et al. (Reference Dhananjay, Nagaraju and Krupanidhi2006) presented dc and ac transport properties of Mn-doped ZnO thin films grown by pulsed laser ablation. Measurement of stark broadening of Mn I and Mn II spectral lines in plasmas used for laser-induced breakdown spectroscopy was studied by Bredice et al. (Reference Bredice, Borges, Sobral, Villagran-Muniz, Di Rocco, Cristoforetti, Legnaioli, Palleschi, Salvetti and Tognoni2007). Tawfik and Mohamed (Reference Tawfik and Mohamed2008) studied the improved LIBS limit of detection of Be, Mg, Si, Mn, Fe, and Cu in aluminum alloy samples using a portable echelle spectrometer with ICCD camera. Dongxia et al. (Reference Dongxia, Xiaoyan, Dingyong, Hui and Liang2012) reported the study on microstructure and mechanical properties of Al-Mg-Mn-Er alloy joints welded by TIG and laser beam.
In the present work, we report the spectroscopic studies of the plasma generated at the surface of MnSo4 by the fundamental (1064 nm) and second harmonic (532 nm) of a Q-switched Nd:YAG laser. We have studied the transitions at 438.80 nm, 440.80 nm, 464.27 nm, 467.16 nm, 515.08 nm and the line at 519.65 nm of neutral manganese. These transitions have been used to study the spatial behavior by estimating the plasma temperature T e and the electron number density N e. This extracted information about the number density and plasma temperature will be useful for the deposition of the manganese thin films using the pulsed laser deposition technique as discussed by Mayer et al. (Reference Mayer, Pető, Karacs, Molnár and Popov2012), Ilyas et al. (Reference Ilyas, Rawat, Roshan, Tan, Lee, Springham, Zhang, Li Fengji, Chen and Sun2011), and Nagaraja et al. (Reference Nagaraja, Pramodini, Santhosh Kumar, Nagaraja, Poornesh and Kekuda2013).
2. EXPERIMENTAL DETAILS
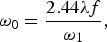
The experimental set-up is shown in Figure 1, and it is same as described in our previous works (Salik et al., Reference Salik, Hanif and Baig2011; Hanif et al., Reference Hanif, Salik and Baig2013; 2012). Briefly, we used a Q-switched Nd:YAG (Quantel Brilliant) pulsed laser having pulse duration of 5 ns and 10 Hz repetition rate, which is capable of delivering 400 mJ at 1064 nm, and 200 mJ at 532 nm. The laser pulse energy was varied by the flash lamp Q-switch delay through the laser controller, and the pulse energy was measured by a Joule meter (Nova-Quantel 01507). The laser beam was focused on the target using convex lens of 20 cm focal length. The sample was mounted on a three-dimensional sample stage, which was rotated to avoid the non-uniform pitting of the target. The distance between the focusing lens and the sample was kept less than the focal length of the lens to prevent any breakdown of the ambient air in front of the target. The spectra were obtained by averaging three data of single shot under identical experimental conditions. The radiation emitted by the plasma were collected by a fiber optics (high-OH, core diameter: 600 µm) having a collimating lens (0–45o field of view) placed at right angle to the direction of the laser beam. The optical fiber was connected with the LIBS-2000 detection system (Ocean Optics Inc.), to measure the plasma emission. The emission signal was corrected by subtracting the dark signal of the detector through the LIBS software. The LIBS-2000 detection system is equipped with five spectrometers each having slit width of 5 µm, covering the range between 220–720 nm. Each spectrometer has 2048 element linear CCD array and an optical resolution of ≈ 0.05 nm by scanning a narrow bandwidth dye laser. In the experiments, the time delay between the laser pulses and the start of the data acquisition is about few microsecond, whereas the integration time is about 2 ms. In order to record the emission spectrum, the LIBS-2000 detection system was synchronized with the Q-switch of the Nd:YAG laser. The flash lamp out of the Nd:YAG laser triggered detection system through a four-channel digital delay/Pulse generator (SRS DG 535).The LIBS-2000 detection system triggered the Q-switch of the Nd:YAG laser. The diameter of the spot size (ω0) on the sample/target surface is calculated using the relation:
(Color online) Block diagram of the experimental set-up.

 $${\rm \omega} _0 = \displaystyle{{2.44{\rm \lambda} f} \over {{\rm \omega} _1 }}\comma \;$$
where ω1 is the diameter of the incoming laser beam before focusing, ω0 is the diameter of the laser beam after focusing, ƒ is the focal length of the lens, and λ is the wave length of the laser used.
3. RESULTS AND DISCUSSIONS
3.1. Emission Studies
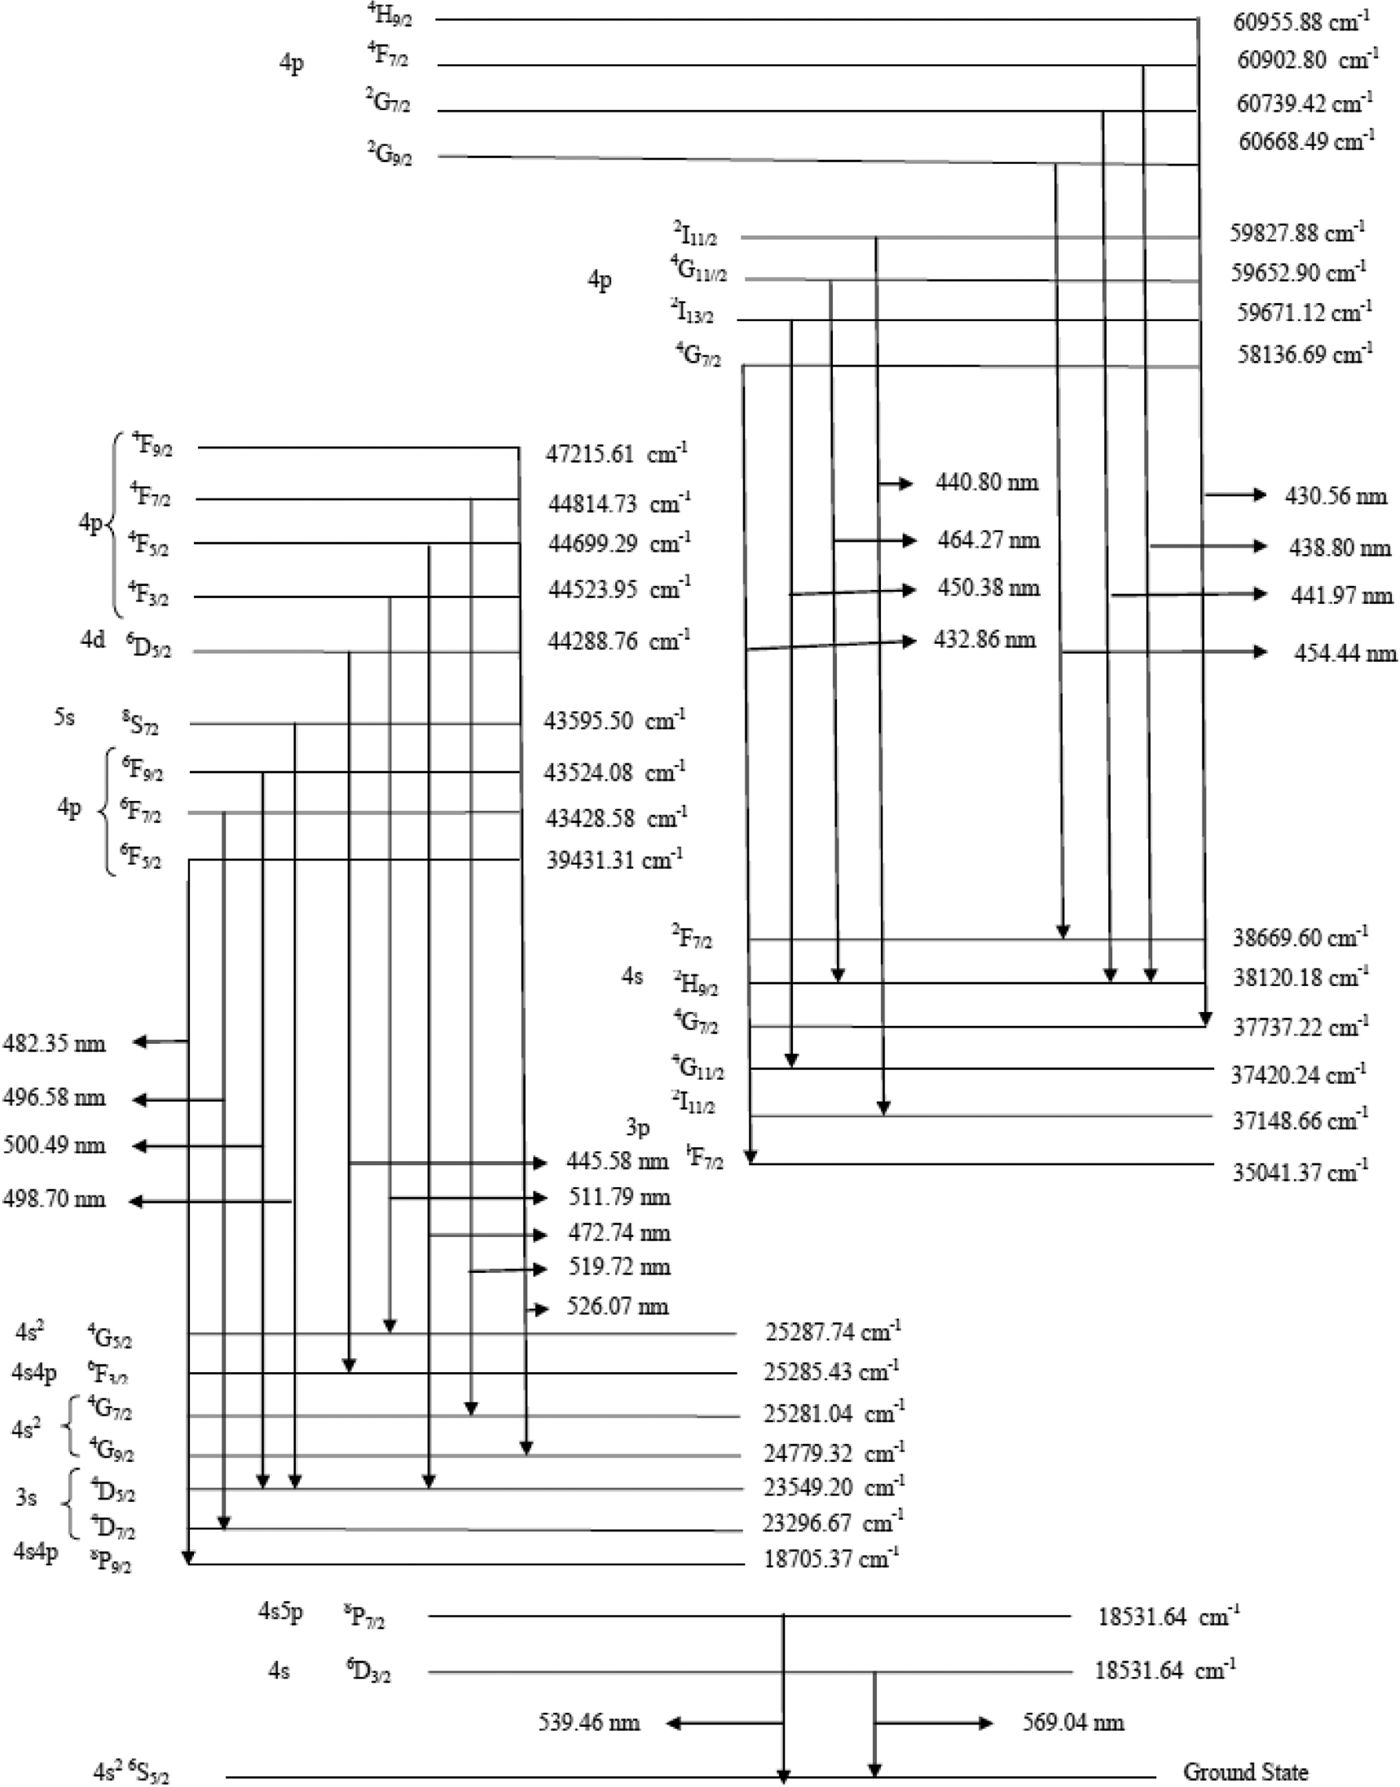
In the first set of this experimental work, we have recorded the plasma emission generated by the fundamental (1064 nm) of an Nd:YAG laser. The laser was focused by a quartz lens with a focal length of 20 cm. MnSo4 plasma was recorded at different positions along the direction of propagation of the plasma. Figure 2a shows the emission spectrum taken with the 532-nm laser showing the spectral lines of manganese covering the spectral region from 320 to 390 nm; both neutral as well as single ionized lines are present in this region. Figure 2b shows the emission spectrum taken with the 532-nm laser covering the spectral region from 430 to 600 nm. Mn lines are present in this region the portion of the spectrum predominantly shows the spectral lines of neutral manganese. The acquired data is averaged for three laser shorts. The sum of lines belonging to S I at 458.92 nm, 529.57, 544.98 nm and S II at 341.37 nm, 358.41 nm, 365.44 nm, 381.98 nm, 488.56 nm, and 588.97 nm have also been detected in the emission spectrum. The line identification is straightforward as the energy levels of manganese are tabulated in the NBS (NIST) database (Sansonetti & Martin, Reference Sansonetti and Martin2005) and their transitions are shown in Figure 3.
(Color online) (a) Emission spectrum of laser-produced manganese sulfate plasma using the 532-nm laser showing predominantly the manganese spectral lines in addition to S II covering the spectral region from 340 to 390 nm. (b) Emission spectrum taken with the 532-nm laser showing the spectral lines of manganese covering the spectral region from 430 to 600 nm in addition to S I and S II lines.
Energy levels diagram showing manganese transition.
3.2. Determination of Electron Temperature
Having observed the well-resolved multiplet structure from a number of excited levels and decaying to a lower level, it is tempting to extract the plasma parameters from the observed spectra; in particular, the electron density and the plasma temperature. The spatial behavior of the line intensities have been recorded using the fundamental (1064 nm) and second harmonic (532 nm) of the Nd:YAG laser by varying the distance of the detector from the target surface along the plume expansion. The plasma temperature is determined using the Boltzmann plot method from the relative intensities of the observed line; the relative intensities are normally proportional to the population of the pertinent upper levels. The following relation has been used to extract the plasma temperature (Griem, Reference Griem1997):
 $$\ln \, \left({\displaystyle{{I_{ki} \, {\rm \lambda} _{ki} } \over {A_{ki} g_k }}} \right)= \ln \, \left({\displaystyle{{N\lpar T\rpar } \over {U\lpar T\rpar }}} \right)\, \, - \displaystyle{{E_k } \over {kT}}\comma \;$$
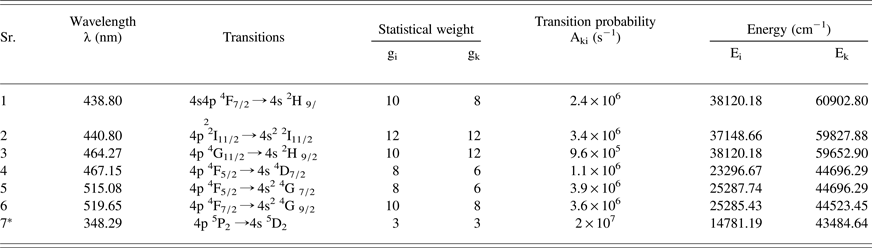
where I ki is the integrated line intensity of the transition involving an upper level (k) and a lower level (i), λki is the transition wavelength, A ki is the transition probability, g k is the statistical weight of level (k), N(t) is the total number density, U(T) is the partition function, E k is the energy of the upper level, k is the Boltzmann constant, and T is the excitation temperature. A plot of ln (λI/gA) versus the term energy E K gives a straight line with a slope equal to (−1/KT). Thus the plasma temperature can be determined without the knowledge of the total number density or the partition function. A typical Boltzman plot is shown in Figure 4. The line identifications and different spectroscopic parameters such as wavelength (λki), statistical weight (g k), transition probability (A ki) and term energy (E k) are listed in Table 1. To calculate the electron temperature of the plasma we have used the Mn I lines at 438.80 nm, 440.80 nm, 464.27 nm, 467.16 nm, 515.08 nm, and the line at 519.65 nm. Errors are bound to be present in the determination of the plasma temperature by this method therefore; the temperature is determined with ≈10% uncertainty, coming mainly from the transition probabilities and the measurement of the integrated intensities of the spectral lines. The electron temperature of the plasma generated by the 1064 nm laser close to the target surface (0.05 mm) is estimated at 9842 K that varies to 9370 K at a distance of 2 mm from the target. The same experiment was repeated using the 532 nm laser where the temperature varies from 9668 K to 9297 K respectively. The variation in the electron temperature as a function of distance from the target surface for the plasma produced by the 1064 nm and 532 nm laser is shown in Figure 5. The region near the surface of the target material constantly absorbs radiation during the time interval of the laser pulse, causing a higher temperature near the target. This higher value of the temperature is due to absorption of the laser radiation by the electrons via the inverse bremsstrahlung absorption process. A decrease in the temperature may be attributed to the thermal energy which is rapidly converted into kinetic energy when the plasma is attaining maximum expansion velocities, causing the temperature to drop for the expanding plasma.
(Color online) Boltzmann plot based on six neutral manganese spectral lines using fundamental (1064 nm) harmonic of the Nd:YAG laser.
(Color online) Variation of the electron temperature along the direction of propagation of the plasma plume using fundamental (1064 nm) and second (532 nm) harmonics of the Nd:YAG laser.
Spectroscopic parameters of the neutral manganese lines used for the determination of T e & N e
*used for the determination of Ne.
3.3. Determination of Electron Number Density
One of the most reliable techniques to determine the electron number density is from the measured Stark broadened line profile of an isolated line of either neutral atom or single charge ion. The full width at half maximum of a Stark broadened profile is related with the number density through the following relation (Miziolek et al., Reference Miziolek, Palleschi and Schechter2006; Cremers & Radziemski, Reference Cremers and Radziemski2006; Singh & Thakur, Reference Singh and Thakur2007; Greim, Reference Griem1997), neglecting the contribution of the ion impact broadening.
 $$\Delta \lambda _{1/2}\approx 2\times 10^{-16}{\rm \omega} Ne.$$
Here Δλ1/2 is the width of the spectral line, ω is the electron impact broadening parameter, and N e is the electron number density. In Figure 6, we show the line profile of the neutral manganese line at 472.74 nm along with the least squares fit of a Lorentizion line shape which yields the width Δλ1/2 of this line. The line at 348.30 nm is used for the determination of electron number density and the Stark broadening parameter ω for this line is available in the literature (Bredice et al., Reference Bredice, Borges, Sobral, Villagran-Muniz, Di Rocco, Cristoforetti, Legnaioli, Palleschi, Salvetti and Tognoni2007). The condition that the atomic states should be populated and depopulated predominantly by electron collisions, rather than by radiation, requires an electron density which is sufficient to ensure the high collision rate. The corresponding lower limit of the electron density is given by the McWhirter (Reference McWhirter, Huddleston and Leonard1965) criterion to check the condition for the validity of the local thermodynamic equilibrium (LTE):
 $$N_e \ge 1.6\times 10^{12} {\rm T}^{1/2} \left({\Delta E} \right)^3\comma \;$$
where T (K) is the plasma temperature and ΔE (eV) is the energy difference between the states, which are expected to be in LTE. At about 9842 K, Eq. (4) yields N e ≈ 3.68 × 1014 cm−3. The electron number densities determined in our experiments are higher than this required number density to satisfy the LTE conditions. When the laser beam is focused on the target, the ablation of target takes place and due to the density gradient, the plasma rapidly expands. In Figure 7, we show the variation in the number densities using lasers at 1064 nm and 532 nm. The number densities close to the target surface (0.05 mm) are about 2.27 × 1017 cm−3 and 1.58 × 1017 cm−3 and decrease to 5.79 × 1016cm−3 and 3.26 × 1016cm−3 at distances of 2 mm for 532 nm and 1064 nm lasers, respectively. Interestingly, the variation in the electron number density is very small for the 532 laser as compared with that of the 1064 nm laser. The decrease in the number density at large distance is mainly due to the recombination of electrons and ions. As is evident from the figures the electron temperature and number density decrease rapidly within a short distance from the target surface, while at a large distance, they exhibit little variation. The variation in the electron temperature is slower as compared with that of number density. The electron temperature and number density are different for the two wavelengths of the Nd:YAG laser, because of the difference in the energy per photon in each case. For any wavelength, the incident energy is absorbed by the plasma as internal energy. The internal energy of the plasma is distributed in its thermal and ionization energy. It is a well-known fact that the laser wavelength influences the ablation process. The electron density is higher in the 532 nm laser than in the 1064 nm laser. The particle density in the plasma depends on the degree of ionization, evaporation rate, and the plasma expansion velocity. Because of the high expansion velocity of the leading plasma edge, the electron density decreases, makes the plasma transparent to the laser beam at larger distance away from the target surface. The absorption in the plasma mainly occurs by an inverse bremsstrahlung and photo ionization process.
(Color online) Stark broadening profile of the Mn (I) line at 472.74 nm. The dots represent the experimental profile and the solid line is Lorentizian fit.
(Color online) Variation of the electron number density along the direction of propagation of the Plasma plume using fundamental (1064 nm) and second (532 nm) harmonics of Nd:YAG laser.
3.4. Effect of Laser Irradiance
In the second set of experiments, we have determined the electron temperature and electron number density for different values of the laser irradiance by using Nd:YAG laser at 1064 nm and 532 nm wavelengths. We have observed that the intensities and widths of the spectral lines increase with the increase in the laser irradiance. Figure 8a shows the variation of the electron temperature for the laser produced plasma with respect to the laser irradiance at a distance of 0.05 mm from the target surface. In the case of 1064 nm laser, the electron temperature varies from 9367 K to 9835 K whereas, in the case of 532 nm laser, the temperature varies from 9290 K to 9740 K over a laser irradiance range from 2 × 10¹⁰ Wcm−2 to 6.5 × 10¹⁰ Wcm−2. These figures show that the electron temperature increases with the increase in the laser irradiance. Moreover with the increase in the laser irradiance the mass ablation rate also increases (Russo et al., Reference Russo, Mao, Liu, Yoo and Mao1999), and hence the spectral line intensities and the widths increase as well. Figure 8b shows the variation of electron number density as a function of laser irradiance. The electron number density varies from 5.30 × 1016 cm−3 to 2.22 × 1017 cm−3 for the 1064 nm laser and it varies from 3.26 × 1016 cm−3 to 1.89 × 1017 cm3 in case of the 532 nm laser. The number density is slightly higher in the case of the 532 nm laser than that in the 1064 nm laser. The two important mechanisms occurring in plasma are inverse bremsstrahlung (IB) and photo-ionization (PI). The IB process is usually described by the inverse absorption length which can be estimated from the relation (Chang & Warner, Reference Chang and Warner1996):
 $$\alpha_{\rm iB} \sim 1.37 \times 10^{-35} \lambda^{3} Ne^{2} T_{e}^{-1/2}.$$
(Color online) (a) Variation of the electron temperature with the laser irradiance using fundamental (1064 nm) and second (532 nm) harmonics of the Nd: YAG laser. (b) Variation of the electron number density with the laser irradiance using fundamental 1064 nm) and second (532 nm) harmonics of the Nd: YAG laser.
Here λ (μm) is the wavelength of the laser photons, T e (K) is the electron temperature and N e (cm−3) is the electron density. In the case of 1064 nm laser, the IB absorption αiβ is ≈ 8.15 × 10⁻² cm−1 at the laser irradiance of 5.50 × 10¹⁰ Wcm−2. The IB process is more efficient in the case of 1064 nm laser as compared with the 532 nm laser because of its λ3 dependence. Thus the number density in the case of 532 nm laser is higher than that of 1064 nm laser. We have also studied the spatial behavior of the lines intensity for the Mn (I) prominent lines at the two laser wavelengths. In Figure 9a, we present the intensity behavior of the 472.74 nm, 482.35 nm, 511.79 nm, 515.09 nm, 519.65 nm, and 526.07 nm lines of Mn (I) as the distance is varied from 0.05 up to 2 mm along the plume in small steps and the 532 nm laser energy was adjusted at 72 mJ. It is observed that the intensity of the line is much higher when the spectrum is recorded close to the target surface (0.05 mm) and it decreases as we move away from the target surface in the direction of plume expansion. Identical trend has been observed at both the laser wavelengths. The reason for the decrease in the intensity is attributed to the recombination of ions with the electrons that decreases at larger distance from the target surface. As recombination decreases at the plasma edges hence the intensities of the spectral line decrease. The behavior of these lines as a function of laser energy has also been examined which is shown in Figure 9b for the 532 nm lasers. The spectra were recorded at 0.05 mm from the target surface and the 532 nm laser energy was varied from 38 to 72 mJ. It is observed that the intensity of the line decreases by reducing the laser energy. The trend is similar for both the lasers. The higher laser energy produces greater ablation hence the intensities of the spectral lines are higher at higher laser energies.
(Color online) (a) Behavior of the spectrum of manganese sulfate with variable distance along the direction of plasma plume using 532-nm laser at 72-mJ energy. (b) Behavior direction of plasma plume using 532-nm laser at 0.05 mm distance.
CONCLUSION
The LIBS method has been successfully applied as a technique for the analysis of manganese sulfate using the fundamental and second harmonics of an Nd:YAG laser. The electron temperatures and number densities have been determined as a function of laser irradiance, laser wavelength and as a function of distance from the target surface along the plume expansion. It is observed that electron number density is higher for the 532 nm laser than that for the 1064 nm laser, whereas the electron temperature is higher for the 1064 nm laser higher than that for the 532 nm laser for the same value of laser irradiance and distance. The value of T e calculated for the fundamental harmonic (1064 nm) of the Nd: YAG laser is 9842 K, and that for second harmonic (532 nm) is 9670 K and the values of N e close to the target surface (0.05 mm) in the case of second (532 nm) and fundamental (1064 nm) wavelengths of the Nd: YAG laser are 2.27 × 1017 cm−3 and 1.58 × 1017 cm−3, respectively.