Introduction
The advancement of nanotechnology in the last two decades has enabled the control of materials properties at the extremely small scale. Recent successes of using nanotechnology to improve cement composites have been achieved by introducing nanofillers with high aspect ratios, such as carbon nanotubes (CNTs)[Reference Konsta-Gdoutos and Aza1] and cellulose nanocrystals (CNCs)[Reference Cao, Zavaterri, Youngblood, Moon and Weiss2] into the cement matrix. Compared with CNTs, CNCs possess major advantages, including low cost, high abundance, biodegradability, and insignificant environmental and health impacts.[Reference Moon, Martini, Nairn, Simonsen and Youngblood3] Cao et al. improved the flexural strength of cement paste by ~30% and 50% by incorporating 0.2 vol% of raw CNCs and 1.5 vol% ultrasonicated CNCs into the mixture, respectively.[Reference Cao, Zavattieri, Youngblood, Moon and Weiss4] This performance enhancement with such small loadings originates from the increase in degree of hydration (DOH). The authors identified two mechanisms for the DOH increase: (1) steric stabilization by which CNCs separate the cement particles and increase the interfacial area between cement and water; (2) short-circuit diffusion (SCD) in which CNCs, due to their hydrophilic nature, transport water passing through the dense hydration products shell to induce more hydration in the unhydrated cement cores. The SCD is a new route of hydration kinetics and opens up opportunities for alternative possibilities for hydration, especially at late ages. The distribution of CNCs in cement paste is key because: (1) they form a pathway to convey water from the pore solution to the unhydrated cement cores; and (2) a non-uniform distribution may cause agglomerates that act as stress concentrators compromising mechanical performance. It was reported[Reference Cao, Tian, Bahr, Zavattieri, Youngblood, Moon and Weiss5] that in the fresh cement paste, most CNCs (>94%) are adsorbed on cement surface. In the hardened paste, however, the CNCs were found to be distributed in the matrix, with a higher concentration in the high-density calcium-silicate-hydrate (CSH). This result suggests that at early ages, when hydration products grow outward from the cement particle cores, anchoring some CNCs at their original locations, in the meantime other CNCs were pushed away from the cores staying in the pore solution. Therefore the CNC concentration in the pore solution is directly correlated with the distribution in the hydration products. It was reported[Reference Cao, Zavattieri, Youngblood, Moon and Weiss4, Reference Phan-Xuan, Thuresson, Skepö, Labrador, Bordes and Matic6] that the viscosity of CNC suspension increases with concentration, and this dependence is much more evident when charges are introduced into the medium, facilitating the agglomeration of CNCs. This study takes advantage of the strong dependence of the pore solution viscosity on CNC concentration to establish a facile quantitative method to determine the real-time in situ concentration of CNCs in early-age cement paste. With hydration, the volume of pore solution rapidly decreases, as well as the pore size. The largest pores in hardened cement pastes, defined as “large capillary pores,” have diameters from 50 to a few hundred nm, which are at the same length scale of CNCs (tens to hundreds of nm long[Reference Wang, Wang, Shi, Yu, Song, Dong, Jiang and Han7]). It should be expected that the CNCs do not have adequate mobility in pore solution when the pore size is not sufficiently large. Most CNCs (if not all), are embedded in the hydration products at later ages when the pores are smaller than CNCs. Therefore, it is not meaningful or feasible to study the pore solution once the pore size is less than a few hundred of nm. Hence for hardened cement pastes, the investigation of CNC distribution should be on the hydration products, especially the difference on high and low-density CSHs. As reported,[Reference Cao, Tian, Bahr, Zavattieri, Youngblood, Moon and Weiss5] CNCs have a major influence on the local elastic modulus of hydration products. This paper characterizes the elastic modulus of hydration products to locate CNCs in hardened cement pastes.
There has been no report so far concerning CNC concentration evolution in pore solution of early-age cement pastes (before setting). For CNC distribution characterization in hardened cement paste, indirect methods have been employed, such as centrifugation, isothermal calorimetry, pore size distribution, and microscopy.[Reference Cao, Zavaterri, Youngblood, Moon and Weiss2, Reference Cao, Tian, Bahr, Zavattieri, Youngblood, Moon and Weiss5] Nanoindentation was another reported approach,[Reference Cao, Tian, Bahr, Zavattieri, Youngblood, Moon and Weiss5] while it is time consuming and equipment demanding. More importantly, nanoindention cannot generate a continuous mapping since there has to be a reasonable distance (a few nm) between two nearest indentings to avoid influence from each other. Energy-dispersive x-ray spectroscopy (EDX) was the only method reported so far to generate a mapping of CNC distribution by detecting the oxygen concentration on the surface of cement paste. However, this method requires delicate control to avoid the carbonation, which significantly affects the data. In addition, EDX employs a normalization processing on the collected signals based on an assumption that oxygen concentration is directly proportional to the signal intensity regardless of the experimental condition.
This work investigates the feasibility and validity of using dynamic atomic force microscopy (AFM) as an accurate and convenient quantitative method to characterize CNC distribution in both fresh and hardened cement pastes. Dynamic AFM employs a vibrating tip that interacts with the sample via short- and long-range intermolecular forces. The interaction processes are simulated with virtual environment dynamic AFM (VEDA)—a suite of state-of-the-art computational tools deployed on nanoHUB (nanohub.org) for high accuracy simulation of AFM.[Reference Melcher, Hu and Raman8] Recently VEDA has produced a number of remarkable advancements in AFM studies.[Reference Kiracofe, Melcher and Raman9–Reference Kurra, Prakash, Basavaraja, Fisher, Kulkarni and Reifenberger17] To the best of the authors’ knowledge, this is the first VEDA study on cement composites.
Methods
Pore solution
Different species of ions exist in the pore solution since the initial mixing of cement and water, such as Na+, K+, Ca2+, OH−, and  ${\rm SO}_4^{2 -} $.[Reference Rajabipour, Sant and Weiss18] The charges adhering onto CNCs promote agglomeration and alter the physical properties of the suspension, such as viscosity.[Reference Cao, Zavattieri, Youngblood, Moon and Weiss4] Multiple reports have used AFM to study rheological properties of fluids[Reference Ahmed, Nino and Moy19–Reference Labuda and Grütter21] and the results showed a strong influence of viscosity on the natural frequency ω n of the vibration. This simulation is conducted with VEDA module “frequency sweep (advanced: liquids).” In the test, the driving frequency ω d for the oscillation was continuously increased from 0.1 to 2.5 kHz. As ω d approaches ω n, the amplitude increases, and vice versa. A peak amplitude is expected when ω d and ω n are intertwined. The sample preparation for the test is facile and convenient. Since the tip only works at one spot, it does not require a high flatness for the sample surface. For early-age cement paste, the relatively soft sample can be sliced to expose an inner surface.
An important control in the experiment is the relative humidity (RH) of the environment, which helps avoid evaporation of pore solution. This can be conveniently conducted, given successful AFM studies in controlled RH.[Reference Sedin and Rowlen22–Reference Stukalov, Murray, Jacina and Dutcher24] This in situ method is a direct measurement on pore solution, while the ex situ method, such as extracting pore solution from cement paste by filtration inevitably decreases CNC concentration and compromises data integrity. Another benefit of this test is to improve the understanding of interaction between CNCs, charges, and the medium. So far, studies on rheological behavior of charged fluid containing CNCs focused on macroscopic interpretation, while employing AFM tip with diameter of tens of nm (or even smaller) helps to study the local rheological properties at a much smaller scale.
Hydration products
On the phase of hydration products, study at one spot is less meaningful, since of interest is the CNC distribution mapping in one area. Therefore the investigation is conducted with a scanning-based approach. It was reported[Reference Cao, Tian, Bahr, Zavattieri, Youngblood, Moon and Weiss5] that a significant increase in elastic modulus was induced by CNCs in the hydration products at different contact depths of nanoindentation. The difference in elastic modulus is due to two possible reasons, the high elastic modulus of CNCs and/or the densification effect of CNCs in the CSH. In this study, the interaction force between tip of nanoindenter and sample is studied, which has been well described in the Dejarguin–Muller–Toporov model,[Reference García and Paulo25] that a greater elastic modulus induces larger force between tip and the substrate. The simulation is performed with VEDA module “amplitude-modulated scanning (basic: ambient or vacuum only)”. Amplitude modulated [or amplitude modulation (AM)] or tapping mode AFM only contacts the sample with the tip during part of the oscillation cycle, reducing sample damage and tip wear while performing fast scanning. It has been successfully demonstrated to map elastic modulus of materials such as ductile polycaprolactone (~0.5 GPa) and rigid silicon (~165 GPa).[Reference Hurley, Kocun, Revenko, Ohler and Proksch26] A feasible and facile method to prepare cement paste sample for AFM scanning is to cast pristine cement paste on flat substrate to generate a replication surface, such as the mica-replication method, which results in a surface with z-heights of 4–20 nm.[Reference Yang, Keller and Magyari27]
Results
Frequency sweep in pore solution
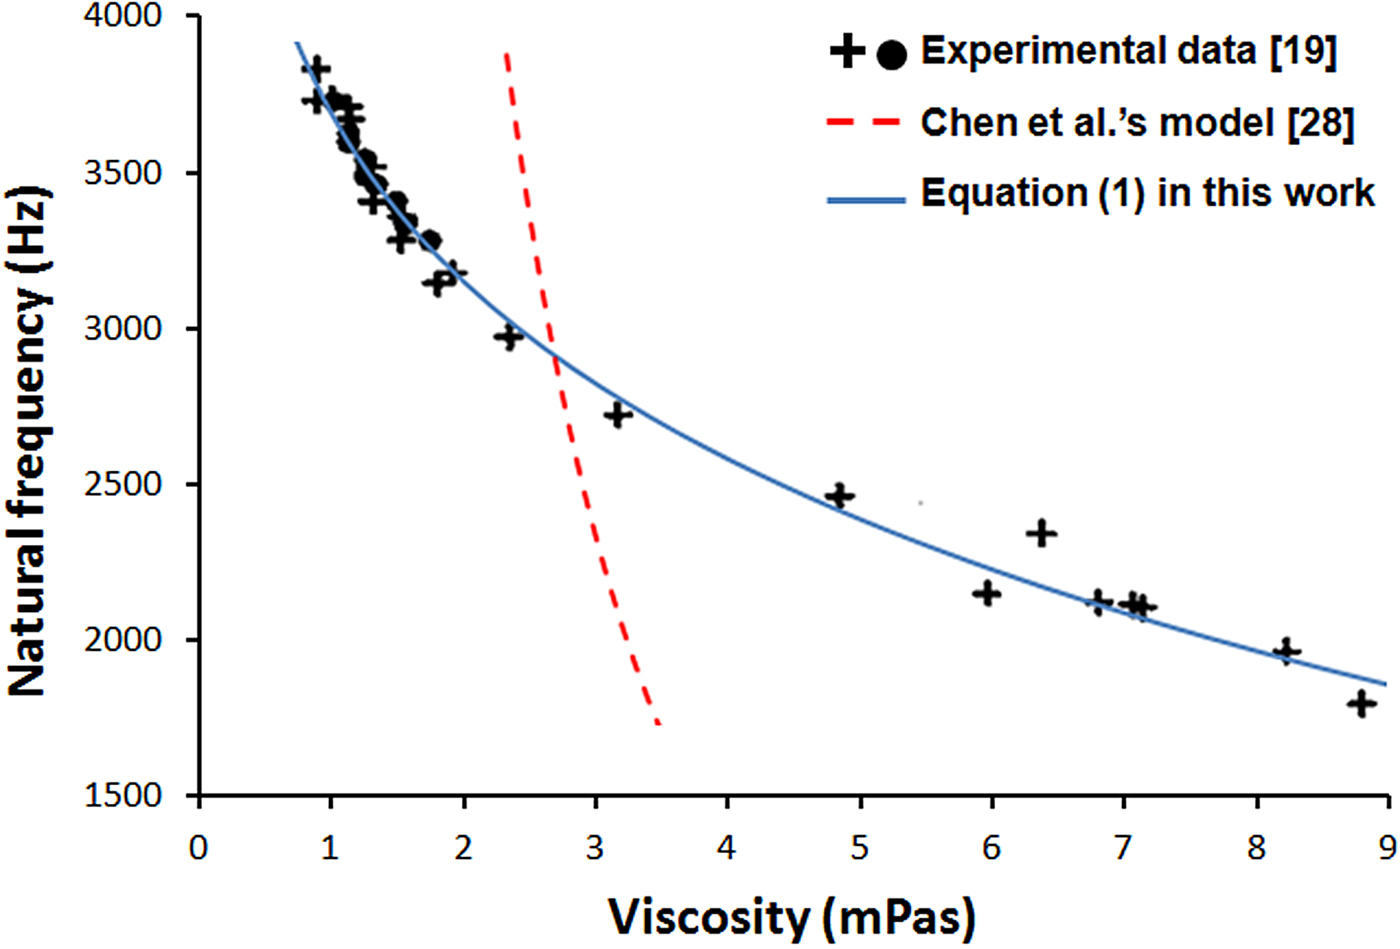
Chen et al. provided an analytical solution correlating ω n with viscosity of the fluid.[Reference Chen, Warmack, Thundat, Allison and Huang28] However, this equation exhibited inaccuracy when it was applied to experimental data, e.g., the results by Ahmed et al.[Reference Ahmed, Nino and Moy19] A modified model is presented here
 $$\eqalign{\omega _{\rm n} & = 1/8(\sqrt {9{(K\rho (\ln \left( {\,p_1\eta + 1} \right) + p_2\eta ))}^4 + 64\omega _0^2} \cr & \quad - 3(K\rho ({\rm ln}(\,p_1\eta + 1) + p_2\eta ))^2),}$$
where ρ and η are the density and viscosity of the fluid, K a constant for a given cantilever, ω 0the resonant frequency of the oscillator in vacuum, p 1 and p 2 fitting coefficients. Since the influence of viscosity is much larger than density, the latter is often treated as a constant.[Reference Ahmed, Nino and Moy19] This modified model satisfies the identical boundary conditions (viscosity = 0 and ∞) as those of Chen et al.’s equation. Equation (1) presents much better consistency with experimental data, as shown in Fig. 1.
The relationship between natural frequency and viscosity. Part of the figure (Experimental data) is reproduced with permission from Ref. Reference Ahmed, Nino and Moy19. Cambridge University Press, 2001.

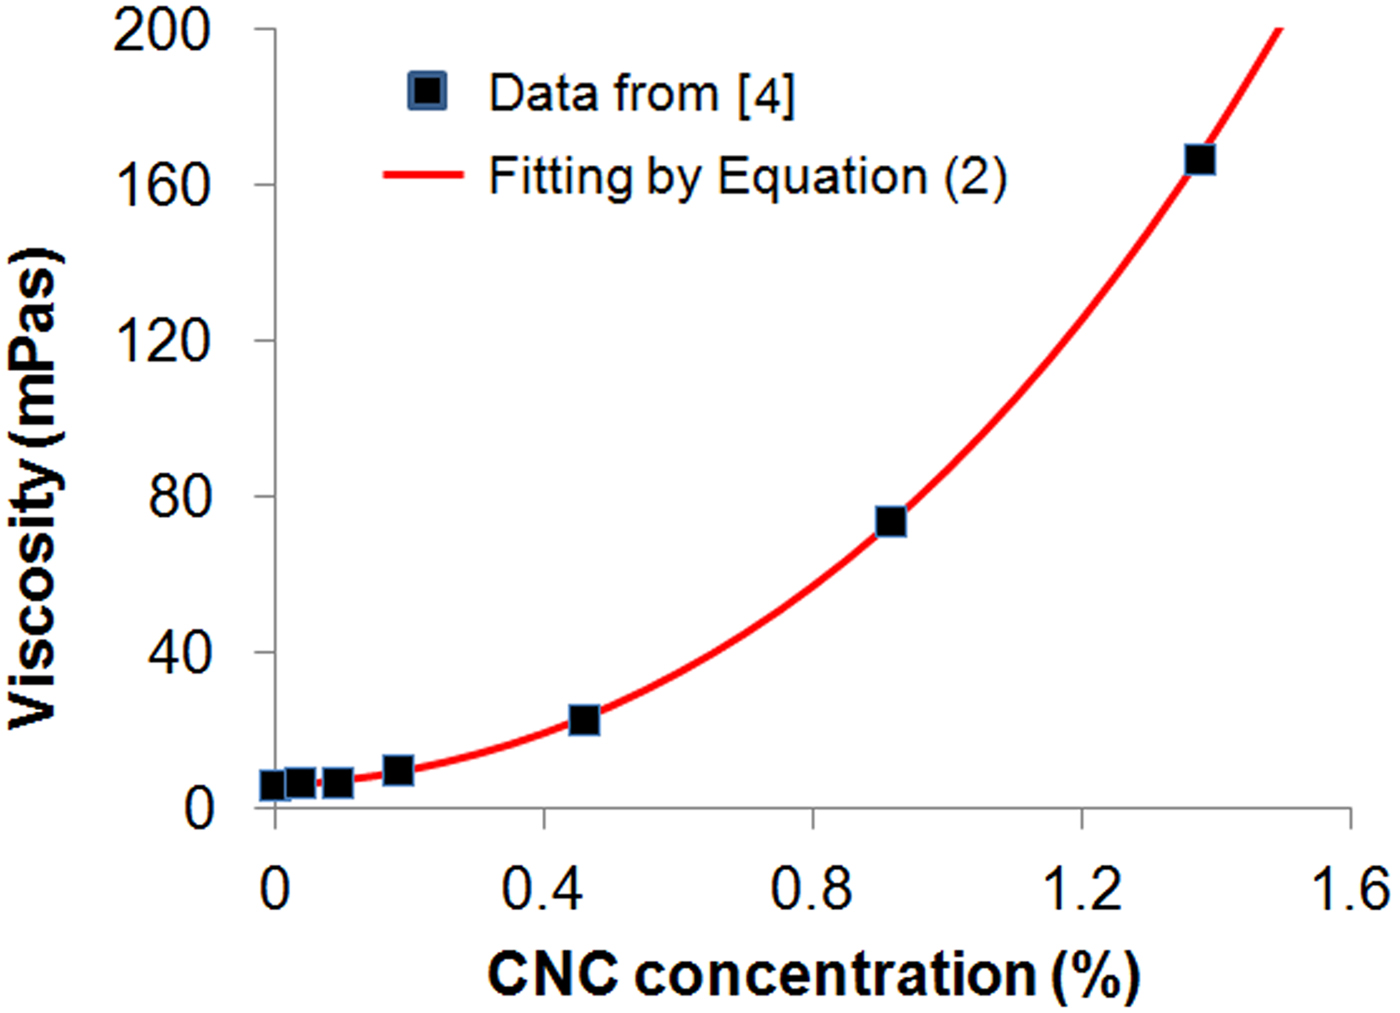
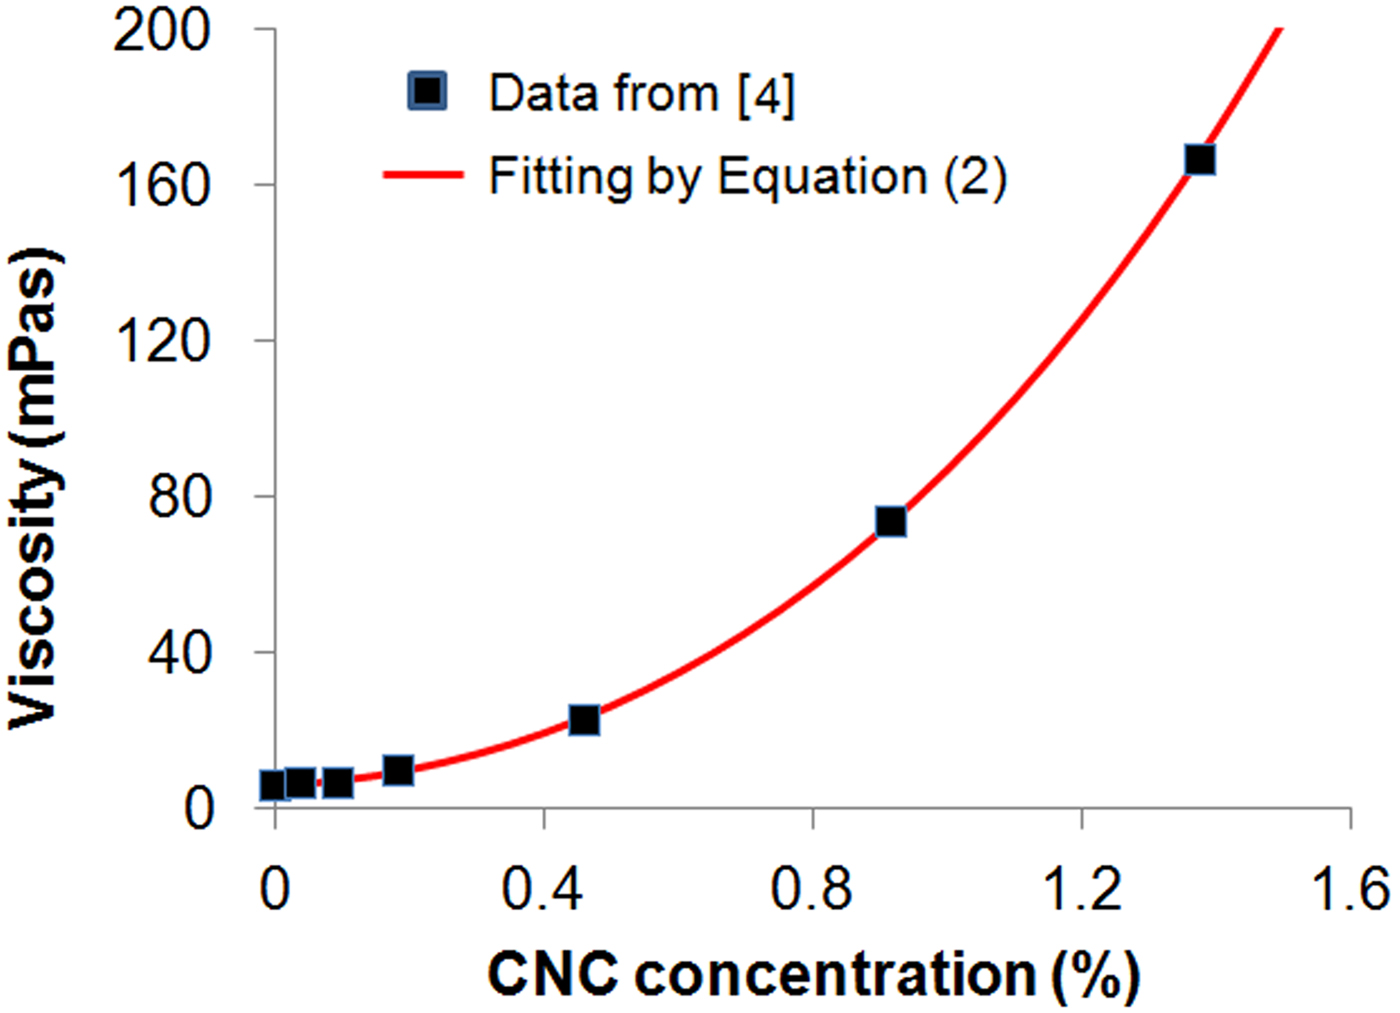
The relationship between CNC concentration (C) in pore solution and ω n can be conveniently determined by experiments. First, the pore solutions at different ages can be prepared according to published data, e.g., by Rajabipour et al.[Reference Rajabipour, Sant and Weiss18] (for better accuracy, the composition of pore solutions at designated ages can be determined with the method by Rajabipour et al.). The second step is to measure the ω n for pore solutions with varying C. This ω n–C curve serves as a standard to determine the CNC concentration in situ. Cao et al. gave a relationship between C and viscosity of pore solution,[Reference Cao, Zavattieri, Youngblood, Moon and Weiss4] which is used as a demonstration for simulation in the present work. An exponential–linear equation is used to fit the data:
 $$\eta = q_1 + q_2C + q_3\exp {\kern 1pt} (q_4C).$$
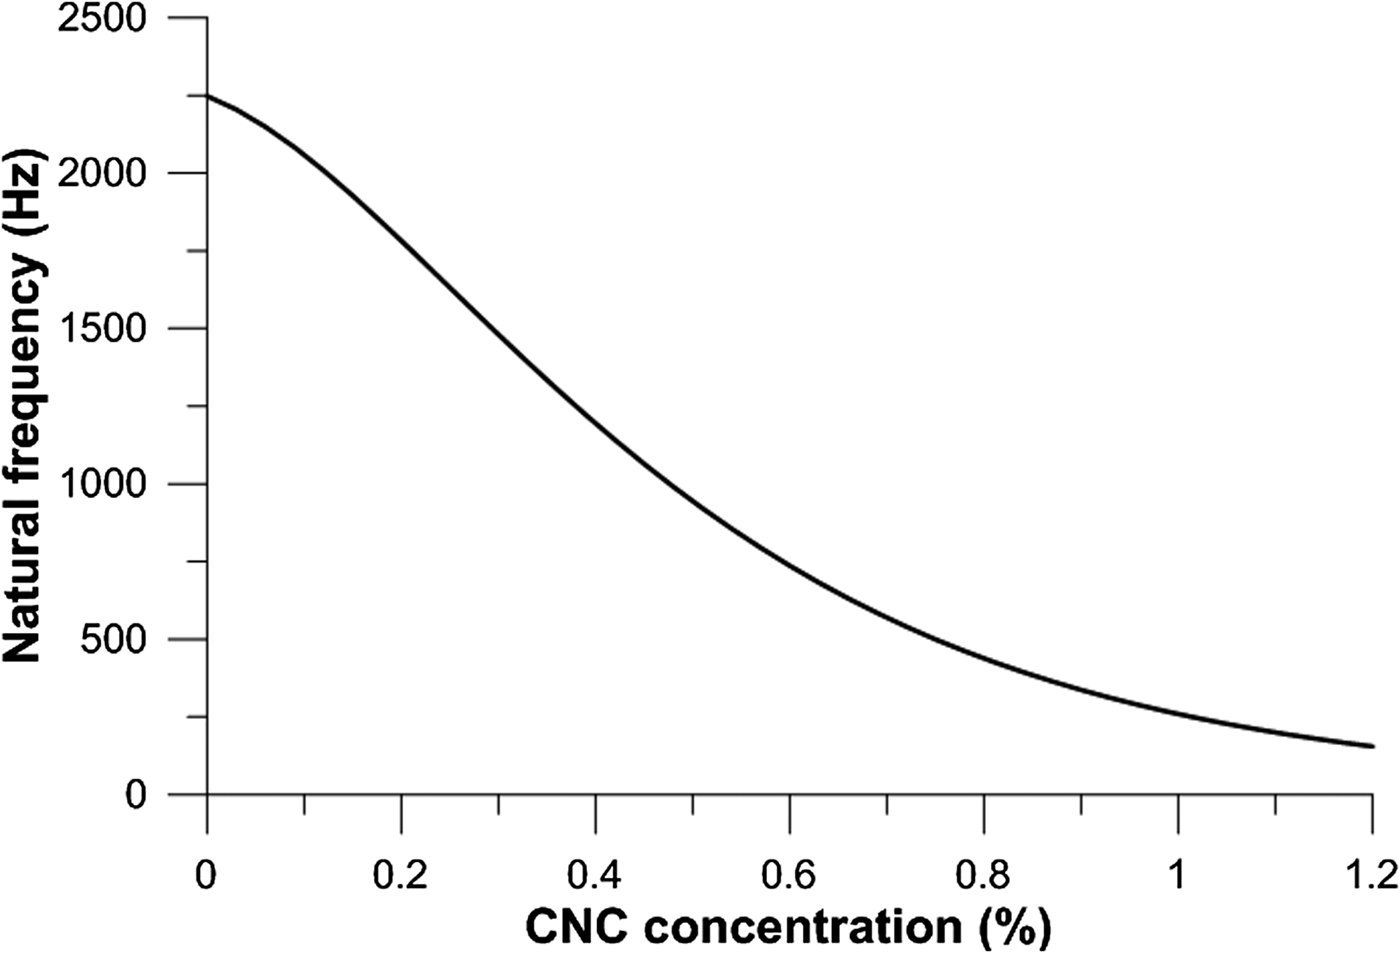
where q 1 and q 3 are related with the viscosity of the pore solution without CNCs (q 1 + q 3), the coefficients q 2 and q 4 strongly depend on CNC properties and their interaction with charges. The fitting of the results from Ref. Reference Cao, Zavattieri, Youngblood, Moon and Weiss4 is provided in Fig. 2 and the relationship between ω n and C is provided in Fig. 3.
The relationship between pore solution viscosity and CNC concentration.
The relationship between natural frequency of AFM oscillation (ω n) and CNC concentration (C) in pore solution.

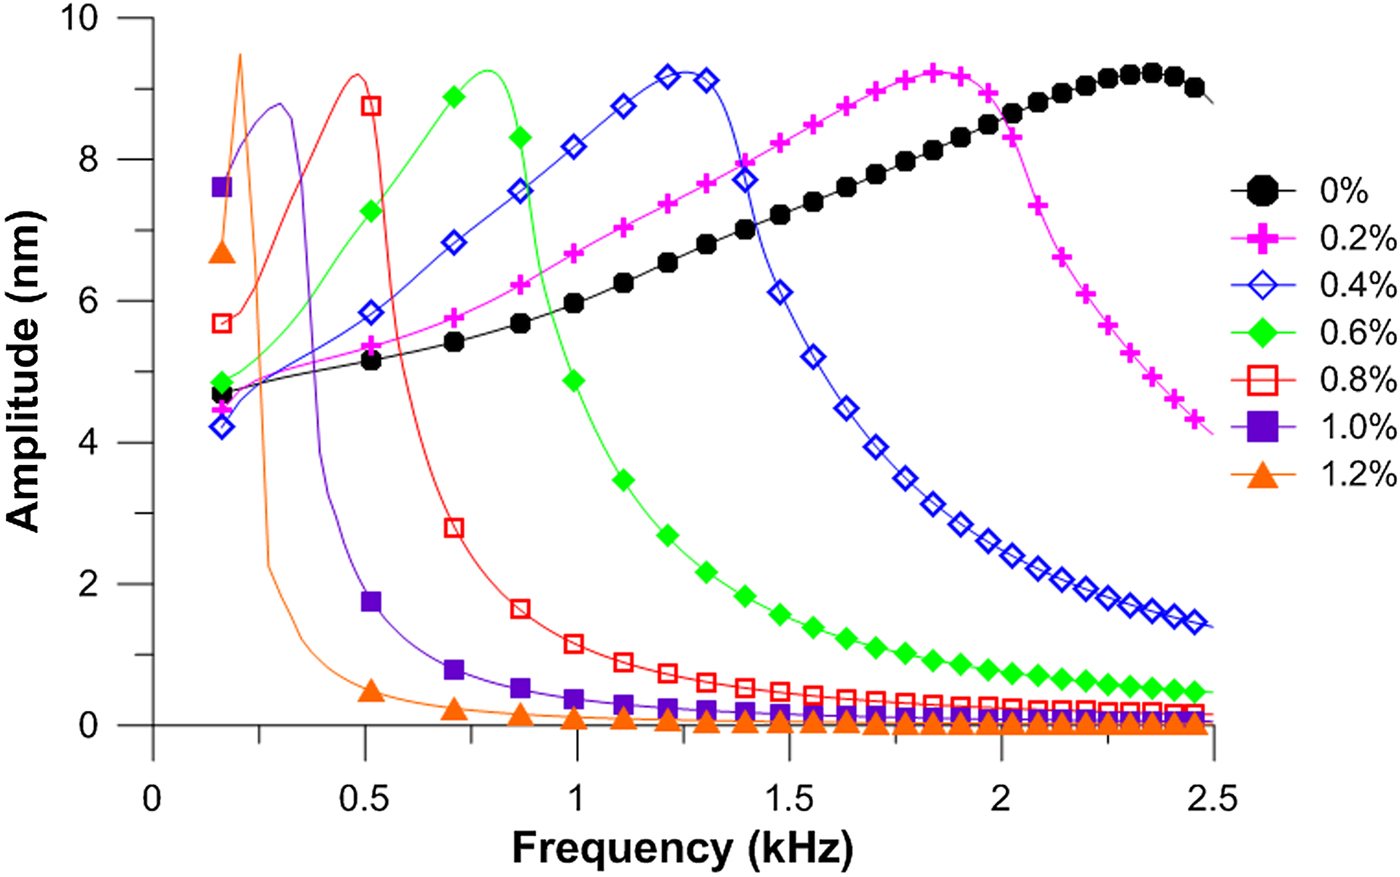
Seven different CNC concentrations are selected from 0% to 1.2% to simulate the frequency sweep behavior and the results are shown in Fig. 4. As expected, for each sweep the amplitude increases when ω approaches ω n, and then quickly decreases after it passes ω n. This behavior is due to the fact that the maximum oscillation amplitude is achieved at the resonance. When the pore solution contains more CNCs, resulting in an elevated viscosity, the position where the maximum amplitude is reached (ω n) shifts to the left, which is characteristic of the CNC concentration. This method opens up opportunities of high accuracy quantitative determination of in situ CNC concentration evolution in pore solution at early ages (<a few hours).
The frequency sweep behavior in pore solutions with different CNC concentrations.

AM scanning on hydration products
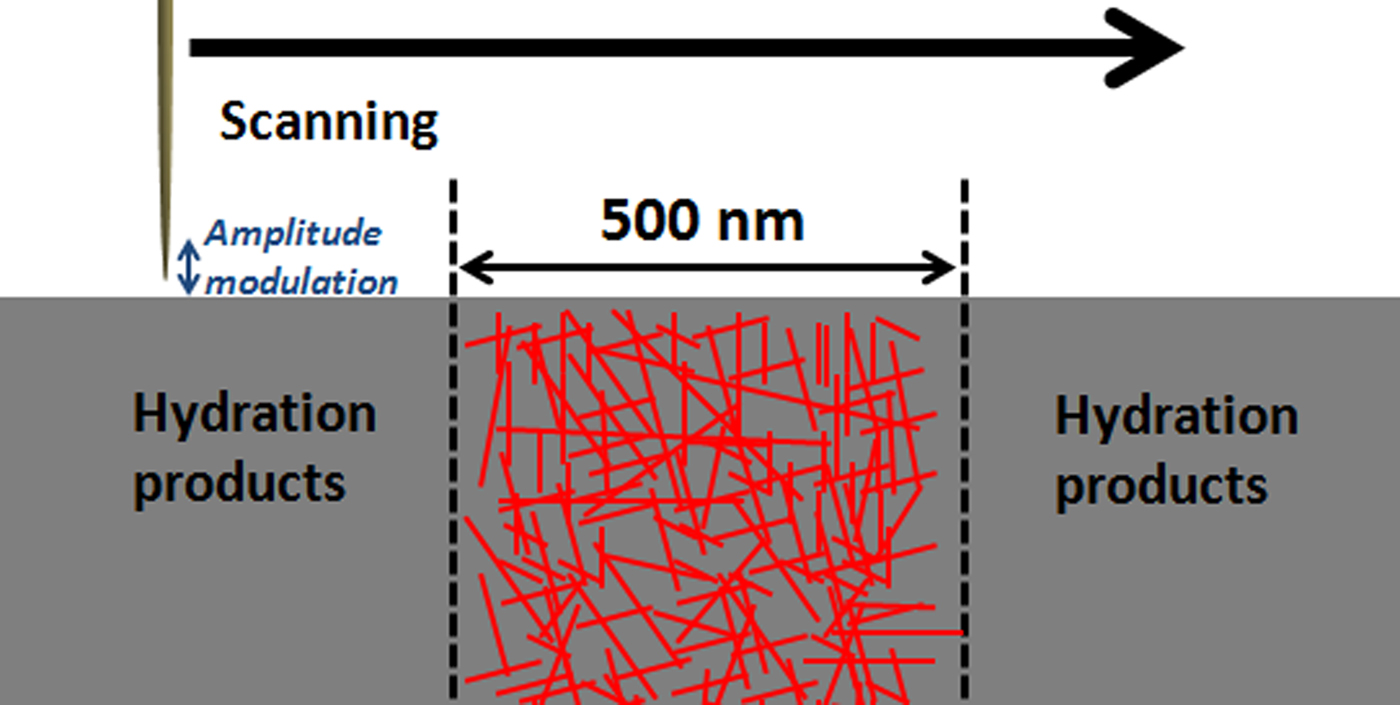
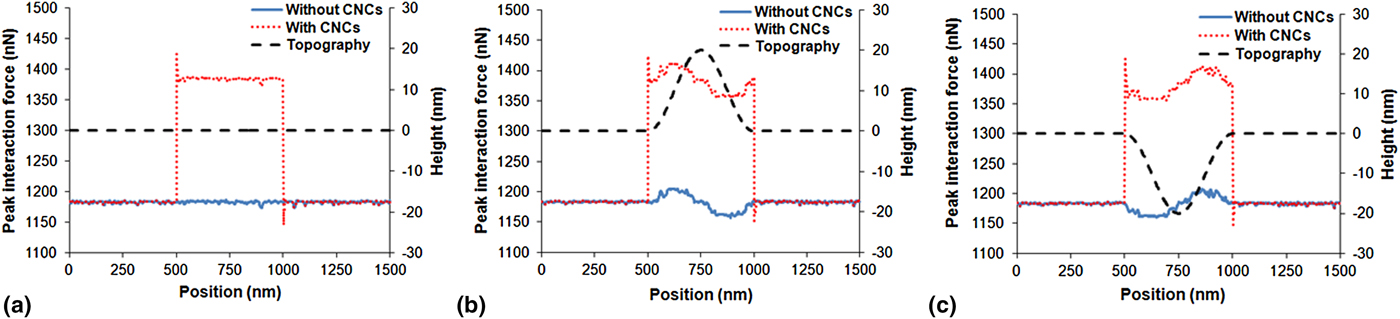
The scanning can be performed along hydration products of a cement paste sample at any age after setting. In this simulation, the scanning encounters three regions: hydrations products without CNCs, a 500-nm wide CNC-rich region, and another region without CNCs, as shown in Fig. 5. The elastic modulus of the hydration products is designated as 50 GPa, while that of the CNC-rich region is 95 GPa, according to Ref. Reference Cao, Tian, Bahr, Zavattieri, Youngblood, Moon and Weiss5. The result is compared with a sample without CNCs. In addition to this plane surface, two other topographies are studied: dome and basin. For these two scenarios, the middle 500-nm wide CNC-rich region has height of 20 or −20 nm compared with near surroundings, as described in Fig. 6.
AM–AFM scanning along the three regions of hydration products.

The peak force along the scanning for (a) plane surface; (b) dome; (c) basin.

Figure 6 shows the interaction force along scanning on the samples with three surface topographies. For the plane surface [Fig. 6(a)], the repulsive force on the CNC-rich region is approximately 1384 nN, which increases by almost 20% compared with the region without CNCs (~1181 nN). This is because that a more rigid substrate is reluctant to deformation and therefore exerts higher resistance to the tip. This phenomenon has been well described and verified in literatures.[Reference García and Paulo25, Reference García and Paulo29, Reference Hoummady, Rochat and Farnault30] This distinguishable difference allows a reliable analysis of CNC distribution in the hydration products. It is not surprising that the force fluctuates on the surface of the dome and basin, as the tip scans in a “trial and error” manner. When the tip encounters the obstacle, i.e., the region of 500–750 nm in Fig. 6(b), the force is elevated abruptly and therefore higher than the force detected in the same region in Fig. 6(a). While the feedback loop of AFM controls the tip position to maintain a constant distance from the surface, the position can only be adjusted after the tip hits the obstacle. Similarly, when the tip initially enters the basin [region of 500–750 nm Fig. 6(c)], the tip loses the contact (it taps nothing). While the tip is lowered to follow the curvature of the basin, there is still a lag between this adjustment and lateral movement. Although a surface roughness introduces some variation in interaction force, it is important that this variation is much smaller than the influence from elastic modulus.
Conclusion
Two VEDA simulations performed in this study, frequency sweep on pore solution, and amplitude-modulated scanning on hydration products, have successfully characterized CNC distribution in cement pastes with high resolution. Two VEDA simulations are performed to characterize CNC distribution in cement pastes. CNCs significantly increase viscosity of pore solution, resulting in a decreased natural frequency of AFM oscillation. Frequency sweep is used to target the maximum oscillation amplitude where natural frequency is located. A clear shift in frequency sweep behavior is observed with increasing CNC concentration and this in situ method can be employed to conveniently study the concentration evolution in pore solution of early-age cement pastes. For hydration products, the AM scanning shows a change in tip-sample force by almost 20% from hydration products containing no CNCs to CNC-rich region, due to the increased elastic modulus. It is found that the topography of a cement paste sample for AFM produces a much smaller variation in the interaction force and therefore, the AM scanning is capable of providing low-noise data to characterize CNC distribution in hydration products.