Introduction
Accelerator mass spectrometry (AMS) technology, developed in the late 1970s (Bennett et al. Reference Bennett, Beukens, Clover, Gove, Liebert, Litherland, Purser and Sondheim1977; Nelson et al. Reference Nelson, Korteling and Stott1977), is an isotopic analysis technique capable of measuring with a rather high sensitivity (14C/12C isotopic ratio∼10–15), and the system requires a minimal amount of sample (at microgram level) (Ruff et al. Reference Ruff, Szidat, Gäggeler, Suter, Synal and Wacker2010). The system integrates particle acceleration and mass spectrometry to achieve efficient separation of ions with different m/q. This technology has enhanced the efficiency of radiocarbon dating by enabling analysis of smaller samples, accelerating measurement times, and facilitating a wider range of applications. The compact MICADAS, designed by ETH Zurich and manufactured by Ionplus AG Corp, provides an efficient platform for easy-to-operate and high-precision 14C measurement (Synal et al. Reference Synal, Stocker and Suter2007; Wacker et al. Reference Wacker, Bonani, Friedrich, Hajdas, Kromer, Němec, Ruff, Suter, Synal and Vockenhuber2010a). The AMS-based 14C dating with MICADAS can provide a relatively precise chronological framework up to about 50,000 years, and the system has been shown to have played a more and more important role in geological and archaeologic research (Bronk Ramsey, Reference Bronk Ramsey2008; Cao et al. Reference Cao, Wang, He, Guo, Jull, Zhou, Dong and Chen2023; Higham et al. Reference Higham, Douka, Wood, Bronk Ramsey, Brock, Basell, Camps, Arrizabalaga, Baena and Barroso-Ruíz2014; Jou et al. Reference Jou, Macario, Pessenda, Gomes, Oliveira, Pedrosa, Alves, Fallon, Santos, Maniesi and Bastos2025; Kang et al. Reference Kang, Park and Kyung-Ryul2001; Zhang et al. Reference Zhang, Lu, Gu, Lin, Shi, Shi, Liang, Wang, An, Ma and Leavitt2024).
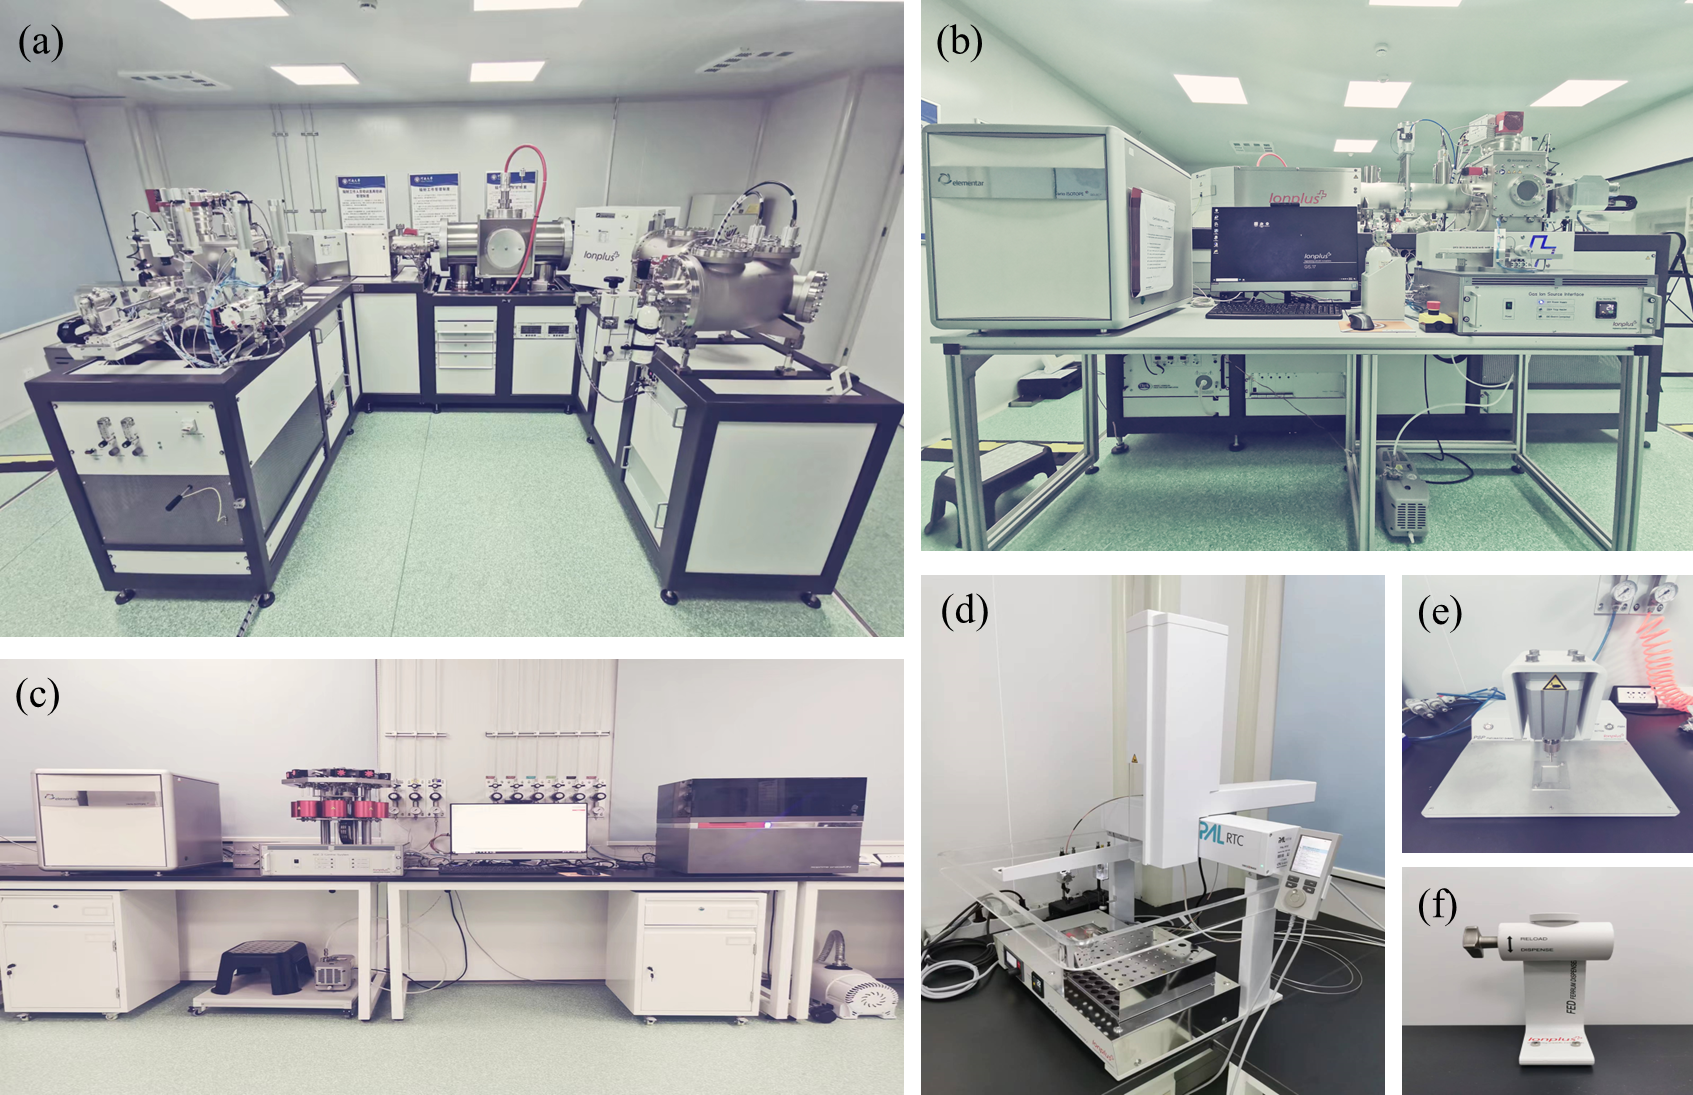
A 200 kV Mini Carbon Dating System (MICADAS) was installed and has been in operation since June of 2023 at Henan University (namely the HENU-AMS Laboratory). The MICADAS system (Figure 1a) is mainly composed of a 200 kV tandem accelerator, a helium gas stripping, a gas ionization detector, and a Cs sputter ion source compatible with both solid and gas cathodes. The laboratory is also equipped with an Automated Graphitization System (AGE3, Figure 1c) and a Carbonate Handling System (CHS-2, Figure 1d), ensuring high-throughput preparation of 14C samples and enabling measurements on both organic and inorganic samples. The HENU-AMS Laboratory has achieved a precision of 8‰ (in modern gaseous standards) in measuring gaseous targets. It should be mentioned that the laboratory also has a Gas Ion Source Interface System (GIS), and the GIS (Figure 1b) has proven to be highly effective in analyzing gaseous and small samples (Hoffmann et al. Reference Hoffmann, Friedrich, Kromer and Fahrni2017; Molnár et al. Reference Molnár, Mészáros, Janovics, Major, Hubay, Buró, Varga, Kertész, Gergely, Vas, Orsovszki, Molnár, Veres, Seiler, Wacker and Jull2021; Wang et al. Reference Wang, Zhang, Ning, Xu and Zhao2023). Considering the fact that the majority of our dating targets are solid samples, this report will focus on solid samples. The system is controlled by a suite of software including Chameleon (Measurement Sequence), Lama (Laboratory Management), Prepma (Target magazine Information Entry), Squirrel (Measurement Control), Nemo (Monitoring Measurement and Tuning/Scanning), and BATS (Beautiful AMS Tool of Switzerland) for data processing and normalization. All data are stored in a MySQL database, enabling unified management of client information, sample information, and sample results, and also allowing for online data evaluation (Wacker et al. Reference Wacker, Christl and Synal2010b). Radiocarbon dating data are reported as “Fraction Modern” (F14C) and also as “percent Modern Carbon” (pMC) and as 14C age (Reimer et al. Reference Reimer, Austin, Bard, Bayliss, Blackwell, Bronk Ramsey, Butzin, Cheng, Edwards and Friedrich2020).
(a) Mini Carbon Dating System (MICADAS-26 installed at HENU); (b) Gas Ion Source Interface System (GIS); (c) Automated Graphitization Equipment (AGE3); (d) Carbonate Handling System (CHS-2); (e) Pressing Sample Processor (PSP); (f) Ferrum Dispenser (FED).

Figure 1. Long description
The image contains six photos of different components of an accelerator mass spectrometry system. Panel A shows the Mini Carbon Dating System (MICADAS-26) installed at HENU. This system is designed for high-precision 14C measurement and is used for radiocarbon dating. Panel B displays the Gas Ion Source Interface System (GIS), which is part of the AMS technology used for isotopic analysis. Panel C shows the Automated Graphitization Equipment (AGE3), which is used to prepare samples for analysis. Panel D depicts the Carbonate Handling System (CHS-2), used for processing carbonate samples. Panel E shows the Pressing Sample Processor (PSP), which is used to prepare samples for analysis. Panel F displays the Ferrum Dispenser (FED), used for handling iron samples. These components work together to enhance the efficiency of radiocarbon dating by enabling analysis of smaller samples, accelerating measurement times, and facilitating a wider range of applications.
This paper summarizes the laboratory’s test results and the test targets include MICADAS-accompanying standard samples, background samples and age-unknown samples. Random test sequences were selected for linear comparison analysis of the standard test results. Additionally, 12 samples (including charred seeds, charcoal, and sediment) from different stratigraphic and archaeological contexts in Northwest China that were already dated in other laboratories were randomly selected for comparisons, and the laboratories include the NSF-AMS Facility at the University of Arizona, Beta Analytic Inc., and the AMS Laboratory at Lanzhou University.
Methods
Sample pretreatment
The targeting samples normally require chemical pretreatment to remove contaminants affecting dating results and to extract specific components for radiocarbon dating. All reagents used were analytical grade, and the samples were rinsed with deionized water produced by Milli-Q. This study employed the acid-base-acid (ABA) treatment method for charcoal, charred seeds, plant tissue, and organic-rich sedimentary samples. The methods used are similar with those previously reported (Brock et al. Reference Brock, Higham, Ditchfield and Bronk Ramsey2010; Jędrzejowski et al. Reference Jędrzejowski, Michczyńska, Kłusek, Michczyński, Pawełczyk, Piotrowska, Heeb and Hajdas2024; Knowles et al. Reference Knowles, Monaghan and Evershed2019; Pessenda et al. Reference Pessenda, Valencia, Camargo, Telles, Martinelli, Cerri, Aravena and Rozanski1996). Specifically, the samples were firstly ultrasonicated to remove substances attached to the surfaces. Then, an acid solution (1 M HCl, 10 mL, 60 °C water bath for 3 hr; repeated 3–5 times) was added until the solution became colorless or stopped bubbling, and the samples were subsequently rinsed with deionized water to achieve a neutral level (confirmed using pH paper). Secondly, an alkaline solution was used to treat the samples (0.5 M NaOH, 10 mL, 60 °C water bath for 2 hr; repeated 2–3 times) to remove humic acids, and the samples were subsequently rinsed with deionized water to achieve a neutral level. Thirdly, an acid solution (1 M HCl, 10 mL, 60 °C water bath for 2 hr) was used again to remove any potential carbonate precipitates formed during the base reaction with atmospheric CO2, and the samples were again rinsed with deionized water to achieve a neutral level. Finally, the samples were dried in an oven at 60 °C for 1–2 days. It should be noted that no chemical treatment was performed on the commercially available international reference materials (OX-II; NIST SRM 4900C, PhA (Phthalic Anhydride), International Atomic Energy Agency (IAEA) C1, C2, C7, C8) in this study.
Graphitization
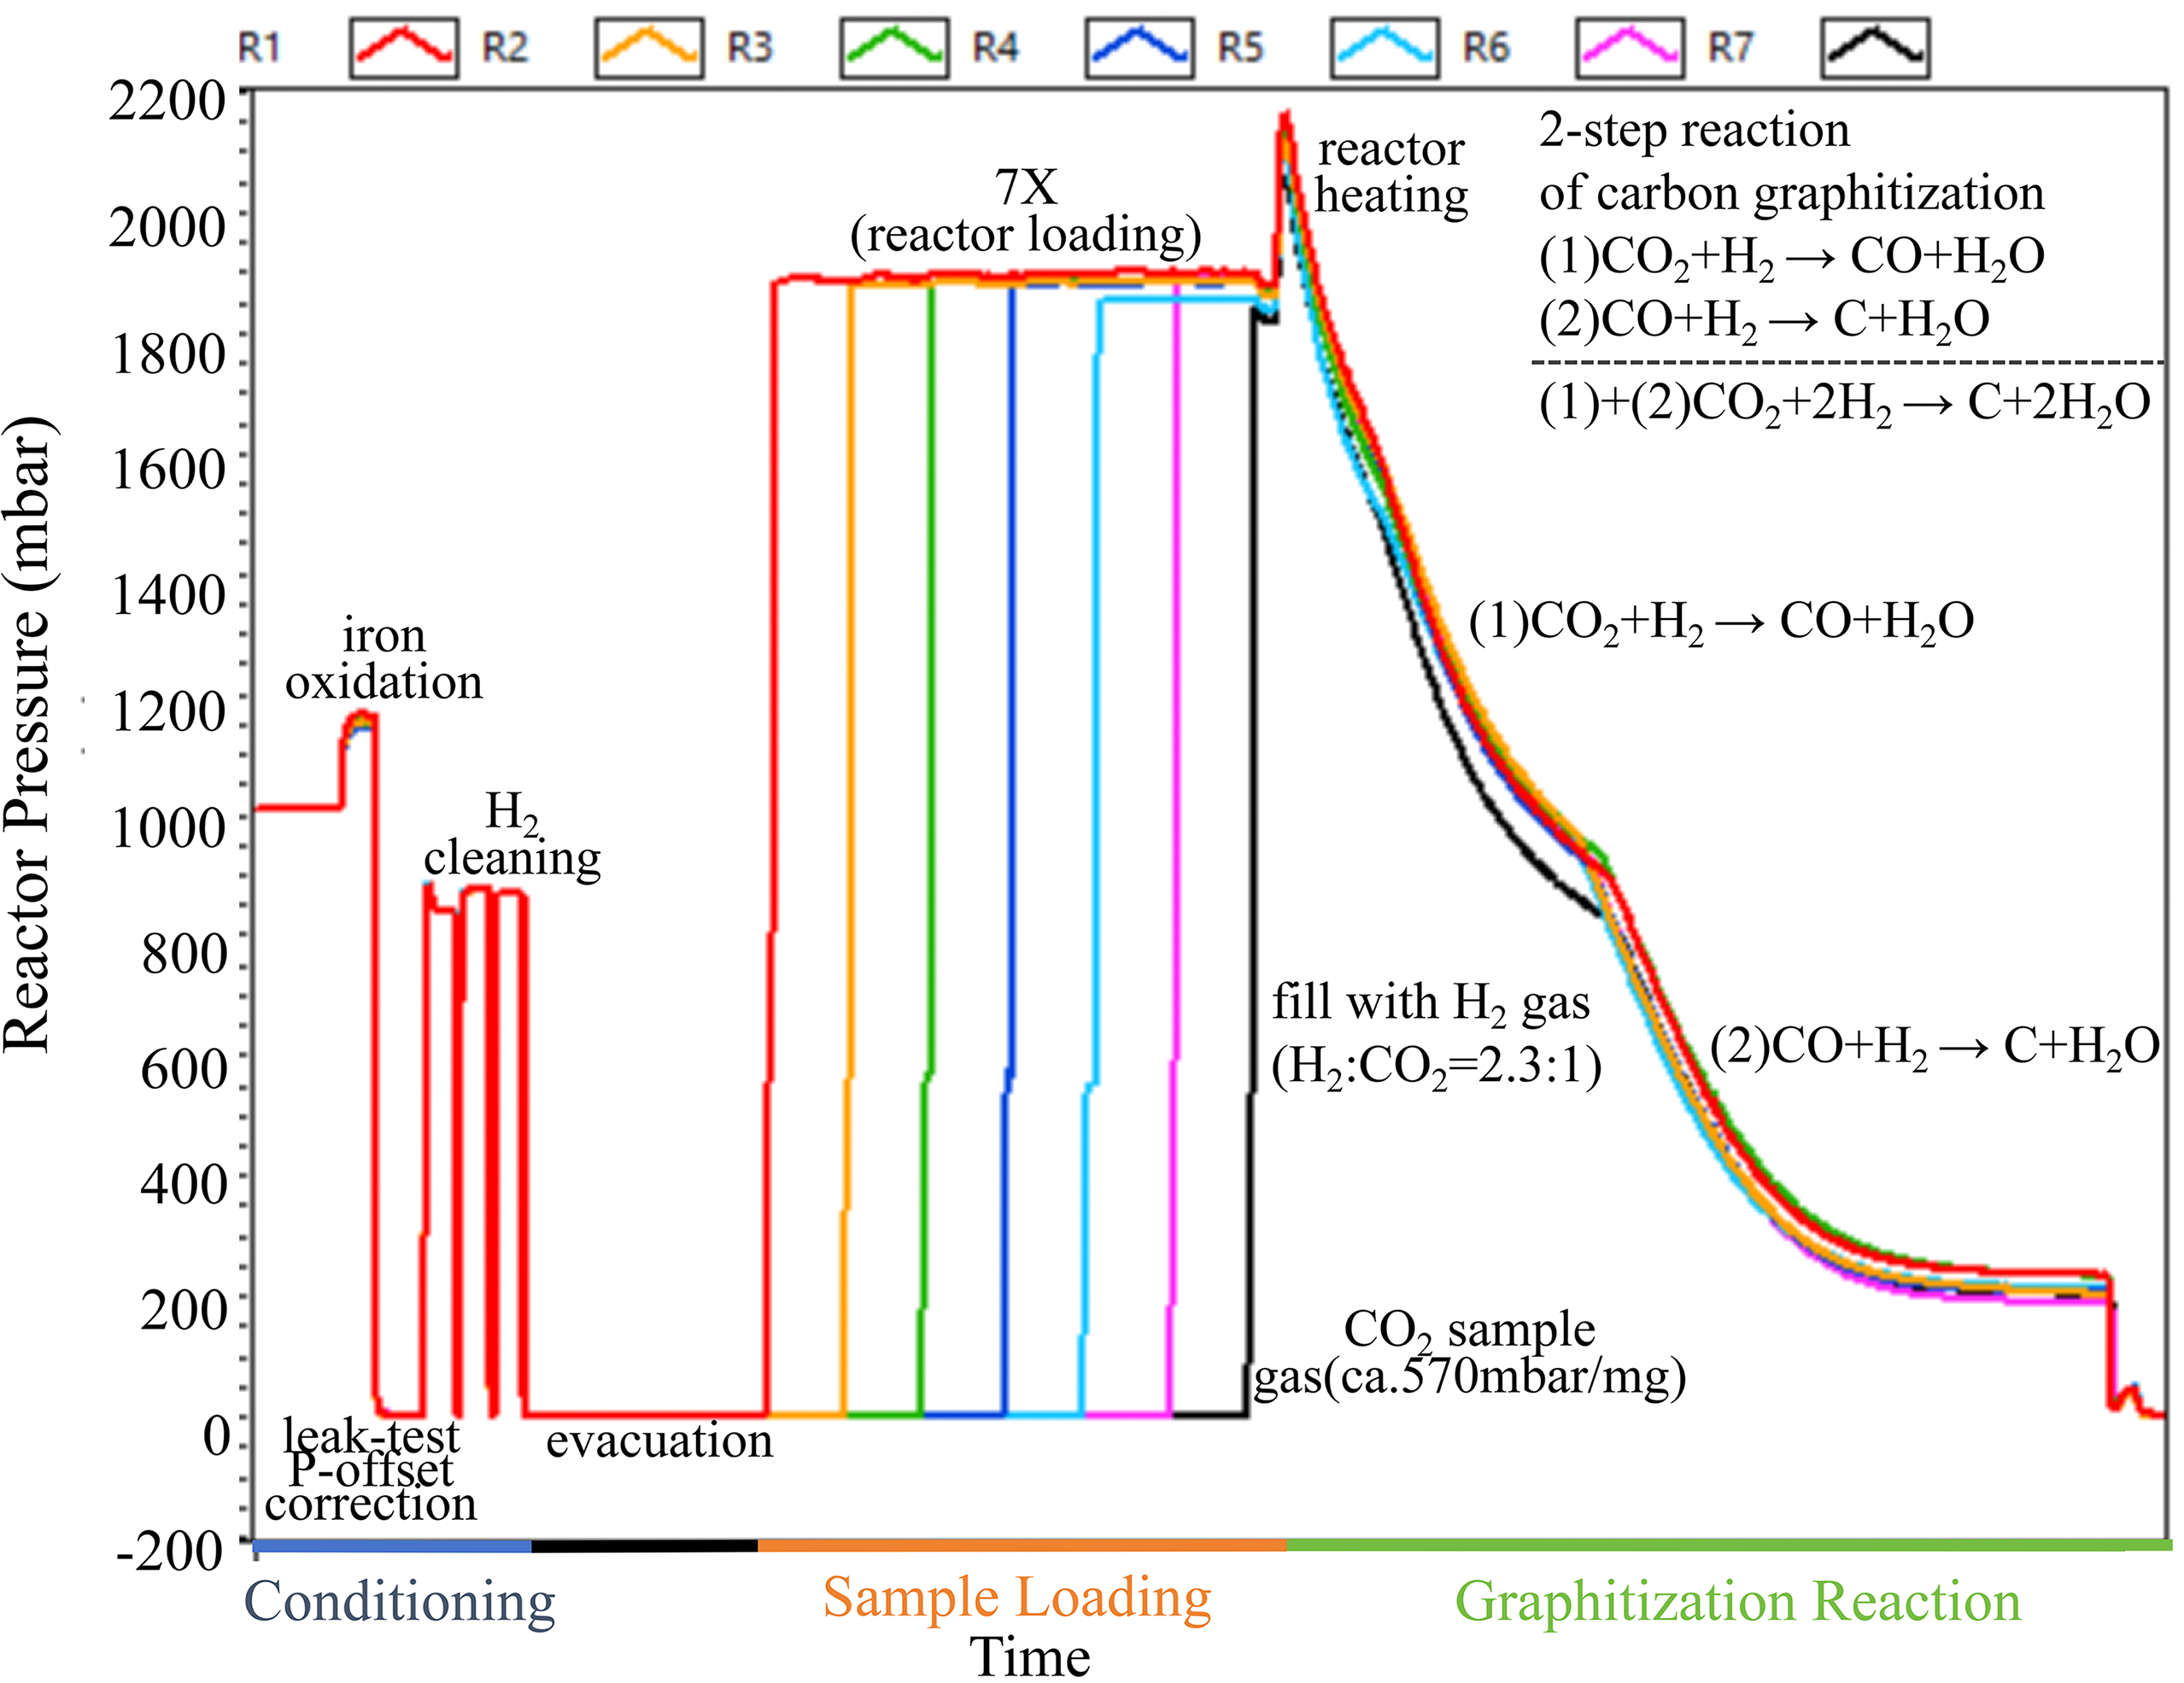
Graphitization of organic‑rich samples was carried out on the EA‑AGE3 system. Test samples were weighed according to their carbon content, encapsulated in tin capsules, and converted to CO2 by combustion in an Elemental Analyzer (EA, Vario Micro Cube, Elementar, Figure 1c). The CO2 was then transported by helium carrier gas to the zeolite trap of the AGE3, where it was desorbed at 450 °C and introduced into the reaction tube for graphitization (Němec et al. Reference Němec, Wacker and Gäggeler2010; Wacker et al. Reference Wacker, Němec and Bourquin2010c). Carbonate samples were graphitized via a CHS2 (Figure 1d). The samples underwent hydrolysis with 85% phosphoric acid, and the liberated CO2 was subsequently transferred to the AGE3. A quantified amount of iron powder (4–5 mg) was dispensed via an iron‑powder dispenser into a pre‑fired quartz reaction tube (previously heated in a muffle furnace at about 500 °C to remove potential organic contaminants). Prior to graphitization, the AGE3 system purified and activated the iron powder through three cycles of hydrogen reduction, converting iron oxides into pure iron. The sample was then combusted/hydrolyzed in the EA/CHS2 to generate pure CO2, and the CO2 was transferred into the AGE3 reaction tube. Subsequently, CO2 was reduced at 580 °C via the H2‑Fe reduction method (with a CO2‑to‑H2 partial‑pressure ratio of 1:2.3) (Wacker et al. Reference Wacker, Bonani, Friedrich, Hajdas, Kromer, Němec, Ruff, Suter, Synal and Vockenhuber2010a). Water vapor produced during the reaction was captured by a Peltier condenser, yielding graphite containing approximately 1 mg of carbon. The entire graphitization process can be monitored in real time through pressure changes in the AGE3 system; a typical pressure‑time curve is shown in Figure 2.
Time history of the automated graphitization process. Pretreatment starts with the catalyst iron powder (Alfa Aesar, Iron powder, spherical, <10 microns, 99.9%) surface (500 °C), converting surface impurities into volatile oxides and water, which are finally removed by the mechanical pump. The pretreated organic sample is combusted with CuO at 920 °C in the EA. Finally, the pretreated iron powder is used as a catalyst to trap CO2 and convert it to graphite at 580 °C.

MICADAS system for graphite
The MICADAS system and its performance have been widely reported (e.g., Boudin et al. Reference Boudin, Van Strydonck, van den Brande, Synal and Wacker2015; Christl et al. Reference Christl, Vockenhuber, Kubik, Wacker, Lachner, Alfimov and Synal2013; Mollenhauer et al. Reference Mollenhauer, Grotheer, Gentz, Bonk and Hefter2021; Molnár et al. Reference Molnár, Janovics, Major, Orsovszki, Gönczi, Veres, Leonard, Castle, Lange, Wacker, Hajdas and Jull2013; Salehpour et al. Reference Salehpour, Håkansson, Possnert, Wacker and Synal2016; Synal et al. Reference Synal, Stocker and Suter2007; Wacker et al. Reference Wacker, Němec and Bourquin2010c). Our MICADAS system running conditions for the aforementioned measurements were source cathode potential 8.786 kV; source ion potential 28.595 kV; source ionizer heating ∼120 W (depending on the age of the ionizer and conditions of the ion source), Cs reservoir 150–156 °C (to keep the HE-12C+ beam current between 30–50 μA for routine graphited sample), and accelerator 186.5kV. The cycles were fixed at 20 seconds and 15 cycles per pass. Negative ions with an energy of ∼240 keV were stripped in the stripper (using He as stripping gas) to achieve a maximum 12C beam transmission efficiency of up to 47%. A complete MICADAS magazine contains 40 cathode target positions. However, routine measurements utilize only 39 of these positions, and the first position is reserved for a cathode reference sample within the ion source. A standard experimental batch typically includes: 7 Oxalic Acid II standards (OX-II; NIST SRM 4900C), 3 Phthalic Anhydride (PhA) blanks for assessing machine background and sample processing contamination, 4 secondary standards for quality control (Wacker et al. Reference Wacker, Christl and Synal2010b), and 25 age-unknown samples. The international standard samples were used for data calculation, reproducibility monitoring, and blank correction. Before starting the operation, the ion source and accelerator voltage were optimized using OX-II to set the instrument to its optimal working state. MICADAS typically uses ∼1 mg of C to produce approximately 30–50 μA of 12C positive ion beam (HE-12C+) at the high-energy end. Each sample requires 10–15 pass measurements (Each pass consisted of 15 cycles) to obtain high-precision measurement results (<2‰) (in graphitization standards) (Wacker et al. Reference Wacker, Bonani, Friedrich, Hajdas, Kromer, Němec, Ruff, Suter, Synal and Vockenhuber2010a). Normally, a single OX-II sample measurement takes about 50 minutes, and the measurement can obtain at least 600,000–800,000 14C counts. The system uses a gas ionization chamber to detect 14C ions; the detector window is a 50 nm thick with a 5 × 5 mm Si3N4 foil, and the detector gas is isobutane (Synal et al. Reference Synal, Stocker and Suter2007).
Results and discussion
14C results from graphite measurements
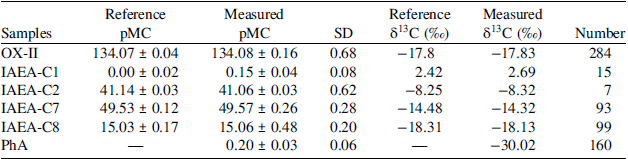
This study reports only the results for standard and blank materials. Data were processed using the BATs software (Wacker et al. Reference Wacker, Christl and Synal2010b). Measured 14C/12C ratios are reported as pMC. The measurement results are summarized in Table 1.
pMC and δ13C values for the standard samples and the background samples at HENU-AMS Laboratory during its first two years of routine operation. All of the PhA and IAEA-C1 values are reported without blank subtraction. The measured pMC mean values are presented as arithmetic mean ± standard error. All isotopic fractionation corrections were applied based on real-time measured δ13C values.

Table 1. Long description
A table comparing reference and measured values for various samples. The table has six rows and eight columns. The columns are labeled as Samples, Reference pMC, Measured pMC, SD, Reference δ13C (‰), Measured δ13C (‰), and Number. The rows are labeled with different sample names: OX-, IAEA-C1, IAEA-C2, IAEA-C7, IAEA-C8, and PhA. Each row contains values for the respective sample. For example, the first row for OX- shows Reference pMC as 134.07 ± 0.04, Measured pMC as 134.08 ± 0.16, SD as 0.68, Reference δ13C (‰) as -17.8, Measured δ13C (‰) as -17.83, and Number as 284. The table provides a detailed comparison of the reference and measured values for each sample, including standard deviations and the number of measurements.
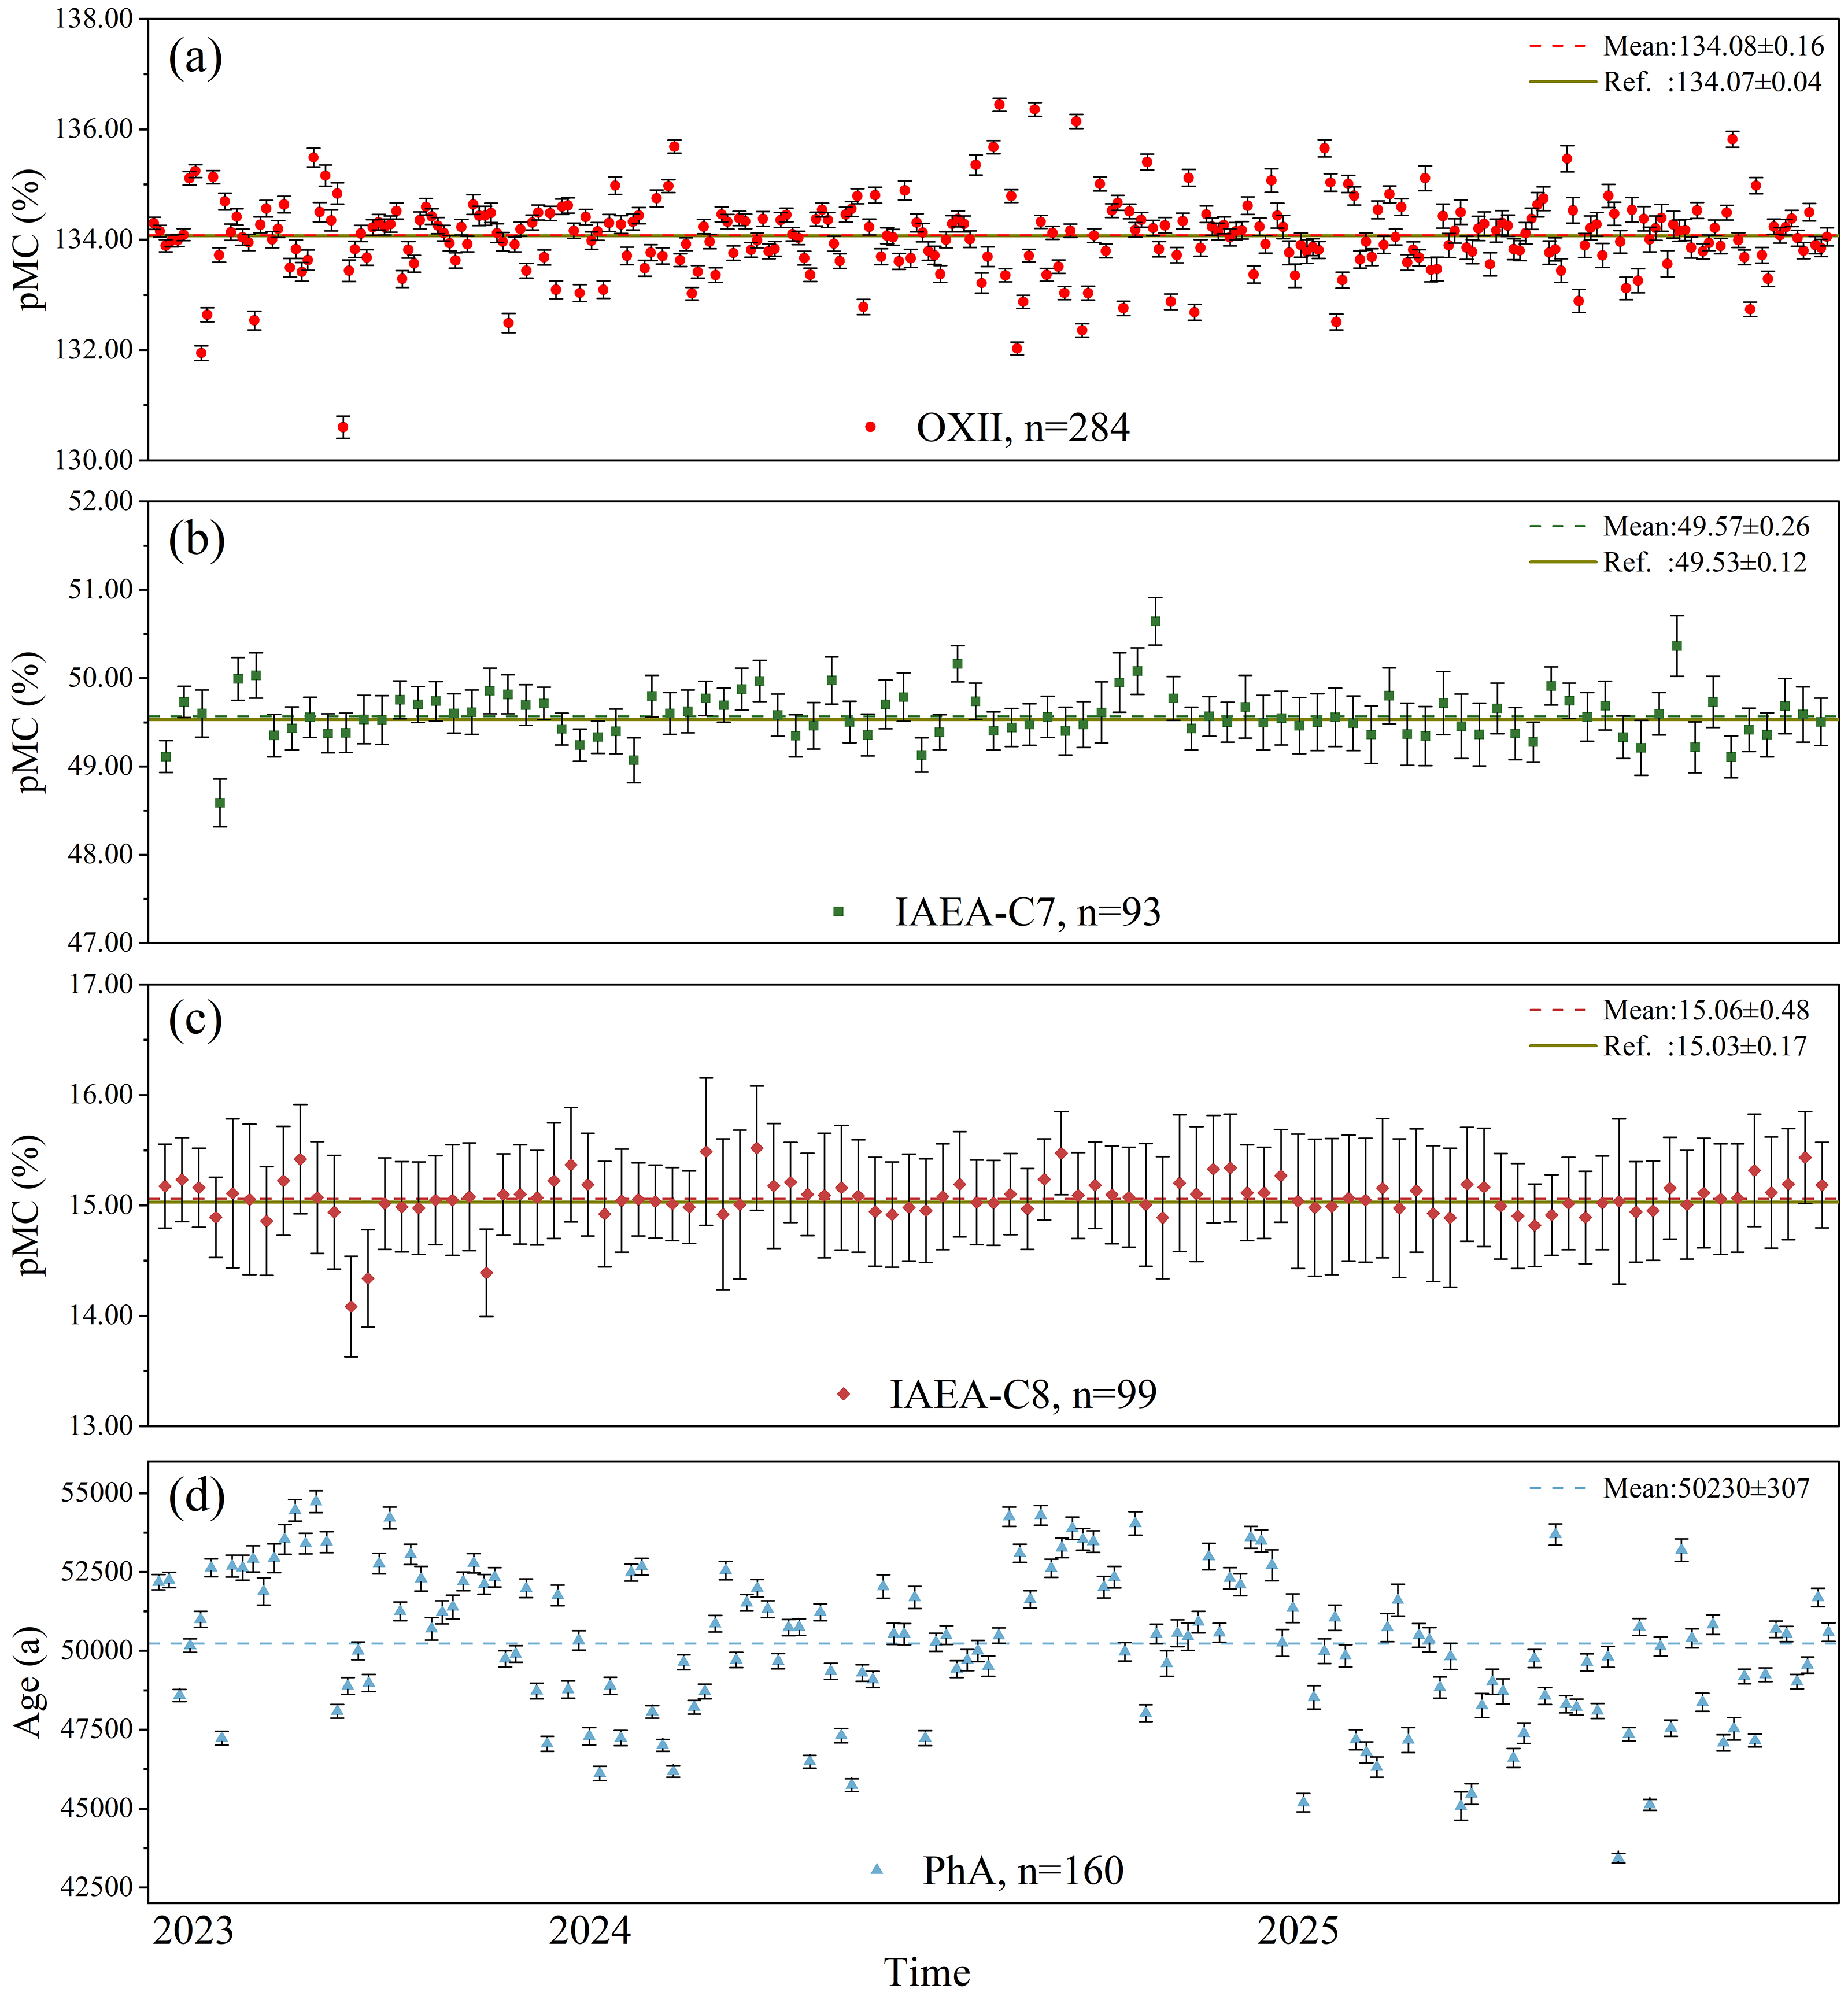
Over the two-year period, reference materials with different 14C contents were measured. Each batch of age-unknown samples was accompanied by a set of OX‑II standards, and the standards served as the primary normalization reference throughout the combustion, graphitization, and AMS measurement processes. Normally, these were included per batch, and each batch was subjected to 15 measurement passes to accumulate approximately 600,000 counts for the OX‑IIs. Based on 284 OX‑II measurements, the mean pMC value was determined to be 134.08 ± 0.16 (mean ± standard error, 1σ). The long-term measurement data show that their fluctuations remain within the expected margin of error, demonstrating the stability and reliability of the data. It should be particularly noted that the BATs software may affect the calculated pMC value of the normalization standards and the associated uncertainties cannot be manually adjusted. To eliminate the need for any manual data adjustment, the BATs software automatically processes all raw system data (including currents and measurement time) by applying normalization and correction, eliminating the need for any manual data handling (Wacker et al. Reference Wacker, Christl and Synal2010b). Therefore, the mean value and its error for the OX‑II standards are reported here to characterize the performance of the MICADAS system. The precision, expressed as the relative standard deviation (RSD, is approximately 5‰ [Table 1, Figure 3a]).
pMC values for OX-II, IAEA-C7, IAEA-C8, and background age results during long-term MICADAS testing. The analysis runs are arranged chronologically from earliest on the left to most recent on the right. All individual measurements for OX-II, IAEA-C7, and C8 have been corrected.

Figure 3. Long description
The image contains four panels, each depicting a different graph related to pMC values and age results during long-term MICADAS testing. Panel A shows a scatter plot with pMC percent on the vertical axis and time on the horizontal axis. The data points are represented by red dots labeled OXII, with a mean value of 134.08 percent and a reference value of 134.07 percent. Panel B displays another scatter plot with pMC percent on the vertical axis and time on the horizontal axis. The data points are represented by green squares labeled IAEA-C7, with a mean value of 49.57 percent and a reference value of 49.53 percent. Panel C presents a scatter plot with pMC percent on the vertical axis and time on the horizontal axis. The data points are represented by red diamonds labeled IAEA-C8, with a mean value of 15.06 percent and a reference value of 15.03 percent. Panel D shows a scatter plot with age in years on the vertical axis and time on the horizontal axis. The data points are represented by blue triangles labeled PhA, with a mean value of 50230 years. Each panel illustrates the chronological arrangement of the analysis runs from earliest on the left to most recent on the right, with all individual measurements corrected.
The accuracy of the MICADAS system was evaluated by measuring IAEA reference materials with different 14C/12C ratios. These reference materials were processed as age-unknown samples, typically with two secondary standards included in each measurement batch. Based on a total of 192 measurements, the results for reference materials with varying 14C contents (C7 and C8) show an excellent agreement with their recommended values (Figure 3b, 3c and Table 1). Specifically, 93 measurements of the C7 reference material yielded a mean pMC value of 49.57 ± 0.26 (1σ) (Figure 3b and Table 1), while 99 measurements of the C8 reference material gave a mean pMC value of 15.06 ± 0.48 (1σ) (Figure 3c and Table 1). Our measured values agree well with the IAEA consented values for the reference materials (C7: pMC = 49.53 ± 0.12; C8: pMC = 15.03 ± 0.17).
The reference materials, IAEA-C1 and IAEA-C2, have reference pMC values of 0.00 ± 0.02 and 41.14 ± 0.03, respectively (Clercq et al. Reference Clercq, van der Plicht and Gröning1997; Mann Reference Mann1983; Stuiver Reference Stuiver1983). Our laboratory measurements on IAEA-C1 and IAEA-C2 yielded pMC values of 0.15 ± 0.04 and 41.06 ± 0.03, respectively, demonstrating a rather good agreement with the reference values. Furthermore, the laboratory-measured δ13C values were also quite consistent with their reference values (Table 1). The δ13C values obtained by AMS are primarily employed for correcting instrumental mass fractionation and assessing the quality of the graphitization process. It is important to note that these values reflect isotopic effects introduced during sample processing and measurement and may not represent the true δ13C composition of the original sample. For applications requiring accurate δ13C data, independent analysis by isotope ratio mass spectrometry is recommended.
For background correction, at least three 14C-free PhA standards were included in each measurement batch. The long-term measured pMC mean value for uncorrected PhA is 0.20 ± 0.03 (n = 160), which yields a background (including graphitization and machine background) equivalent to over 50,230 14C yr BP (Figure 3d). The aforementioned results demonstrate that the MICADAS system at HENU-AMS laboratory achieves a satisfactorily low background level. It should be noted that the standard materials used in this study did not undergo laboratory chemical pretreatment, and the reported background therefore reflects the combined background contributions from the AGE3 and from the AMS measurement.
Normally, after an extended period of laboratory operation, periodic elevations in background pMC values were often observed (Figure 3d). The observed elevations are primarily caused by the accumulation of trace carbon and cesium deposits on the ionizer surfaces and the extraction lenses due to prolonged intervals between ion source maintenances, and the elevations may potentially result in sample contamination (Cao et al. Reference Cao, Wang, He, Guo, Jull, Zhou, Dong and Chen2023; Ustrzycka et al. Reference Ustrzycka, Piotrowska, Kłusek, Pawełczyk, Michczyńska, Michczyński, Kozioł and Jędrzejowski2025). Additionally, extended operation and component aging within the ion source assembly can also contribute to elevated background pMC measurements (Figure 3d). Consequently, timely maintenances of the ion source has been routinely practiced.
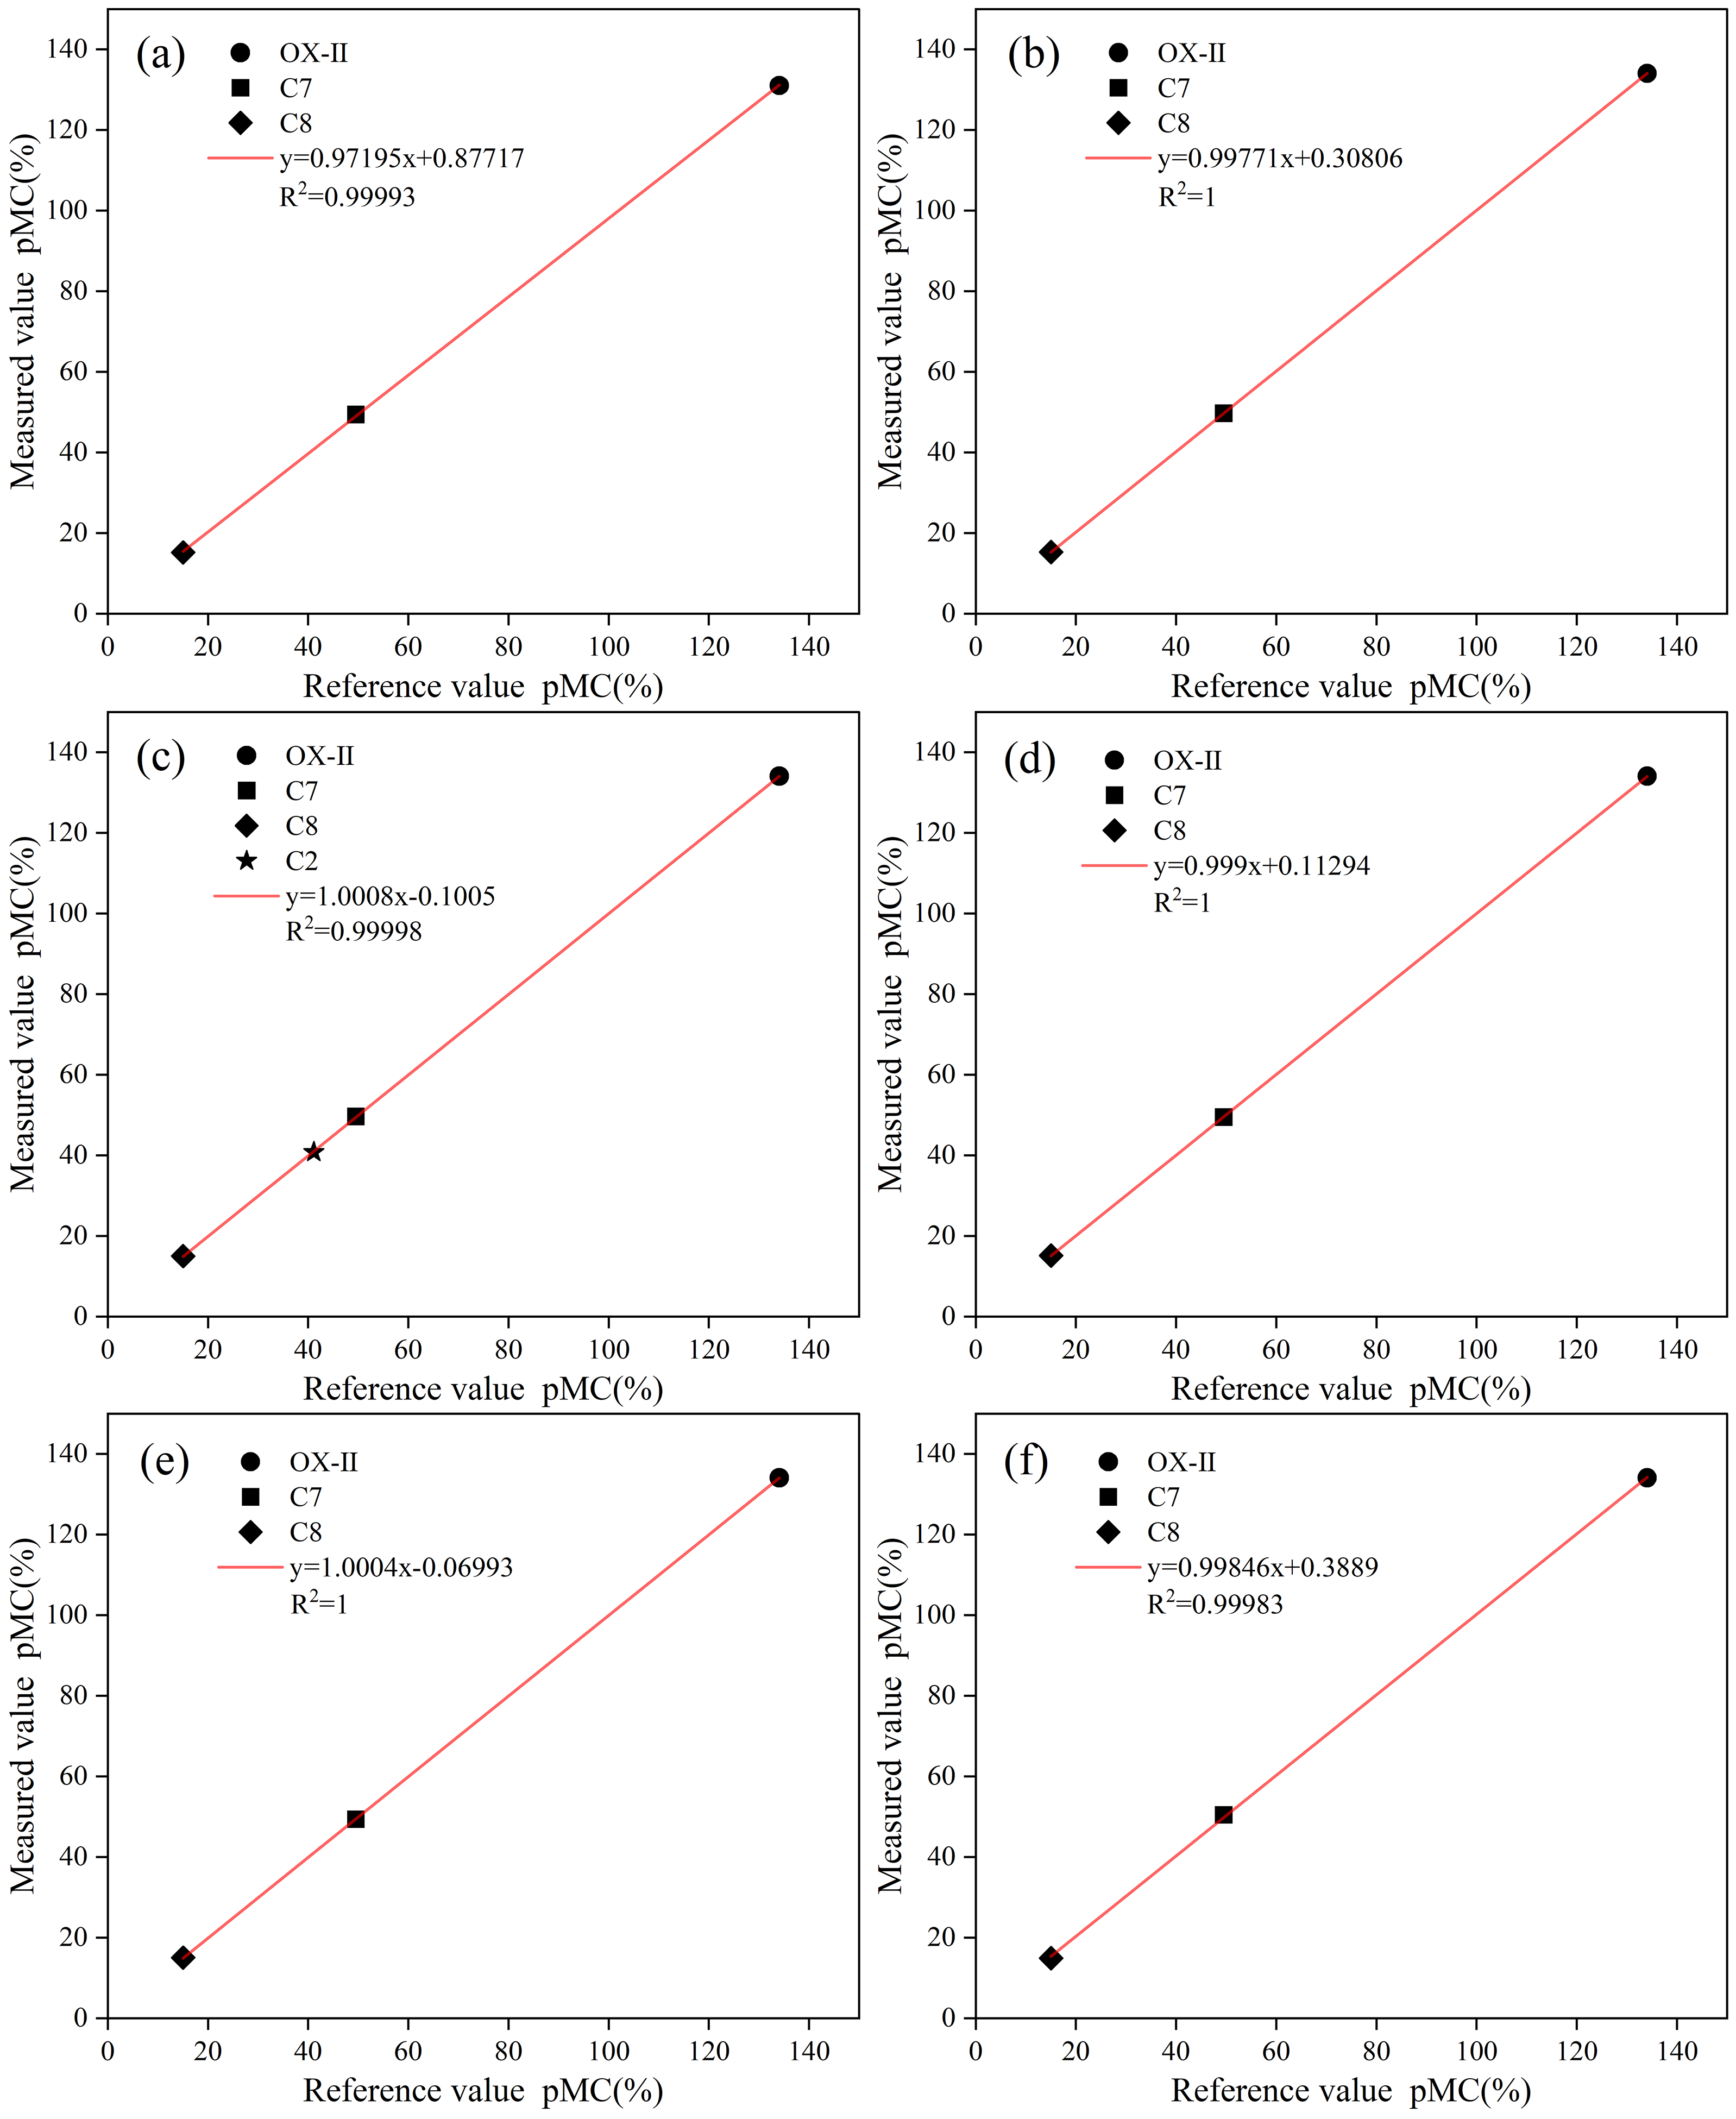
For this study, data from six analytical batches collected in the midway between two ion-source cleaning cycles were selected (clean the ion-source once for every approximately 400 samples measured). Each batch followed a standardized composition as described above. The average values for each sample type within each batch were calculated and compared with their corresponding consented reference values. The analysis results are shown in Figure 4.
Percent Modern Carbon of the measurement averages for different sample types (OX-II, IAEA-C7, and IAEA-C8) within each batch, compared with the corresponding standard consented values. Each data point represents the average value for a specific sample type in that batch. All batch averages are closely distributed around their respective standard values.

The above-reported performance of our MICADAS system shows its long-term operational stability. Specifically, the OX-II batch averages agree well with the standard value (134.07 ± 0.04 pMC), and the results for IAEA-C7 and IAEA-C8 consistently fell within their acceptable ranges.
Analysis of experimental sample measurement results
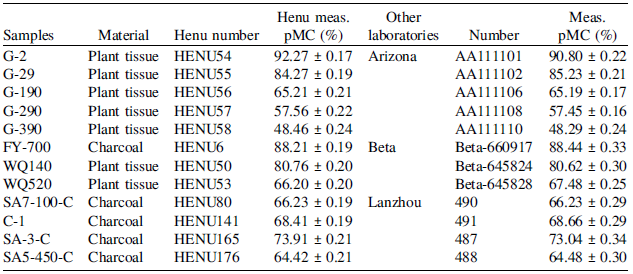
For inter-laboratory comparison, our testing focused on plant fragment and charcoal samples. All of the testing samples were distributed as blind samples to three external collaborating laboratories, where independent pretreatment and measurement were performed. The sample allocation was as follows: the NSF-Arizona AMS Facility at the University of Arizona analyzed five plant fragment samples and their results (Arizona) and our corresponding results (HENU-AMS Laboratory) are presented in Table 2; Beta Analytic Inc. analyzed one charcoal sample and two plant fragment samples and their results (Beta) and our corresponding results are presented in Table 2; and the AMS Laboratory at Lanzhou University analyzed four charcoal samples and their results (Lanzhou) and our corresponding results are presented in Table 2.
Comparison of the AMS measurement data among the HENU-AMS Laboratory, the NSF-AMS Facility at the University of Arizona, the Beta Analytic Inc., and the AMS Laboratory of Lanzhou University.

Table 2. Long description
The table presents a comparison of radiocarbon measurements of plant tissue and charcoal samples from different laboratories. It includes data from the HENU-AMS Laboratory, the NSF-AMS Facility at the University of Arizona, Beta Analytic Inc., and the AMS Laboratory at Lanzhou University. The table has 12 rows and 6 columns. The columns are labeled Samples, Material, Henu number, Henu meas. pMC (percent), Other laboratories, and Meas. pMC (percent). The rows list different samples with their corresponding data. Row 1: G-2, Plant tissue, HENU54, 92.27 percent plus or minus 0.17, Arizona, AA111101, 90.80 percent plus or minus 0.22. Row 2: G-29, Plant tissue, HENU55, 84.27 percent plus or minus 0.19, Arizona, AA111102, 85.23 percent plus or minus 0.21. Row 3: G-190, Plant tissue, HENU56, 65.21 percent plus or minus 0.21, Arizona, AA111106, 65.19 percent plus or minus 0.17. Row 4: G-290, Plant tissue, HENU57, 57.56 percent plus or minus 0.22, Arizona, AA111108, 57.45 percent plus or minus 0.16. Row 5: G-390, Plant tissue, HENU58, 48.46 percent plus or minus 0.24, Arizona, AA111110, 48.29 percent plus or minus 0.24. Row 6: FY-700, Charcoal, HENU6, 88.21 percent plus or minus 0.19, Beta, Beta-660917, 88.44 percent plus or minus 0.33. Row 7: WQ140, Plant tissue, HENU50, 80.76 percent plus or minus 0.20, Beta, Beta-645824, 80.62 percent plus or minus 0.30. Row 8: WQ520, Plant tissue, HENU53, 66.20 percent plus or minus 0.20, Beta, Beta-645828, 67.48 percent plus or minus 0.25. Row 9: SA7-100-C, Charcoal, HENU80, 66.23 percent plus or minus 0.19, Lanzhou, 490, 66.23 percent plus or minus 0.29. Row 10: C-1, Charcoal, HENU141, 68.41 percent plus or minus 0.19, Lanzhou, 491, 68.66 percent plus or minus 0.29. Row 11: SA-3-C, Charcoal, HENU165, 73.91 percent plus or minus 0.21, Lanzhou, 487, 73.04 percent plus or minus 0.34. Row 12: SA5-450-C, Charcoal, HENU176, 64.42 percent plus or minus 0.21, Lanzhou, 488, 64.48 percent plus or minus 0.30.
The aforementioned comparisons indicate that the pMC values obtained in our laboratory (HENU-AMS Laboratory) are acceptably consistent with the corresponding measurements reported by the three external laboratories. For sample, the result of G-190 (plant fragment) measured in HENU-AMS Laboratory (65.21 ± 0.21 pMC) and that the result of G-190 (65.19 ± 0.17 pMC) from the University of Arizona (65.19 ± 0.17 pMC) show only a minor difference. As another example, the result of FY-700 (charcoal) measured in HENU-AMS Laboratory (88.21 ± 0.19 pMC) is in a good agreement with the result of FY-700 measured in Beta Analytic Inc. (88.44 ± 0.33 pMC). However, relatively large differences are observed for samples G-2 (92.27 ± 0.17 at HENU and 90.80 ± 0.22 at Arizona) and WQ520 (66.20 ± 0.20 at HENU and 67.48 ± 0.25 at Beta). And the observed relatively large differences are most likely attributable to the differences in pretreatment protocols adopted in different laboratories or to the differences in the sampling positions (e.g., inner part vs. outer part) of plant fragments. All measured values for the inter-comparison samples fall within each other’s reported standard deviations, and no systematic bias is observed in the dataset.
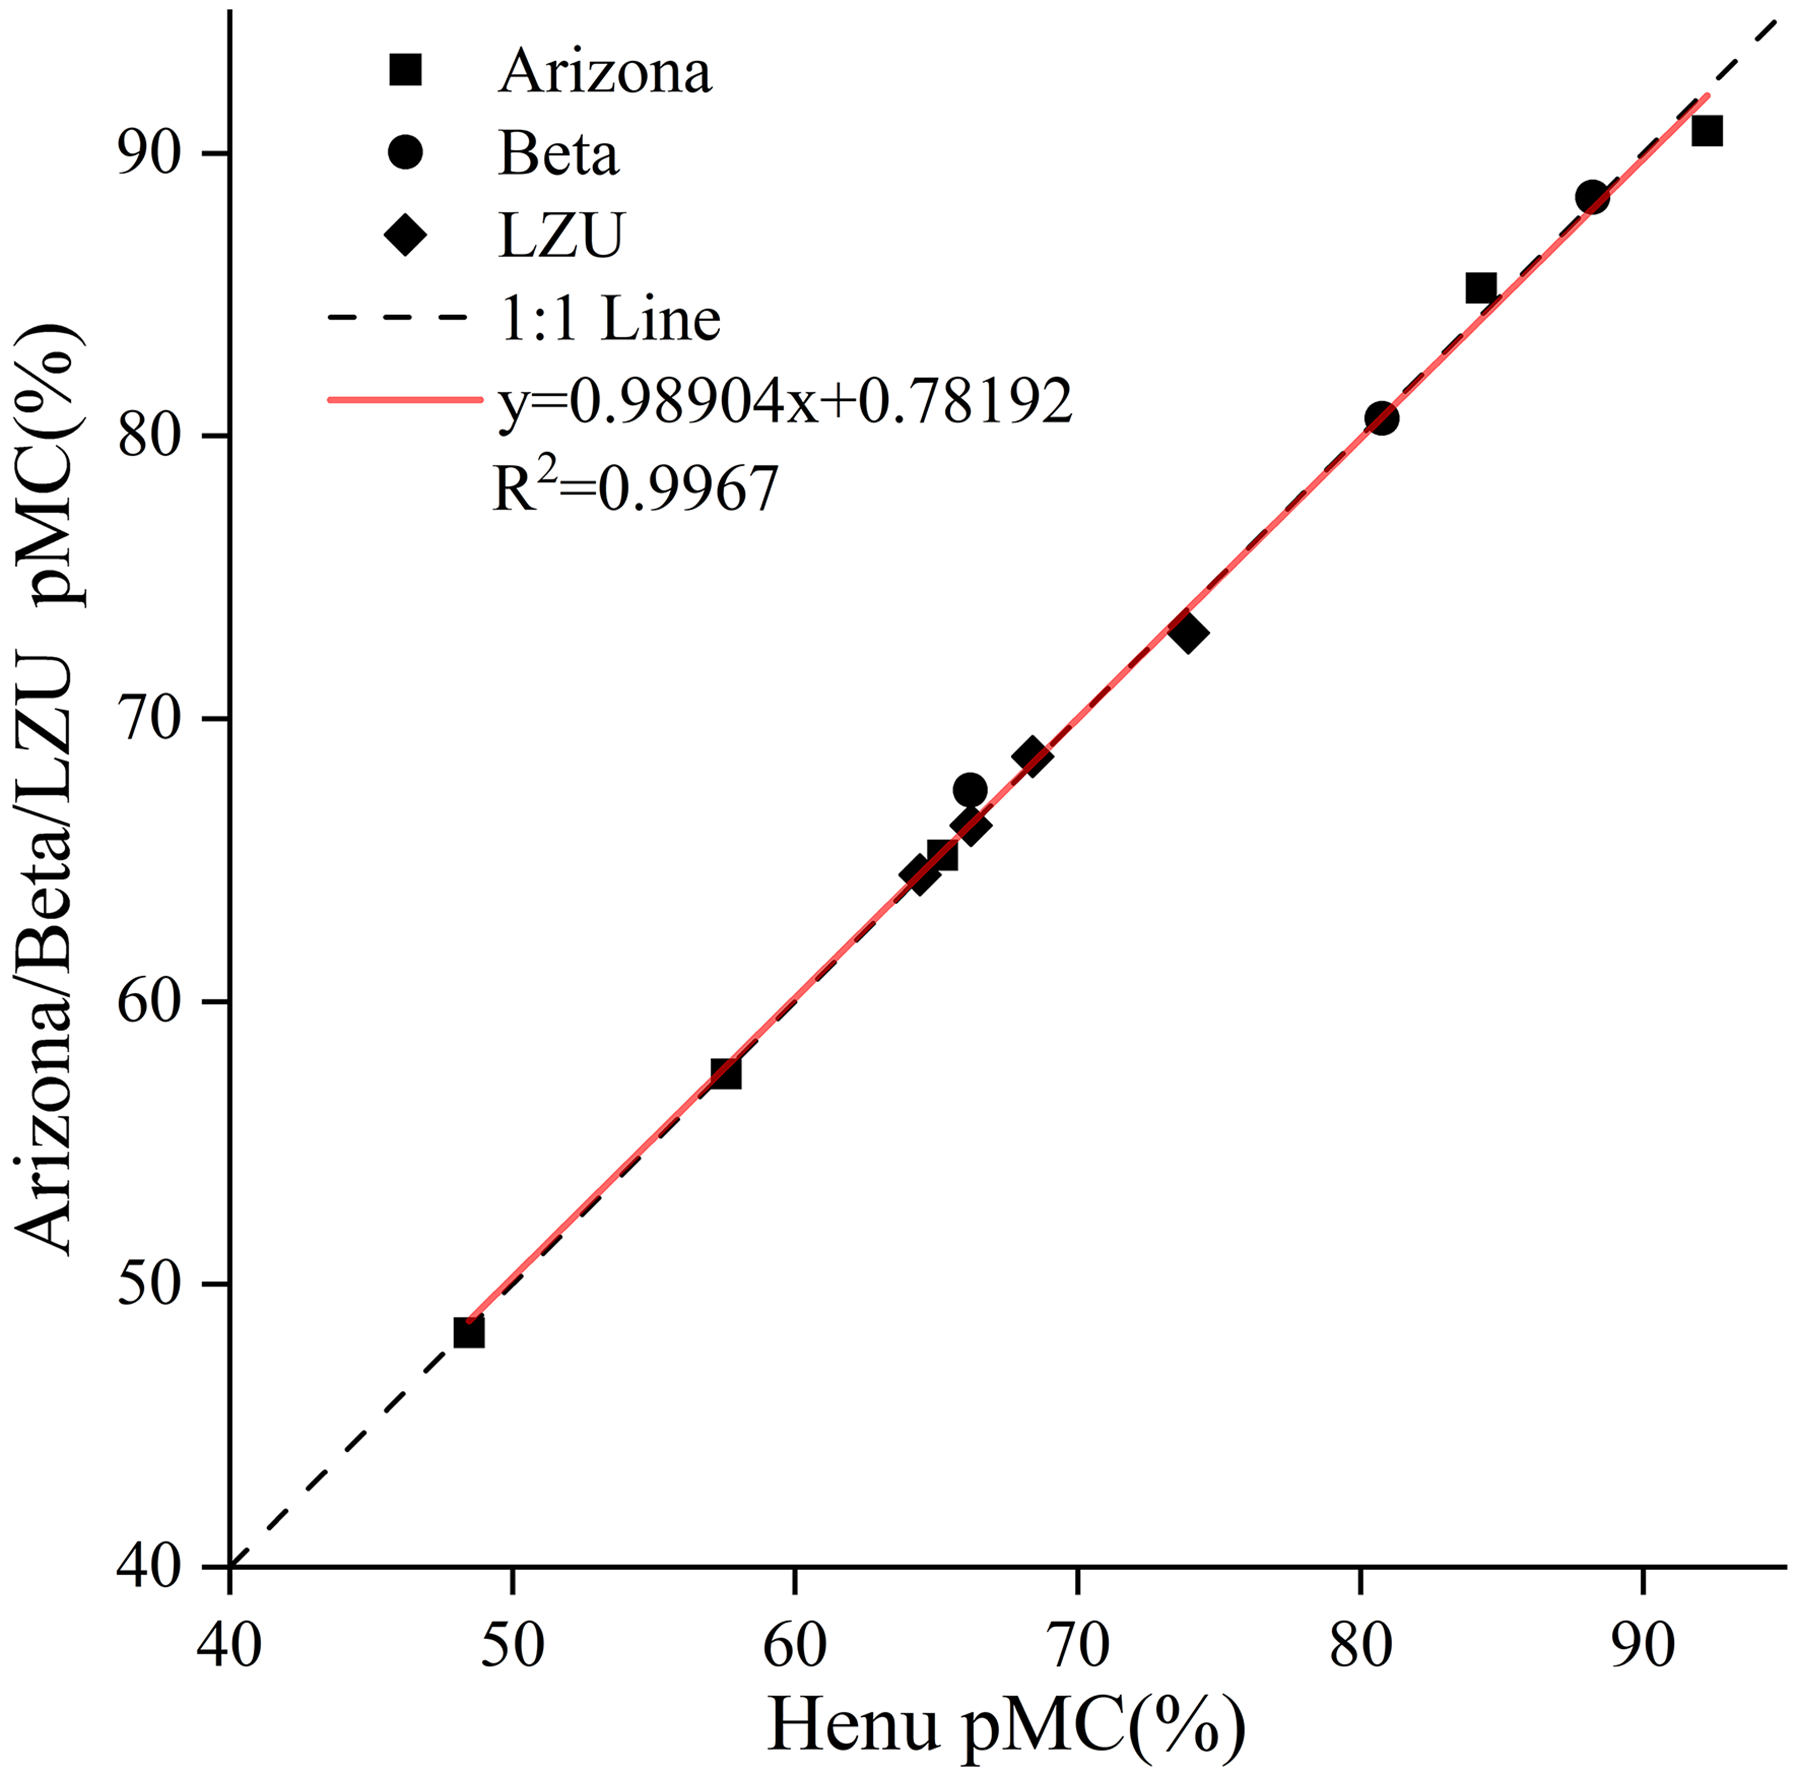
To evaluate the comparability between our laboratory and the three external laboratories, a linear regression was applied to all researched samples (Figure 5). The scatter plot shows a rather good agreement between the measurements from HENU-AMS Laboratory and those from the three external laboratories.
A linear fit of data from HENU-AMS Laboratory (HENU) with the data from the NSF-AMS Facility at University of Arizona (Arizona), Beta Analytic Inc. (Beta), and the AMS Laboratory at Lanzhou University (Lanzhou).

Based on a comparative analysis of 12 data points (i.e., measured samples) between the HENU-AMS system and the three external laboratories (the University of Arizona AMS Laboratory, Beta Analytic Inc., and Lanzhou University), the measurement precision of the system was comprehensively evaluated. As shown in Figure 5, all data points are closely clustered around the y = x reference line, with a linear regression coefficient of determination (R2) of 0.9967 (n = 12). The comparison confirms that our MICADAS system at HENU-AMS Laboratory performs well.
Conclusion
In this study, the measurement precision of the HENU-AMS system was thoroughly evaluated through two approaches: first, by analyzing reference materials (n = 636) with varying 14C contents measured over a two-year period, and second, by conducting a comparative analysis of 12 data points (i.e., measured samples) between the HENU-AMS system and three external laboratories (the University of Arizona AMS Laboratory, Beta Analytic Inc., and Lanzhou University). The data points are closely aligned along the y = x reference line, with linear regression coefficients of determination (R2) of 0.9999 (n = 636) and 0.9967 (n = 12), respectively. This comparison confirms the reliable performance of the MICADAS system at the HENU-AMS Laboratory. By July 2025, our laboratory had tested over 2,500 samples and published findings in multiple international academic journals, such as.
Acknowledgments
This research was funded by the General Program of the National Natural Science Foundation of China (Grant No. 42571194) and the Natural Science Foundation of Henan Province (Grant No. 242300421641; No. 232300421397; No. 242300420217).