Introduction
On 27th February 2007, the National Institute for Health and Clinical Excellence (NICE) issued guidance for UK health professionals aimed at reducing the rising incidence of sexually transmitted diseases (STDs). They cited the 300% rise in chlamydia and 200% rise in gonorrhoea over the last 12 years before advising that health professionals identify individuals whose sexual history puts them at increased risk of disease and undertake one-to-one structured discussions aimed at behaviour change (National Institute for Health and Clinical Excellence, 2007). But how do those in the health services, whose time with each patient is often constrained, identify these individuals? Is there any simple way of identifying ‘risky behaviour’?
Observational studies can help us to determine which behaviours are associated with increased risk and in which population groups the odds of infection are highest. For example, those who do not use condoms have been found to be at higher risk. So have individuals whose partnerships are concurrent. But is there some profile of a ‘risky individual’? Do some individuals engage in multiple risk behaviours whilst others engage in only one or none? If clusters of behaviours, like symptoms of a disease, can be identified, then identifying those individuals who are at risk of chlamydia infection might be considerably easier.
Latent class analysis is a technique that can help to identify groups of individuals who share similar interests, values, characteristics or behaviours (Magidson & Vermunt, Reference Magidson, Vermunt, Lewis-Beck, Bryman and Liao2004a). This study will apply this technique to data from the National Survey of Sexual Attitudes and Lifestyles II (NATSAL II) to determine whether there is an identifiable group of ‘risky’ individuals and by which characteristics such a group might be distinguished.
Data
The data used in this study are taken from the National Survey of Sexual Attitudes and Lifestyles II (NATSAL II), conducted in 2000–2001. NATSAL II is a nationally representative survey of sexual behaviour in Britain. Modelled on the first NATSAL survey conducted in 1990–1991, NATSAL II used a stratified probability sample and aimed to provide a detailed understanding of sexual behaviour patterns (Erens et al., Reference Erens, McManus, Field, Korovessis, Johnson, Fenton and Wellings2001).
Using a combination of computer-assisted personal interview (CAPI) and computer-assisted self-interview (CASI), NATSAL II gathered data on sexual attitudes and behaviours from 12,110 individuals aged 16–44 years (11,161 from the general population and 949 from an ethnic minority boost sample). Interviews began in May 1999 and were fully completed in February 2001. Details of the NATSAL II sampling methodology can be found in the survey's technical report (Erens et al., Reference Erens, McManus, Field, Korovessis, Johnson, Fenton and Wellings2001). The survey achieved a response rate of 64% and, following the application of weights to adjust for unequal selection probabilities, it was broadly representative of the UK population as measured by the 1999 census estimates (Erens et al., Reference Erens, McManus, Field, Korovessis, Johnson, Fenton and Wellings2001).
A sub-sample of individuals was asked to provide a urine sample to test for Chlamydia trachomitis. Half of the addresses at all sample points were selected for participation. Only those aged 18–44 years were eligible to participate. Approximately 70% did so, providing a sample of 3608 individuals (Erens et al., Reference Erens, McManus, Field, Korovessis, Johnson, Fenton and Wellings2001).
Methods
The extent to which an individual engages in risky sexual behaviour cannot be directly elicited with survey questions. Latent class analysis treats this construct as an underlying unobservable variable, called a ‘latent’ variable. Instead of obtaining direct observations of risky behaviour, in latent class analysis individual responses to questions about supposed characteristics of risky behaviour, called ‘manifest’ variables, are observed. For example, ‘risky’ individuals might be expected to have more partners, not to use condoms, to have previously been diagnosed with a sexually transmitted disease, etc. Information about these characteristics can be directly elicited through survey questions (McCutcheon, Reference McCutcheon1987).
The latent class analysis will examine the clustering within individual responses to these manifest variables and divide the heterogeneous study population into groups that are homogeneous with respect to the latent variable. Latent class analysis is often referred to as a categorical variant of factor analysis, since both techniques aim to analyse the interrelationships between a large number of variables in order to explain them in terms of their common underlying dimensions (Garson, Reference Garson2008). However, factor analysis assumes continuously distributed latent variables while latent class analysis uses categorical and binary variables and so the mathematical model driving the calculations is somewhat different (McCutcheon, Reference McCutcheon1987).
The calculations that underlie latent class analysis are based on the principle of conditional independence: in a correctly specified latent class model, all the covariation between the observed variables will be explained by the latent variable. Within each latent class that is identified, the manifest variables are all assumed to be statistically independent of one another (Uebersax, Reference Uebersax2001). Although it is theoretically possible to achieve similar results through logistic regression analysis, this is often complicated by collinearity amongst the manifest variables. Moreover, it can often be difficult accurately to model the large number of interactions that are likely to exist between manifest variables that are all characteristic of the same latent variable.
The latent class model is a simple parametric one. It uses the observed data to estimate two sets of parameters: the conditional response probabilities and the latent class prevalences. The conditional response probabilities give the probability that in a particular latent class, for a given manifest variable, a randomly selected member of that class will give a particular response, for example the probability that an individual in latent class 1 would have more than one partner (Uebersax, Reference Uebersax2001). By comparing the response probabilities between latent classes it is possible to determine how the groups differ from one another. If, for example, there is no difference between the probabilities of condom use between those in latent class 1 and those in latent classes 2 or 3, then condom use is probably not a key differentiating feature between people who engage in risky behaviour and those who do not. The other parameters, the latent class prevalences, tell us the proportion of the population which falls into each latent class. They tell us how common certain groupings are in the study population.
Using these two sets of parameters, the probability of obtaining a specific response pattern can be expressed as the product of the conditional probabilities and the latent class prevalences. For example, if we have three manifest variables (or items) A, B and C, then the probability that a person who gave response i to item A, response j to item B and response k to item C will be in latent class t is:

where X is the latent variable, t indexes the classes of the latent variable X, ΠtX is the probability of a randomly selected case being at level t of the latent variable X and ΠitA|X, ΠjtB|X and ΠktC|X are the conditional probabilities of obtaining the i th, j th and k th responses to items A, B and C respectively from members of class t (Magidson & Vermunt, Reference Magidson, Vermunt and Kaplan2004b).
The program used for the analysis was LEM, developed specifically for the analysis of categorical data. The parameters were estimated using maximum likelihood criterion, computed using the Expectation Maximisation algorithm (Vermunt, Reference Vermunt1997).
Since latent class analysis aims to specify groups that are homogenous with respect to the latent variable, model fit is often improved by adding more latent classes. But the additional class may not improve understanding of the characteristics of the underlying variable and may make comparing the conditional response probabilities more difficult (Storr et al., Reference Storr, Hongling, Kung-Yee and Anthony2004). As such, there is no single statistical test to determine the number of latent classes a model should have. Selecting the ‘best’ model requires the consideration of statistical measures of model fit and the substantive interpretation of model usefulness.
Model fit was therefore assessed by using the Bayesian Information Criterion and the Akaike Information Criterion, and by considering the level of potential classification error. Some authors have also considered the use of a likelihood ratio chi-squared test to determine whether, for example, a 3-class solution provides significantly better fit than a 2-class solution. However, in latent class models the likelihood ratio does not always conform to the chi-squared distribution and the resulting test statistic becomes an unreliable measure (Storr et al., Reference Storr, Hongling, Kung-Yee and Anthony2004; Magidson and Vermunt, Reference Magidson, Vermunt, Lewis-Beck, Bryman and Liao2004a). The results of the chi-squared test are presented in this paper but caution is urged in interpreting them.
The model
Manifest variables
Latent class analysis does not contain any independent outcome measure. Classification into groups will be made entirely based on the manifest variables. If these variables represent manifestations of behaviour that is risky with respect to chlamydia infection, then the resulting latent classes can be interpreted as groupings of individuals who are similar with respect to their risky behaviour. Since individuals will be classified based on their behavioural characteristics and not based on whether they actually test positive for chlamydia, the manifest variables must all be risk factors for the disease. A review of the literature was undertaken to identify behaviours that have previously been shown to be associated with increased infection risk and the results have been published in a working paper (Sonkin & Hinde, Reference Sonkin and Hinde2007). Based on this review the following variables were selected from NATSAL II:
• Number of sexual partners in the past year
• Number of partners without a condom in the past year
• Number of new partners in the past year
• Whether the respondent had ever been diagnosed with a sexually transmitted infection (other than thrush)
• Whether the respondent had concurrent partnerships in the past year
• Whether the respondent's first sexual experience was before the age of 16 years
Covariates
Some groups within the UK population have a higher observed risk of chlamydia infection than others. In 2005, the Health Protection Agency identified higher incidence of both chlamydia and gonorrhoea in black ethnic minority groups and people under 25 (Health Protection Agency, 2005). Previous studies have also found that black Africans and black Caribbeans have higher odds of infection than whites and Asian groups. Married people have been observed to be less at risk than their single counterparts and younger people have much higher odds of disease than older age groups (Winter et al., Reference Winter, Sriskandabalan, Wade, Cummins and Barker2000; Low et al., Reference Low, Sterne and Barlow2001; Radcliffe et al., Reference Radcliffe, Ahmad, Gilleran and Ross2001; Fenton et al., Reference Fenton, Mercer, McManus, Erens, Wellings and Macdowall2005). Moreover, the analysis of the sub-sample of individuals who provided a urine sample to test for chlamydia in the NATSAL II data indicated a higher prevalence of chlamydia amongst males than females (Fenton et al., Reference Fenton, Korovessis, Johnson, McCadden, McManus and Wellings2001).
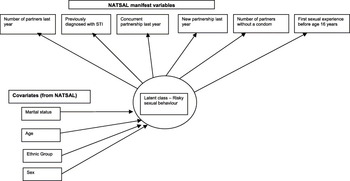
These variables were therefore included in the latent class analysis as covariates. By analysing the data for the population stratified by these variables, the latent class analysis can help us to identify any differences in the prevalence of risky behaviour. A direct standardization was performed in order to determine the independent effect of each covariate. Direct standardization allows for the control of possible confounding effects by comparing the observed prevalence of risky behaviour for a given covariate with the results that would be expected if the prevalence were determined purely by the potentially confounding covariates. For example, the observed prevalence of risky behaviour in the 16–24 year age group can be compared with the prevalence expected if risky behaviour among those in this age group were determined not by age but purely by their marital status, ethnic group and sex composition. If the observed value is very close to the expected value, then the prevalence of risky behaviour is largely dependent on the other covariates and not on age. The latent class model used is shown in Fig. 1.
Latent class model of risky sexual behaviour with respect to chlamydia infection.

The data were cleaned to eliminate 172 individuals who had not provided any responses to any of the six manifest variables under consideration. Any individuals who had not had a sexual experience at the time of the survey were also excluded as they would not have been exposed to the risk of contracting a sexually transmitted disease; this eliminated a further 706 individuals. Finally, 237 individuals were identified as having given inconsistent answers (for example, they claimed only one partner during the past year but indicated two or more partners without a condom during the same period). Since it was not possible to determine which of these answers reflects their true behaviour, these individuals were also removed from the sample. The final sample used in the analysis contained 10,996 persons. Missing data are assumed to be missing at random and the class allocation is made by calculating the posterior membership probability using the data that are available (Vermunt, Reference Vermunt1997).
Results
Sample characteristics
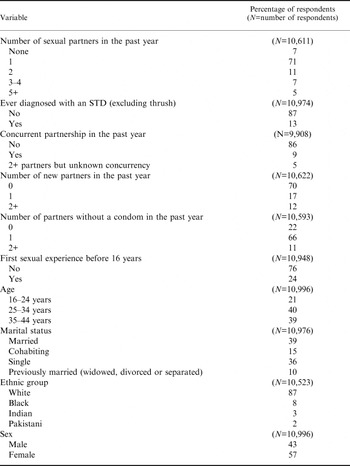
The distribution of the study population on the manifest variables and covariates is given in Table 1. More than three-quarters of the sample had one sexual partner in the past year, with just over one in ten having three or more sexual partners in the same period. Five out of every six members of the sample had not previously been diagnosed with a sexually transmitted disease, and about the same proportion reported no concurrent partnership in the past year. Seven out of ten respondents reported no new partners in the past year, with one in eight reporting two or more. About a quarter of respondents claimed to have had their first sexual experience when they were under the age of 16 years. To summarize the demographic characteristics of the respondents: two in five were married with slightly fewer reporting that they were single; about two-fifths were aged 25–34 years, another two-fifths were aged 35–44 years and the remaining one-fifth was aged 16–24 years; five out of every six members of the sample were white; and females slightly outnumbered males.
Description of study population

Note: Percentages may not sum exactly to 100 because of rounding.
Source: National Survey of Sexual Attitudes and Lifestyles II (2000–2001).
Identification of latent classes
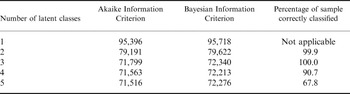
As expected, the chi-squared test statistic indicated that each additional latent class provided a better fit than the preceding solution. However, as indicated above, this measure is often unreliable. The Akaike and Bayesian Information Criteria marginally favoured a 4-class model, though the difference between this and a 3-class solution was negligible (about 1%). Under a 3-class solution, none of the sample was potentially misclassified, whilst misclassification rose to approximately 10% for the 4-class solution. The 3-class solution also offered intuitive clarity, allowing people to be classified as ‘risky’, ‘faithful’ or ‘alone’ (see below). Moreover, the 4-class model did not offer any additional insight into the ‘risky’ group. Rather it subdivided the ‘faithful’ group but with a high degree of classification error. This additional group was identified as having only one partner but because of misclassification, 8% of the group recorded having had two or more partners without using a condom. Since such a high level of misclassification makes interpretation difficult, a 3-class model was selected. The model fit statistics are given in Table 2.
Measures of model fit

Source: National Survey of Sexual Attitudes and Lifestyles II (2000–2001).
Description of latent classes
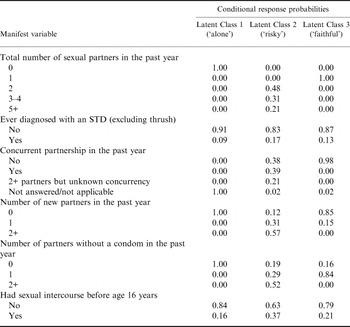
In the 3-class model, 8% of the study population were allocated to latent class 1, 21% to latent class 2 and 71% to latent class 3. The full list of conditional probabilities is shown in Table 3. By comparing the differences between the conditional probabilities in the three latent classes, the features of each latent class can be explored and summarized in terms of their key features.
Conditional response probabilities

Source: National Survey of Sexual Attitudes and Lifestyles II (2000–2001).
Number of partners in the past year seems to be the key differentiating feature between the classes. Individuals in latent class 1 universally had no sexual partners in the past year, although they had been sexually active previously and individuals in latent class 3 all had one sexual partner in the past year. Individuals in latent class 2 had at least two sexual partners in this period, with 20.7% claiming five or more partners in the past year.
In addition to having had multiple partners, individuals in latent class 2 were more likely to have engaged in all the other risk behaviours than those in latent classes 1 and 3. It is only those individuals in latent class 2 who have had concurrent partnerships, multiple partners, multiple new partners and multiple partners without a condom in the past year. They also had the highest rates of previous sexually transmitted infection diagnoses: 16.8%, compared with 12.7% in latent class 3 and 9.4% in latent class 1. As a result, latent class 2 has been named the ‘risky’ class. Since latent class 1 exclusively includes those with no partners over the period, they have been named the ‘alone’ group. Following a similar approach, latent class 3 has been named the ‘faithful’ group. These names are used in the rest of the paper for ease of reference.
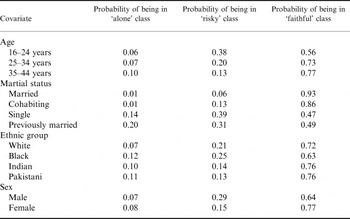
The prevalence of risky behaviour falls as age rises. As Table 4 shows, individuals aged under 25 years were almost twice as likely to be allocated to the ‘risky’ group than were those aged 25–34 years, and three times as likely as those aged 35–44 years. It is unclear whether this is an age effect (younger people always being more risk-seeking than older people) or a cohort effect (younger people in 2000–2001 being more risk-seeking than young people were previously). The probability of being allocated to the ‘faithful’ group rises as age increases, as does allocation to the ‘alone’ group.
Covariate latent class prevalences

Source: National Survey of Sexual Attitudes and Lifestyles II (2000–2001).
Single people were most likely to be allocated to the ‘risky’ group with almost 40% in this class. The prevalence of risky behaviour was much lower amongst married and cohabiting individuals (6% and 13% respectively), perhaps reflecting their more stable partnerships. The previously married group resembles the single group more than the married or cohabiting groups; 31% of them fell into the ‘risky’ category and previously married individuals who were not allocated to the ‘risky’ group were much more likely than any other group to be ‘alone’.
Among the four ethnic groups defined in this study, the highest probability of being in the ‘risky’ class is among the black group at 25%, closely followed by the white group at 21%. The corresponding probabilities in the Indian and Pakistani groups are much lower (14% and 13% respectively). The white group had the lowest probability of being in the ‘alone’ class.
The prevalence of risky behaviour amongst males is substantially higher than amongst women. Almost double the number of males are likely to engage in risky behaviour compared with females (29% compared with 15%). Females and males showed a similar probability of being ‘alone’ (8% and 7% respectively).
The results above indicate that the highest prevalence of risky behaviour is found amongst the black ethnic group, individuals aged 16–24 years, males and single people. However, to isolate the independent effect of age, sex, ethnic group and marital status, it is necessary to control for the possible confounding effects of the other covariates. This was done through direct standardization.
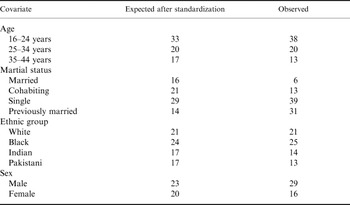
The standardized results are presented next to the actual latent class prevalences in Table 5. Consider the case of married people. Their age and ethnic group profiles would suggest that 16% of them should be in the ‘risky’ class, whereas only 6% were observed to be in this class. Therefore married people are behaving in a way that is substantially less risky than would be expected from their distributions according to age, sex and ethnicity. The same is true for cohabiting people. By contrast, single and previously married people behave in a way that is more risky. It is particularly noteworthy that married and previously married people have a very similar age, sex and ethnic group distribution so their expected prevalence of risky behaviour is also similar. However, the actual prevalence shows a large gap, indicating that not being married any more has a very large effect on risky behaviour, independent of age, sex and ethnic group effects.
Standardized and observed percentages in ‘risky’ class

Source: National Survey of Sexual Attitudes and Lifestyles II (2000–2001).
Young people are slightly riskier in their behaviour than predicted from their sex, marital status and ethnic group profiles, whilst those aged 35–44 years are slightly less risky. Risky behaviour decreases with age even after controlling for sex, marital status and ethnic group. This implies that the prevalence of risky behaviour is not just decreasing, for example, because as people get older they are more likely to settle down into stable partnerships. There is a further effect that is related to age, though it is still not clear whether this is a cohort effect or an age effect.
For the black and white ethnic groups, the prevalence of risky behaviour is almost exactly as predicted given their age, sex and marital status profiles. This means that the higher prevalence of risky behaviour amongst blacks and whites can be explained by their marital status, sex and age distributions. The Indian and Pakistani groups, however, do show an independent effect of ethnic group with the actual prevalence of risky behaviour about 5% lower than the prevalence predicted by the age, sex and marital status profiles.
Risky behaviour remains more prevalent amongst males even after controlling for the age, martial status and ethnic group profile of the sample. Whilst females show an actual prevalence of risky behaviour that is 4% lower than would be predicted by their age, marital status and ethnic group profiles, males show an actual prevalence that is 6% higher than predicted. This suggests that there is an independent effect of being female that is protective, whilst the effect of being male predisposes an individual to more risky behaviour.
Discussion
The analysis indicated three subgroups of the latent construct ‘risky’ behaviour, differentiated by a single manifest variable: the number of partners that an individual had in the previous year. Those with no sexual partners in the past year (8%) and one sexual partner in the past year (71%) were much less likely to have engaged in any of the behaviours known to increase the risk of chlamydia. However, the group who had two or more sexual partners in the past year (21%) were much more likely to have also engaged in other risky behaviours. The number of partners in the past year is therefore a useful marker for identifying those at increased risk of chlamydia infection. Individuals under 25 years, males and those who were single or previously married were more likely to be allocated to the ‘risky’ group. Individuals in the white ethnic group and the black ethnic minority groups did not show an increased prevalence of risky behaviour, after controlling for age, sex and marital status but a decreased prevalence of risky behaviour was shown in the Indian and Pakistani ethnic groups.
Latent class analysis has some limitations. First, there is no single accepted method for determining the correct number of latent classes and, as in this study, it is possible that different criteria might indicate different solutions (McLachlan & Peel, Reference McLachlan and Peel2000). As part of this study, this has been addressed by exploring all possible solutions on a range of indicators.
Second, latent class analysis is based upon responses to manifest variables rather than an independent measure of whether individuals test positive for C. trachomitis. It is therefore vital that the correct manifest variables are chosen. A comprehensive literature review informed the choice of variables in this study. However, should new and previously unknown risk factors for chlamydia infection be identified then the data would need to be re-analysed with the inclusion of these factors as manifest variables.
For this study, data were only available on the behaviour of individual respondents to the survey. However, if the partners are engaging in risky sex, then by only measuring the individuals' sexual behaviour, their disease risk would be underestimated. This study therefore cannot completely capture individual disease risk. It might be interesting for another study to explore whether including data on partnership networks changes the results of the latent class analysis.
As a measure, any variable is useful only to the extent that it is accurately reported. It may seem that the number of partners a person has had in the past year is key to the definition of risky behaviour, but if it is not a valid or reliable measure then it is not a useful indicator. Fortunately, it turns out that recall of the number of partners in the past year is generally good. ‘Test–retest’ studies have investigated whether people are able consistently to give the same response on different occasions. These have found that a high percentage of people are consistent in their responses about the number of partners they have had, especially if they have had one partner or no partners (Van Duynhoven et al., Reference Van Duynhoven, Nagelkerke and Van de Laar1999; Jaccard et al., Reference Jaccard, Macdonald, Wan, Guilamo-Ramos, Dittus and Quinlan2004).
General practitioners and other health professionals do not always find it easy to discuss sexual health with their patients. Gott et al. (Reference Gott, Galena, Hinchliff and Elford2004) describe raising such issues as ‘opening a can of worms’, being problematic not only because of the sensitivity of the issues but also because of constraints on time with each patient. Knowing that it is possible to identify those engaging in risky behaviour just by asking, ‘How many sexual partners have you had in the past year?’ could help to simplify the process. It can help health professionals quickly, easily and with minimum embarrassment to identify those individuals who, according to the NICE guidelines, require one-to-one interventions and further discussion. For these patients it may then be worth taking a full sexual history, especially exploring their pattern of condom use. But encouraging all people who have had more than one partner to get tested for C. trachomitis could be an effective way to reduce disease prevalence. In order to fully recommend this course of action, the sensitivity and specificity of the results presented here will need to be tested, possibly using the subsample of the NATSAL II population who provided urine test results to test for chlamydia infection.
However, the relationship between the prevalence of risky behaviour and the prevalence of chlamydia infection is complex. In an analysis of the sub-sample of individuals who provided a urine sample in NATSAL II, Fenton et al. (Reference Erens, McManus, Field, Korovessis, Johnson, Fenton and Wellings2001) found a prevalence of C. trachomatis infection of 2.2% (95% CI 1.5–3.2%) in males and 1.5% (1.1–2.1%) in females. Non-married status and younger age were associated with higher prevalence of infection. Our results broadly agree with this. It was found that males were more likely than females to engage in risky behaviour (29% compared with 16%). Single and previously married individuals were substantially more likely to engage in risky behaviour than those who were married, and risky behaviour seemed to decrease with age.
Whilst the prevalence of risky behaviour in a particular population subgroup and the prevalence of chlamydia infection may be broadly related, any direct comparison between the two must be interpreted with caution. Whether an individual tests positive for C. trachomitis at a given point in time is influenced not only by individual sexual behaviour but also by sexual mixing patterns between and within population subgroups, previous lifestyle choices that might have led to a long-term asymptomatic infection, treatment-seeking behaviours, and a variety of other factors that mediate between risky behaviours and the probability of acquiring the disease (Anderson et al., Reference Anderson, Garnett and Geoffrey2000). Thus it is not possible from our data to derive a probability of testing positive given that an individual engages in risky behaviour, nor would it be appropriate to use the prevalence of risky behaviour in a population subgroup as a proxy measure for the prevalence of chalmydia infection in that group.
Instead, it is possible to suggest that individuals who have more than one partner represent the group from which individuals testing positive for C. trachomitis are likely to be drawn because they are engaging in behaviours known to be correlated with chlamydia infection. By encouraging these individuals to be tested, even if they are asymptomatic, it is hoped that it would be possible to identify and treat a large number of those with undiagnosed chlamydia infection. Moreover, by understanding the distribution of risky sexual behaviour within key groups, efforts to reduce the prevalence or incidence of STDs through public policy will be more informed.
Current government policy with respect to STDs includes measures specifically to target groups that they have identified as ‘at risk’, especially young people and black and ethnic minority groups (Health Protection Agency, 2005). This study has shown that young people are indeed a key group with a higher prevalence of risky behaviour than their older counterparts. However, the story is quite different for black and ethnic minority groups. The prevalence of risky behaviour in the black ethnic minority group was slightly higher than in the white group but this prevalence could be predicted by their age, sex and marital status profiles. There seems to be no indication that being black per se implies riskier behaviour.
Nevertheless, the National Chlamydia Screening Programme found a substantially higher infection rate among black participants than among other ethnic groups (Health Protection Agency, 2005). This study has indicated that a higher prevalence of risky behaviour in this group is not likely to be the explanation. Other explanations are needed. The black participants may have had a different age, sex and marital status profile from the rest of the population. Another possibility comes from the research of Laumann & Youm (Reference Laumann and Youm1999), who found that the higher rates of bacterial infections amongst African Americans could be explained by the patterns of sexual networks between different ethnic groups. ‘Safe’ African Americans are more likely than white Americans to have had a ‘risky’ partner in the past five years. Rates could also be affected by the underlying prevalence of the disease in the population. If chlamydia is more prevalent in the black population, it is more likely that an uninfected individual will be partnered with an infected individual.
The prevalence of risky behaviour was substantially higher amongst males than females. Since risky behaviour is defined based on the number of partners a person has had in the previous year, this finding is consistent with previous studies, which have indicated that men consistently report a greater number of sexual partners than women. A detailed study of the responses in NATSAL I found that men reported a higher mean number of sexual partners than women (Wadsworth et al., Reference Wadsworth, Johnson, Wellings and Field1996). This may be due to a genuinely higher prevalence of risky behaviour amongst men. However, there was evidence of ‘social acceptability bias’. This occurs when society accepts different standards of sexual behaviour for men and women and this leads to differential reporting. It is hypothesized that in the UK context, this leads to under-reporting of the number of sexual partners by women and over-reporting by men (Wadsworth et al., Reference Wadsworth, Johnson, Wellings and Field1996). Women with more than one partner may be revising their response down to one, incorrectly placing them outside the ‘risky’ category, whilst men with one partner may be revising their response upward, incorrectly placing themselves in the risky category. It is therefore reassuring that the National Chlamydia Screening Programme provides free testing for both sexes, and that government proposals do not distinguish between males and females.
Another group seems to have been left out of health promotion proposals and targets altogether. This study has identified that previously married individuals have a high prevalence of risky behaviour, as did the initial analysis of NATSAL I (Johnson et al., Reference Johnson, Wadsworth, Wellings, Field and Bradshaw1994). With 132,562 divorces in 2004, large numbers of people enter into this group every year and potentially place themselves at risk of an STD (Office for National Statistics, 2007). This may help to explain why the Health Protection Agency recently found that STDs were increasing in prevalence most quickly among those aged over 45 years. Little is known about why this group behaves as it does and further research is needed to inform the design of effective interventions to reduce its risky behaviour.
Although number of partners in the past year may be a good indicator with which to identify ‘at risk’ groups, it may seem a poor one on which to base a public health intervention. Partnership formation and breakdown is largely divorced from disease risk. It is determined by the nature of each relationship and concepts such as love, trust and fidelity. To try to discourage partnership turnover as part of a health campaign might seem a step too far.
However, awareness of the importance of partnership turnover is useful because it provides a simple way for each person to assess his or her own risk. For instance, encouraging people who have had more than one partner to get tested for chlamydia and gonorrhoea could be an effective way to reduce disease prevalence. To help reduce incidence, it could target the 52% of people who have more than one partner but do not use condoms to change their behaviour, combining the message on partnership turnover with condom use. Through the media, we receive messages about our health every day and it can be too easy to ignore them. It is not difficult to understand why the government would prefer to target certain groups, ensuring that the message is marketed to them in the most effective way possible. However, using a single, simple measure, it is possible for everyone to assess their own risk of infection and to take responsibility for their sexual health.