I. INTRODUCTION
An experimental scheme to instantaneously visualize propagating electrical waves would be very useful, and it is desirable to pursue such a scheme [Reference Yang, David, Took, Papapolymerou, Katehi and Whitaker1, Reference Yamazaki, Wakana, Park, Kishi and Tsuchiya2]. This is because it helps grasp important wave properties in high-frequency components and circuits promptly and intuitively. Such a tool would be cost-effective and time-saving in addition to being efficient for the analyses and diagnoses of radio-frequency (RF) and high-speed circuitry. While numerical simulation methods are also powerful for wave visualization, a prompt experimental approach is highly desirable, especially for research on next-generation circuits with high complexity. Furthermore, the experimental method should be independent of the circuit model used.
Live electrooptic imaging (LEI) [Reference Sasagawa, Kanno, Kawanishi and Tsuchiya3–Reference Sasagawa, Kanno and Tsuchiya6] is such an experimental method potentially. Using an LEI camera, it is possible to obtain an instantaneous 100 × 100 pixel image of the microwave electric field distribution over a circuit. Moreover, even a real-time movie can be displayed and recorded with a frame rate higher than 30 frames per second (fps). The maximum image acquisition rate has reached 1250 fps at present. In addition, it has been demonstrated that the bandwidth of the “measurement” at each pixel is beyond 100 GHz and the imaging system is applicable to W-band waves [Reference Tsuchiya, Kanno, Sasagawa and Shiozawa7–Reference Kanno, Sasagawa and Tsuchiya10].
Considering the capabilities of the LEI camera, it is desirable to extend the camera's applications. This is because apart from the instantaneous visualization of RF electric fields, it is also necessary to develop techniques for visual-intuitive analyses and diagnoses. In this context, a variety of RF and high-speed circuits should be examined using LEI observations. In this paper, the results of such examinations performed with the latest prototype of the LEI camera are reported (Fig. 1). This LEI camera is easy to use and facilitates prompt observations.
Photograph of the latest prototype of LEI camera. EO, electrooptic; LO, local oscillator; PM, polarization maintaining.

II. LEI CAMERA CONCEPT AND SETUP
The LEI camera is basically a lens-less and contact-style apparatus to acquire instantaneously images of RF electric fields over planar circuits. Its principle of operation is based on the synergetic combination of the ultra-fast nature of photonic measurements [Reference Valdmanis, Mourou and Gabel11–Reference Nagatsuma, Shinagawa, Sahri, Sasaki, Royter and Hirata13] and ultra-parallel nature of the complementary metal oxide semiconductor (CMOS) image sensor technology, which facilitate 10 000-parallel measurements of RF signals and the real-time display of the acquired image with 100 × 100 pixels.
Figure 2 depicts the configuration of the LEI camera schematically. Electrical signals on a metal line of a circuit board, i.e., the device under test (DUT), generate evanescent fields over the line. A 25 × 25 mm2 electrooptic (EO) crystal plate is placed close to the circuit surface, and the evanescent fields cause the local optical index of the plate to vary via the Pockels effect [Reference Pockels14]. The two-dimensional pattern of the optical index variation is generated and transformed using an expanded laser beam and polarimetric optics to give the spatial distribution of the optical intensity [Reference Kaminow and Turner15]. The corresponding LEI image is formed and displayed after the 10 000 parallel photo-detection of the laser beam at a CMOS image sensor and the subsequent digital signal processing [Reference Sasagawa, Kanno and Tsuchiya16]. The spatial resolution is thus given to be 0.25 mm/pixel, which is sufficiently fine for the purpose of the present work.
Schematic of the RF and optical configurations of the present LEI camera system. AR, anti-reflection coating; CCD, charge-coupled device; DSP, digital signal processor; DM, dichroic mirror; DUT, device under test; HR, high-reflection coating; LO, local oscillator; PBS, polarization beam splitter; PC, personal computer.

One should note that EO mixing takes place in the same optics, resulting in frequency down conversion:

where an electrical signal with a frequency f RF is applied to the DUT, and an optical intermediate frequency (IF) signal with a frequency f IF is generated as a result of the EO mixing of the RF signal with an optical local oscillator (LO) signal with a frequency f LO. The image sensor should be fast enough to acquire the temporal wave form of the IF signal at each pixel. This spatially coherent process of frequency down conversion gives rise to the synergetic combination of the ultra-fast and ultra-parallel characteristics. Let δ f be |f IF – f IS/n|, where f IS and n are the sampling frequency of the CMOS image sensor and an even integer, respectively. A non-zero δf value leads to the occurrence of phase evolution in an LEI image. In the present work, a δf value of 1 Hz is chosen and a digital filter corresponding to this frequency is applied to acquired image data in real-time.
Figure 3 shows a cross section of the EO crystal plate holder (left) and a photograph of a (100) ZnTe EO crystal plate (right). The crystallographic orientation is necessary when the z-component of the electrical field, E z, is visualized. Another type of EO sensor plate, whose surface orientation is (110), is used for the visualization of the in-plane components of RF electrical fields (E y or E x). These plates contain an anti-reflection coating on their bottom surface and a high-reflection (HR) coating on their top surface, both of which are for 780 nm light. The top surface is transparent at 640 nm, and therefore, an optical image of the DUT surface is obtainable simultaneously with LEI observations by using a built-in charge-coupled-device (CCD) camera and a red light-emitting-diode illuminator, which are placed beneath the dichroic mirror.
Left: cross section of the view window in the present LEI camera prototype. Right: a photograph of the ZnTe EO crystal plate used in the LEI camera system.

The present prototype of the LEI camera is prompt in carrying out image analyses. For this feature, a sapphire crystal plate of 0.2 mm thickness is set on the EO crystal plate. Since the EO crystal is rather brittle, it should be protected from possible damages that might result from physical contact with uneven circuit surfaces. Simultaneously, its rather high relative permittivity, approximately 10, gives rise to higher sensitivity visualization.
III. LEI OBSERVATIONS, ANALYSES, AND DIAGNOSES
Firstly, the LEI observation scheme was applied to three kinds of microstrip line patterns: a T-shaped branch, 90° hybrid, and meander line [Reference Tsuchiya, Sasagawa and Shiozawa17]. Simple and representative patterns of planar RF circuits were chosen for the basic LEI camera observations. The designed characteristic impedance for all the patterns was 50 Ω.
Four series of stroboscopic image displays corresponding to LEI observation movies are shown in Figs 4–8. Movies in the audio-video-interleave (AVI) format corresponding to the series in Figs 4–7 are available on the LEI camera Web site [18–21]. In all these series, E z is visualized. An optical image is also added to each set of image series; the image has arrows for showing the directions of RF signal injection and RF wave propagation.
Set of LEI observations for the T-shaped branch pattern. (a) Optical image with arrows that indicate the directions of signal propagation. (b) Magnitude image shown on a logarithmic gray scale, and (c) LEI movies displayed stroboscopically with a phase interval of π/4. The corresponding movie is available on the LEI camera Web site [18].

(a) Optical image of the 90° hybrid circuit and its stroboscopic field phasor images for an operation at the S 21 minimum frequency, obtained (b) experimentally with the LEI camera, and (c) numerically. The phase interval is π/5. The corresponding movie is available on the LEI camera Web site [19].

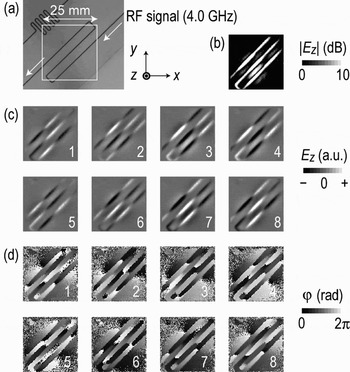
(a) Optical image of the meander line; arrows show the directions of 4.0 GHz wave propagation. The white square corresponds to the field of view of the LEI observation window. (b) A magnitude image of the injected RF signal shown on a logarithmic gray scale. Stroboscopic LEI images of the (c) field phasor and (d) phase are shown on linear gray scales. The phase-evolution interval is π/4. A corresponding movie is available on the LEI camera Web site [20].

Set of LEI observation results for the meander line with 5.0 GHz signal propagation. The white square corresponds to the view area of the LEI observation window. (a−d) depict the same type of images as the corresponding panels in Fig. 6. A corresponding movie is available on the LEI camera Web site [21].

(a) Optical image showing the LEI observation area, (b) a magnitude image for the 5.0 GHz signal, and (c) stroboscopic LEI images showing signal propagation around the outlet part of a meander line. The phase-evolution step is π/8. White triangles indicate locations of the maximum positive electric field for the RF wave.

Secondly, the LEI camera was used for observations of RF waves in a Gbps-class prescaler circuit involving emitter-coupled-logic (ECL) chips (Figs 9 and 10); the observations were carried out for attempting to diagnose malfunctions. Some typical images chosen from the corresponding LEI movies are shown in Figs 11 and 12. In these images, E y or E x are visualized, which generally diverge symmetrically with respect to the center of a signal line. Therefore, a corresponding couple of black and white stripes in parallel to the signal line are depicted in an ideal case. The reason why the lateral field (E y or E x) is visualized for the ECL prescaler circuit board stays in the geometrical configurations of its signal lines. For the coplanar waveguide-like transmission lines (Fig. 9(b)), the lateral field components are more enhanced and, therefore, appropriate for the LEI visualization.
(a) Diagram and (b) photograph of an ECL prescaler circuit. The port configurations of the JKFFs in the diagram are drawn in accordance with the real pin configurations of ECL chips. Regions α and β are observed by the LEI camera. CLK, clock; CLR, clear; FB, fan-out buffer.

Measured temporal wave forms at the prescaler circuit output Q 1 and the monitor port signal Q 0. The clock frequencies are 950, 800, and 1050 MHz. τ, clock period.

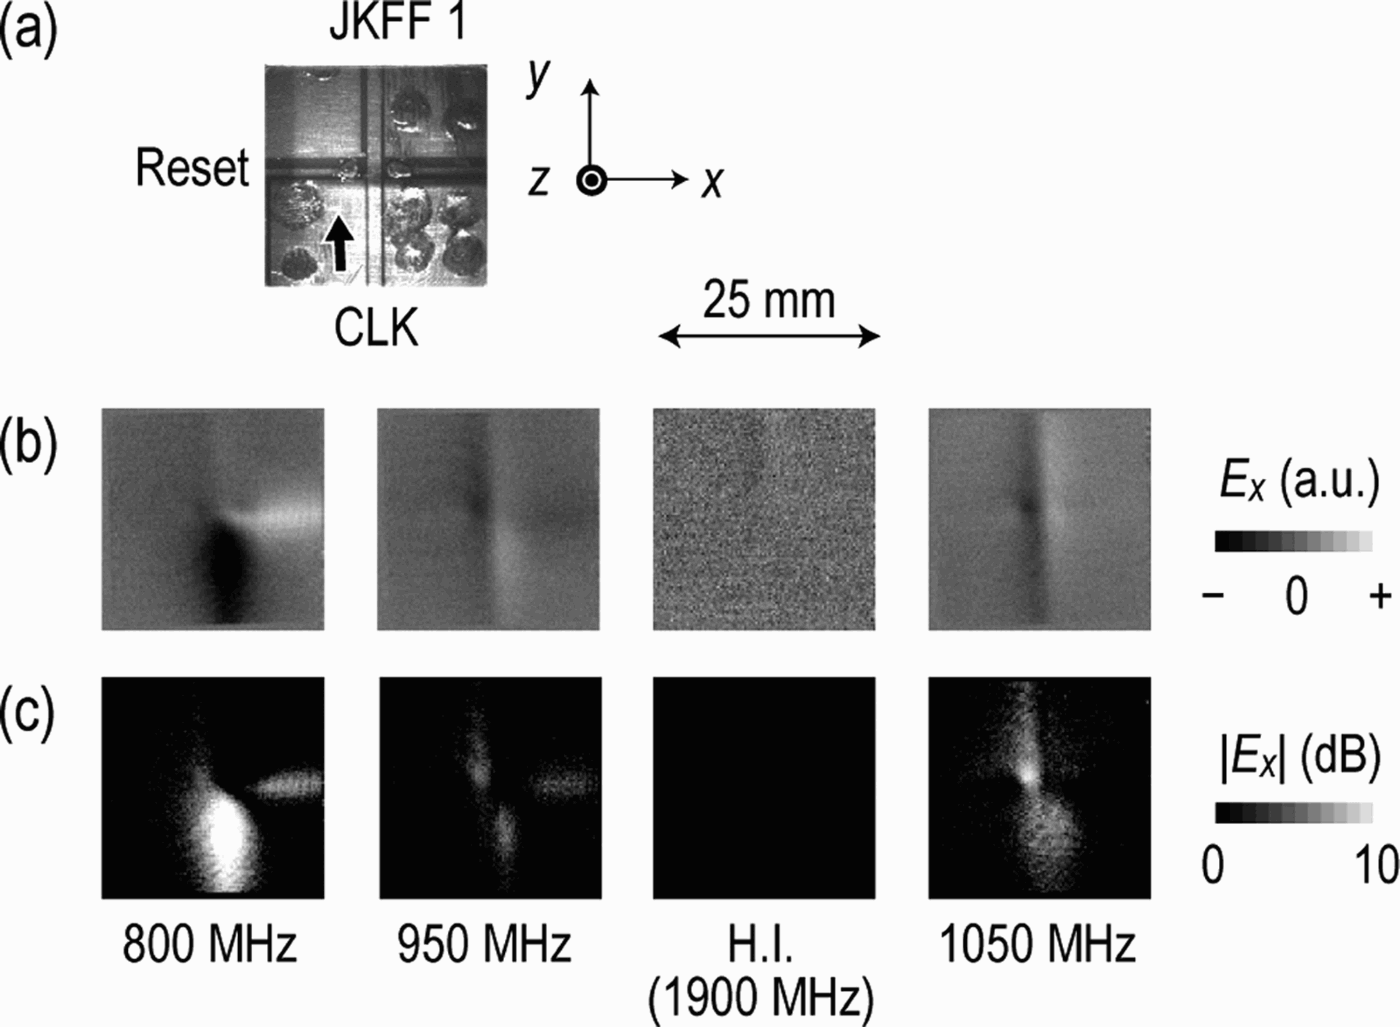
LEI observation results for the region around the point of intersection of a clock line and reset line (region α in Fig. 9). (a) A CCD image simultaneously taken through the LEI observation window, (b) phasor images, and (c) magnitude images. The harmonic images (H.I.) were obtained using a harmonic optical LO signal at 1900 MHz for the clock frequency of 950 MHz. The gray scales for the H.I. set are modified to enhance the image contrast.
LEI observation results for the region in front of JKFF 1 (region β in Fig. 9). (a) A CCD image simultaneously obtained through the LEI observation window. (b–d) Phasor images (top) and magnitude images (second row) for the clock frequencies (b) 800 MHz, (c) 950 MHz, and (d) 1050 MHz together with their subharmonic images (S.I.) obtained using their subharmonic optical LO signal at 400 MHz (b), 475 MHz (c), and 525 MHz (d).

A) Planar RF circuit patterns
1) T-shaped branch
The T-shaped microstrip line pattern was made on a flame retardant type-4 (FR-4) glass epoxy circuit board (Sunhayato), whose relative permittivity and thickness were 4.7 at 1 MHz and 1.6 mm, respectively. An optical image of the pattern obtained during real-time LEI observations is shown in Fig. 4(a). The frequency of the input microwave signal was 4.0 GHz, and the signal was injected from the upper-left port. Two other ports were connected to 50 Ω terminators.
Figure 4(b) shows a magnitude image of the RF signal over the pattern; the image indicates the amplitude distribution of E z on a logarithmic gray scale. The distribution over the pattern is rather uniform and some reverse fields directed toward the ground plane are recognized on both sides of the input microstrip line. This kind of field distribution is rather standard and often found in microwave textbooks in the context of numerical simulations.
Figure 4(c) shows a stroboscopic series of field phasor images of propagating RF waves. The phase interval is π/4. The images are depicted using a linear gray scale, and white and black portions correspond to the maximum positive and minimum negative electric fields, respectively. Clearly seen in the images is a branching RF wave; it propagates along the input microstrip line and divides into two waves traveling in opposite directions at the branching point. This result suggests that the operation of the branch is as expected and confirms that the performance of the LEI camera observation scheme is satisfactory.
2) 90° hybrid
A four-port pattern was made on a fluorocarbon resin board (Pillar NPC-H220A) for the 90° hybrid circuit; the relative permittivity and thickness of the resin board were 2.17 and 0.98 mm, respectively. An RF signal of 7 GHz was injected into one of the four ports, which can be seen at the top-right corner of the optically taken image in Fig. 5(a).
Figure 5(b) shows a series of stroboscopic field phasor images extracted from an LEI movie. The phase interval is π/5. It is apparent that a sinusoidal wave enters the circular part (0π/5–3π/5 in phase), rotates (4π/5–10π/5 in phase), and exits the part through two output ports. The two output signals seem to have a phase difference of π/2. Although the port-2 output is satisfactorily suppressed, the input RF power is not divided evenly, which suggests that there is room to improve the pattern design.
Figure 5(c) shows a numerically simulated E z image series in the same gray scale and phase intervals as those for the experimentally acquired images in Fig. 5(b), which was generated for the designed pattern of the 90° hybrid circuit by a general-purpose electromagnetic field simulator based on the finite element method (High Frequency Structure Simulator (HFSS) of Ansoft). General features of those stroboscopic image series are in good agreement, which implies that the LEI scheme instantaneously provides RF wave images with quality similar to that of numerical ones.
3) Meander line and trapped-wave analysis
Here, results for another DUT – a microstrip line with an S-shaped meander structure (Figs 6(a) and 7(a)) – examined using the LEI observations are discussed. The pattern was made on a ceramic-polytetrafluoroethylene composite laminate board (Rogers, RT/duroid-6010LM), whose relative permittivity and thickness were 10.2 and 0.64 mm, respectively. As indicated by arrows, RF signals were launched from the top-right corner and transmitted to the bottom-left corner.
In Fig. 6(b), a magnitude image for a wave signal of 4.0 GHz is displayed. It is clear that the amplitude of the wave is fairly uniform along the meander structure. In contrast, the distribution of reverse fields between stripes toward the ground plane is rather irregular. Figures 6(c) and 6(d) show two sets of stroboscopic image series, for field phasor images and phase images, respectively. While the former series indicates the properties of an ordinary traveling wave, i.e., a wave propagating along the microstrip line, traveling-wave features are clearer in the latter because of the indication of wave fronts. The wave fronts are indicated clearly by discontinuous transitions from white (2π) to black (0π) on the gray scale.
On the other hand, Fig. 7(b) shows a different trend: the amplitude of the 5.0 GHz wave on the meander structure shows a periodic variation, implying standing-wave features. In addition, as seen in Fig. 7(c), the wave positions hardly vary, which is another aspect of standing waves. In Fig. 7(d), the awkward behavior of the wave fronts is clearly seen. Furthermore, the wave images around the phase values of 5π/8 and 13π/8 are rather faint, which coincides with the well-known fact that instantaneous field of a standing wave disappears at two specific phase values.
The above observations suggest that the 5.0 GHz wave is trapped either within the meander structure or by other factors such as poor receptacles at the ends of the circuit board. At frequencies above 5.0 GHz, at 6.0 GHz for instance, the traveling wave characteristics are again observed. A movie on the LEI camera web site clearly shows this [22], i.e. a mixture of standing and traveling wave features appears.
In order to clarify the features of the trapped wave observed at 5.0 GHz (Fig. 7), the output part of the meander line (Fig. 8(a)) was examined in the LEI analyses. This is because it was expected to provide clues to the location of the trapping region. Both the internal area of the meander line and outgoing microstrip line are included in the same field of view. As seen in the magnitude image (Fig. 8(b)), a longer region along the out-bounding stripe is brighter than those in Fig. 7(b), indicating a weaker feature of standing wave. In fact, the field phasor image series in Fig. 8(c) shows wave propagation along the stripe, although some awkward features are included.
B) High-speed digital circuit
1) Lei images of subharmonics and harmonics
It is of interest to use the LEI camera to obtain observations of RF waves in high-speed digital circuits. Generally, in a digital circuit, signals with frequencies that are subharmonics of the clock frequency f CLK are generated by its digital arithmetic processing. Simultaneously, signals with higher harmonic components are also included because of the generation of squared and/or pulsed temporal wave forms of the signals. Using the LEI camera, images of these subharmonic and harmonic components can also be obtained by tuning the LO frequency so as to fulfil the following relationship:

where p and q are integers.
2) ECL circuit and diagnoses
Here, a test circuit was prepared for the LEI observations. Figures 9(a) and 9(b) show the circuit diagram and a photograph of the circuit. Three ECL chips were used—two JK flip-flops (JKFF 0 and JKFF 1; MC100EP35 of ON Semiconductor) and a fan-out buffer (FB; MC100EP11 of ON Semiconductor). In addition, chip capacitors (GRM31M (L3.2 × W1.6 × H1.15 mm) and GRM219 (L2 × W1.25 × H0.85 mm) of Murata) and chip resistors (MCR10-series (L2 × W1.25 × H0.55 mm) of Rohm) were used. A simple two-step prescale function with an f CLK of up to 3 GHz would be expected if the circuit pattern design and assemblies of the components were to be appropriate. However, the frequency range of the expected operation was found to be narrow, as shown in Fig. 10. The circuit functioned properly at 950 MHz, while it malfunctioned at 800 and 1050 MHz in different ways. To clarify the origins of the malfunctions, LEI-based observations and diagnoses were carried out.
Here, we focus on two specific regions of the circuit: regions α and β shown in Figs 9(a) and 9(b). The region α contains a bridge of a reset line on the back surface of the board, which crosses a clock line from CK0 of FB toward JKFF 1. In region β, a signal line from Q 0 of JKFF 0 is connected to J 1 and K 1 of JKFF 1, while the clock line from CK0 of FB connects to the clock port of JKFF 1.
Figure 11 shows a set of LEI observation results for the region α. A CCD image taken simultaneously with the LEI observation is shown at the top (a). E x phasor images are shown in Fig. 11(b), while their corresponding magnitude images are displayed in Fig. 11(c).
At 950 MHz, it appears that the clock signal from FB-CK0 smoothly crosses the reset line bridge and travels toward the JKFF 1-CLK port, although it is slightly coupled to the reset line. The phase of the wave is continuous across the bridge. This observation result indicates the normal operation of the circuit at this frequency (Fig. 10). The observations for the 1050 MHz clock signal are similar.
In contrast, the clock signal is observed to stagnate at 800 MHz. Significant resonance is indicated in the region before the bridge and rather strong coupling of the clock signal to the reset line is also seen. The phase of the wave is opposite across the bridge. This trend is more remarkable at 765 MHz. These results imply that a cavity for the RF waves is formed with the bridge as a shorted end and that there exists rather strong coupling to the reset line.
The harmonic LEI images are of interest since they indicate the frequency dependence of the signal line. By setting p/q = 2 in (2), images of the propagation of signals with a frequency equal to the second harmonic of the clock frequency are obtained. As seen in Fig. 11(b), the second harmonic component of the 950 MHz clock signal travels toward the JKFF 1-CLK port and it is faint before the bridge. This controversial result implies the presence of another path for the clock signal.
Figure 12 shows another set of LEI observation results, for region β. Here, LEI observations for subharmonic signals (p/q = 1/2) are listed together with those for the fundamental clock frequency (p/q = 1). For the clock frequency of 950 MHz, phasor and magnitude images for 475 MHz clearly show the propagation of the Q0 signal from JKFF 0 toward the clock port of JKFF 1, which is prescaled by JKFF 0. The central part of the signal on the line is blind in the magnitude image, which indicates that the transverse mode of the signal is fairly balanced and corresponds to a case of E y = 0 and E z ≠ 0. The situation is almost the same for the clock frequency of 800 MHz.
In contrast, no subharmonic signal image was obtained for the clock frequency of 1050 MHz. This could be one of the reasons why the prescaler circuit malfunctioned at this clock frequency and implies that there was something wrong with JKFF 0. In a separate LEI observation, it was found that another coupling between the clock and reset line at JKFF 0 caused it.
Regarding the fundamental LEI observation results, they seem to include a variety of information. For the case of the 800 MHz clock frequency, the clock signal propagation image is faint, while the Q0 signal propagation is clearly seen. The former could be due to the resonance effect in the region α, which was mentioned above and which possibly weakens the clock signal toward the clock port of JKFF 1. This argument agrees well with the temporal wave form shown in Fig. 10: there is no signal at Q 1 for the clock frequency of 800 MHz. The latter could be a second-harmonic image of the 400 MHz output Q 0 of JKFF 0.
Both the clock and J 1/K 1 input signals are clearly recognized at the clock frequency of 1050 MHz. The latter signal does not result from the harmonics of the JKFF 0 output, but is likely to be a signal induced by the clock signal, probably by a coupling effect. This induced 1050 MHz input to J1/K1 of JKFF 1 justifies the 525 MHz output at Q1 of JKFF 1 in Fig. 10.
As for the clock frequency of 950 MHz, the images show that both the 475 MHz Q0 signal and 950 MHz clock signal reach JKFF 1, which agrees with the proper functioning of the circuit (Fig. 10).
Thus, the origins of the malfunctions at 800 MHz and 1050 MHz are partially clarified via the LEI-based observations and diagnoses.
IV. DISCUSSION
The spatial resolution of the present setup is 0.25 mm/pixel as mentioned above and can be modified by a replacement of the optical lens set shown in Fig. 2 through a reduction of the laser beam diameter on the EO crystal plate. Indeed, optical magnification up to ×10 has been demonstrated in separate experiments [Reference Tsuchiya and Shiozawa23], which leads to a pixel resolution of 0.025 mm/pixel. This resolution value seems sufficiently small even for microstrip lines of low voltage differential signaling on printed circuit boards of submillimeter thicknesses.
Here, one should note, however, that the capability of distinguishing between tow separate but adjacent electrical signals on an image is not fully determined by those pixel intervals but is affected by three-dimensional field distributions, i.e. lateral spreads and mutual overlap, of evanescent fields over the signal lines to be analyzed and/or diagnosed. The following factors are also influential via the lateral spreads of field distributions of concern; thickness of EO crystal plate, the distance between the signal lines and the EO crystal plate, and the permittivity of matters over the signal lines (the sapphire plate, the EO crystal plate, and their holders in the present setup).
The three-dimensional distributions of evanescent fields perturb the sensitivity and the reproducibility of the LEI visualization also. Beside quantitative evaluations on those effects, a standardized method of image quality evaluations is crucially needed. Also it is noticeable that those features of the LEI observation system depend strongly on the EO crystal sensitivity and, therefore, possible sensitivity improvement leads to a solution. Further extended investigations and discussions are needed for those issues.
V. CONCLUSION
We have demonstrated a novel scheme for experimental analyses and diagnoses of RF and high-speed circuitry on the basis of real-time RF wave observations; an LEI camera is used in the scheme. The scheme is applied to three kinds of basic circuit patterns as well as to an ECL prescaler circuit. The visualization performance, analyses, and diagnosis trials are discussed by referring images of trapping, resonance, and coupling phenomena in the circuits.
The visual-intuitive analyses and diagnoses that are carried out using experimental observations are a highly unique feature of the LEI scheme and are shown to be fairly effective in helping a researcher/engineer grasp the essential features of signal wave propagation. Further extensions of the scheme are desirable and might provide further insights into the characteristics of RF circuitry.
ACKNOWLEDGEMENTS
The authors wish to express their sincere gratitude to Mr. Takahiro Hashiba of KNCT for his assistance. Thanks are due to Ms. Chiaki Nakajima, Mr. Masashi Sato, and Mr. Yuji Shiota of KNCT as well as to Dr. Kiyotaka Sasagawa of NAIST, and Dr. Atsushi Kanno and Dr. Toshiaki Kuri of NICT for their technical support. The authors would like to acknowledge encouragements provided by Ms. Kanako Nakagawa, Mr. Shinichi Shirasu, and Dr. Yuichi Matsushima of NICT, and Professor Toshifumi Morimoto of KNCT; they also acknowledge intensive discussions with Dr. Masato Kishi of the University of Tokyo and Dr. Mizuki Iwanami of NEC. The authors appreciate the encouragement provided by Professor Joji Hamasaki.
 Masahiro Tsuchiya was born in Shizuoka, Japan, on September 28, 1960. He received his B.E., M.E., and Ph.D. degrees in electronic engineering from the University of Tokyo, Japan, in 1983, 1985, and 1988, respectively. In 2003, he joined the National Institute of Information and Communications Technology (NICT), Tokyo, Japan, and is presently an NICT executive researcher. His research interests include electronics and optoelectronics associated with info-communication systems. Dr. Tsuchiya is a member of the Institute of Electronics, Information, and Communication Engineers, Japan, and the Japan Society of Applied Physics.
 Takahiro Shiozawa was born in Tokyo, Japan, on December 14, 1957. He received his M.S. and Ph.D. degrees in electrical engineering from the University of Tokyo, Japan, in 1982 and 2005, respectively. In 1982, he joined the Yokogawa Electric Corporation, Tokyo, Japan. In 1990, he joined the Opto-Electronics Research Laboratories, NEC Corporation, Kanagawa, Japan. He is now with the Kagawa National College of Technology, Kagawa, Japan. His research interests include optical electronics and optical communication systems. Dr. Shiozawa is a member of the Institute of Electronics, Information, and Communication Engineers, Japan, and the Japan Society of Applied Physics.