


Introduction
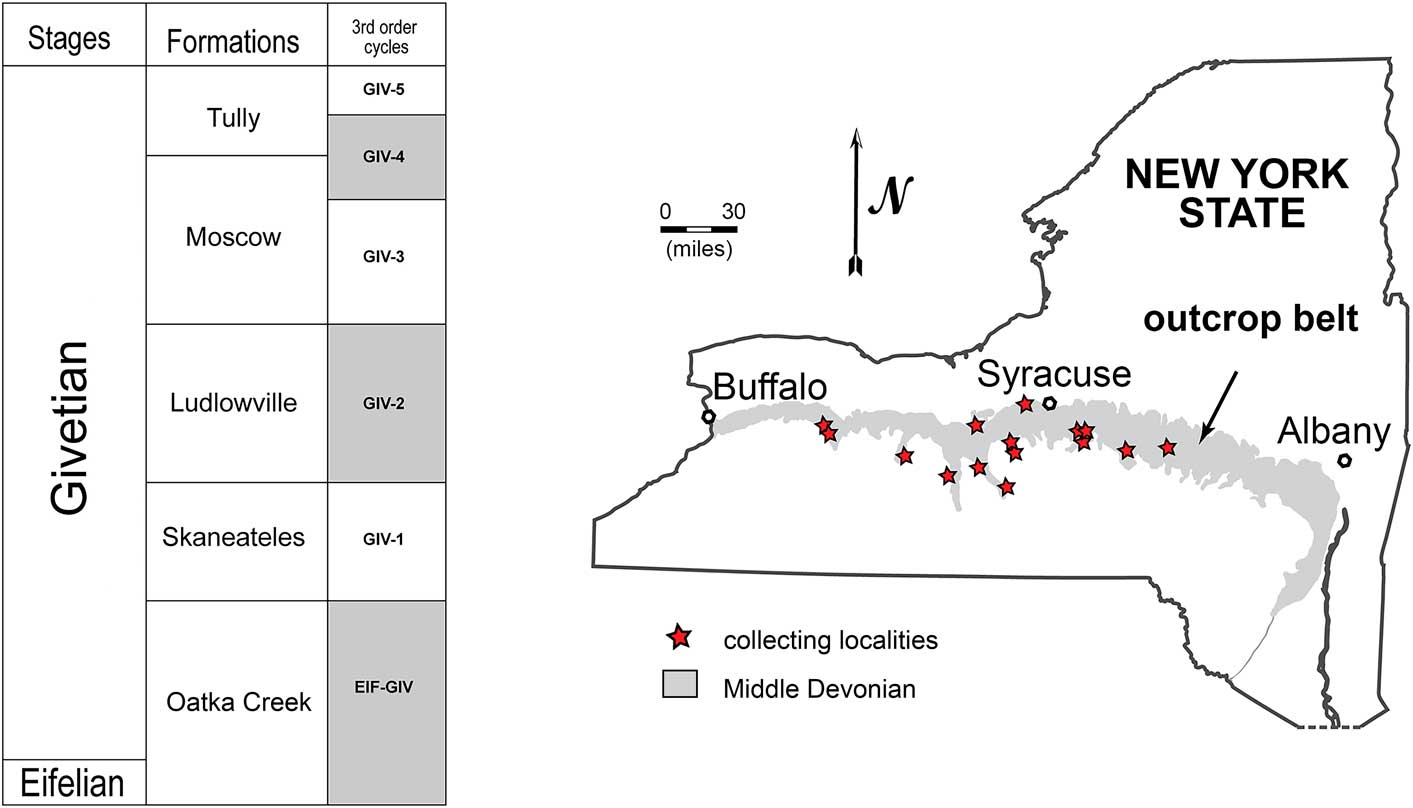
The pterineid bivalve Actinopteria boydi (Conrad, Reference Conrad1842) is an important constituent of the Middle Devonian shallow-water epibenthos of the Hamilton fauna of New York (Fig. 1; Grasso and Wolfe, Reference Grasso and Wolff1977; Linsley, Reference Linsley1994; Brett et al., Reference Brett, Bartholomew and Baird2007a). These cosmopolitan suspension feeders are, like all pterineids, known for their phenotypic flexibility (Tëmkin, Reference Tëmkin2006; Wada and Temkin, Reference Wada and Tëmkin2008), and their abundant occurrence in the Middle Devonian of central and eastern New York provides an excellent opportunity to examine morphological variability in units characterized by overall long-term stability.
Geographic and stratigraphic distribution of examined material (based on Brett et al., Reference Brett, Baird, Bartholomew, DeSantis and Ver Straeten2010).
Brett and Baird (Reference Brett and Baird1995) recognized extended intervals of concurrent faunal persistence (coordinated stasis) in the Hamilton fauna that are terminated by environmentally induced turnover events (e.g., Brett et al., Reference Brett, Bartholomew and Baird2007a; Brett, Reference Brett2012). Coordinated stasis is characterized by patterns of taxonomic stability within and among temporally separated paleocommunities (for a review, see Brett, Reference Brett2012). Although more controversial (Ivany, Reference Ivany1996; Patzkowsky and Holland, Reference Patzkowsky and Holland1997; Olszewski and Patzkowsky, Reference Olszewski and Patzkowsky2001), studies have also documented ecological stability within particular biofacies of the Hamilton fauna (Brett et al., Reference Brett, Ivany, Bartholomew, DeSantis and Baird2009; Ivany et al., Reference Ivany, Brett, Wall, Wall and Handley2009).
At the level of species and populations, individual lineages identified within the Hamilton fauna have yielded important case studies for punctuated equilibrium (e.g., Eldredge, Reference Eldredge1974; Pandolfi and Burke, Reference Pandolfi and Burke1989; Lieberman et al., Reference Lieberman, Brett and Eldredge1995). Periods of small scale morphological fluctuations have been described separating times of rapid speciation (e.g., Eldredge and Gould, Reference Eldredge and Gould1972; Gould and Eldredge, Reference Gould and Eldredge1977; Eldredge et al., Reference Eldredge, Thompson, Brakefield, Gavrilets, Jablonski, Jackson, Lenski, Lieberman, McPeek and Miller2005). The processes behind this stability remain controversial (e.g., Hansen and Houle, Reference Hansen and Houle2004; Eldredge et al., Reference Eldredge, Thompson, Brakefield, Gavrilets, Jablonski, Jackson, Lenski, Lieberman, McPeek and Miller2005; Estes and Arnold, Reference Estes and Arnold2007; Futuyma, Reference Futuyma2010), but the phenotypic variability of taxa during these intervals has attracted attention as an indicator of the capacity of species to respond to changes in their environment (e.g., Dietl, Reference Dietl2013) and its role in diversification and speciation (e.g., Pfennig et al., Reference Pfennig, Wund, Snell-Rood, Cruickshank, Schlichting and Moczek2010).
Geometric morphometric techniques employing Cartesian landmarks have improved the fidelity of quantifying complex morphologies providing for a more robust method of examining patterns of multivariate variation in shape through time (Roth and Mercer, Reference Roth and Mercer2000; Webster and Sheets, Reference Webster and Sheets2010; Cruz et al., Reference Cruz, Pante and Rohlf2012). Using these techniques, we study the phenotypic variation of Actinopteria boydi in the stratigraphic and paleoecological context of the Middle Devonian Hamilton fauna.
Only a few recent studies have focused on Devonian pterineids (McAlester, Reference McAlester1962a, Reference McAlester1962b, Reference McAlester1963; Bailey, Reference Bailey1983; Johnston, Reference Johnston1993; Rode, Reference Rode2004). Antiquated typological species concepts defining many of these species lack diagnostic criteria and often fail to recognize potential morphological variation within natural populations. Departing from Newell and LaRocque’s (Reference Newell and LaRocque1969) classification, we consider Actinopteria Hall, Reference Hall1884 to be a distinct genus (separate from Ptychopteria Hall, Reference Hall1883) and the material in this study is assigned to A. boydi. This paper provides a brief discussion of the taxonomy of this species (see below), which, although not an exhaustive treatment, can serve as preliminary guide to comparisons of similar taxa in North America.
Geologic setting
The material for this study comes from the Middle Devonian Hamilton Group of central and western New York (Fig. 1). These marine deposits accumulated in the Appalachian foreland basin that formed parallel to the Acadian mountain belt (Lash and Engelder, Reference Lash and Engelder2011). This orogeny, coupled with high sea levels during the Middle Devonian, resulted in much of present-day central and western New York being covered by an epeiric sea (Brett and Baird, Reference Brett and Baird1996). The stratigraphic and facies framework of the Hamilton Group has been thoroughly documented (for a review, see Cooper, Reference Cooper1929, Reference Cooper1935; Brett and Baird, Reference Brett and Baird1985, Reference Brett and Baird1996; Brett, Reference Brett1986; Batt, Reference Batt1996; Brett et al., Reference Brett, Baird, Bartholomew, DeSantis and Ver Straeten2010). These strata are predominantly composed of an eastward-thickening wedge of clastic marine sediments with a minor carbonate component, which transitions eastward to the coastal- and fluvial-dominated depositional sequences of the Catskill Delta complex (Cooper, Reference Cooper1935; Ettensohn, Reference Ettensohn1985). The Hamilton Group comprises five formations: Union Springs, Oatka Creek, Skaneateles, Ludlowville, and Moscow formations. Together with the overlying Tully Formation, these units span ~5.0−5.5 Myr based on recent cyclostratigraphic calibration (Ellwood et al., Reference Ellwood, Tomkin, Hassani, Bultynck, Brett, Schindler, Feist and Bartholomew2011). The faunal assemblages found in these deposits are typical Paleozoic communities dominated by moderately diverse, sessile, epifaunal suspension feeders (e.g., Ivany et al., Reference Ivany, Brett, Wall, Wall and Handley2009).
Material and methods
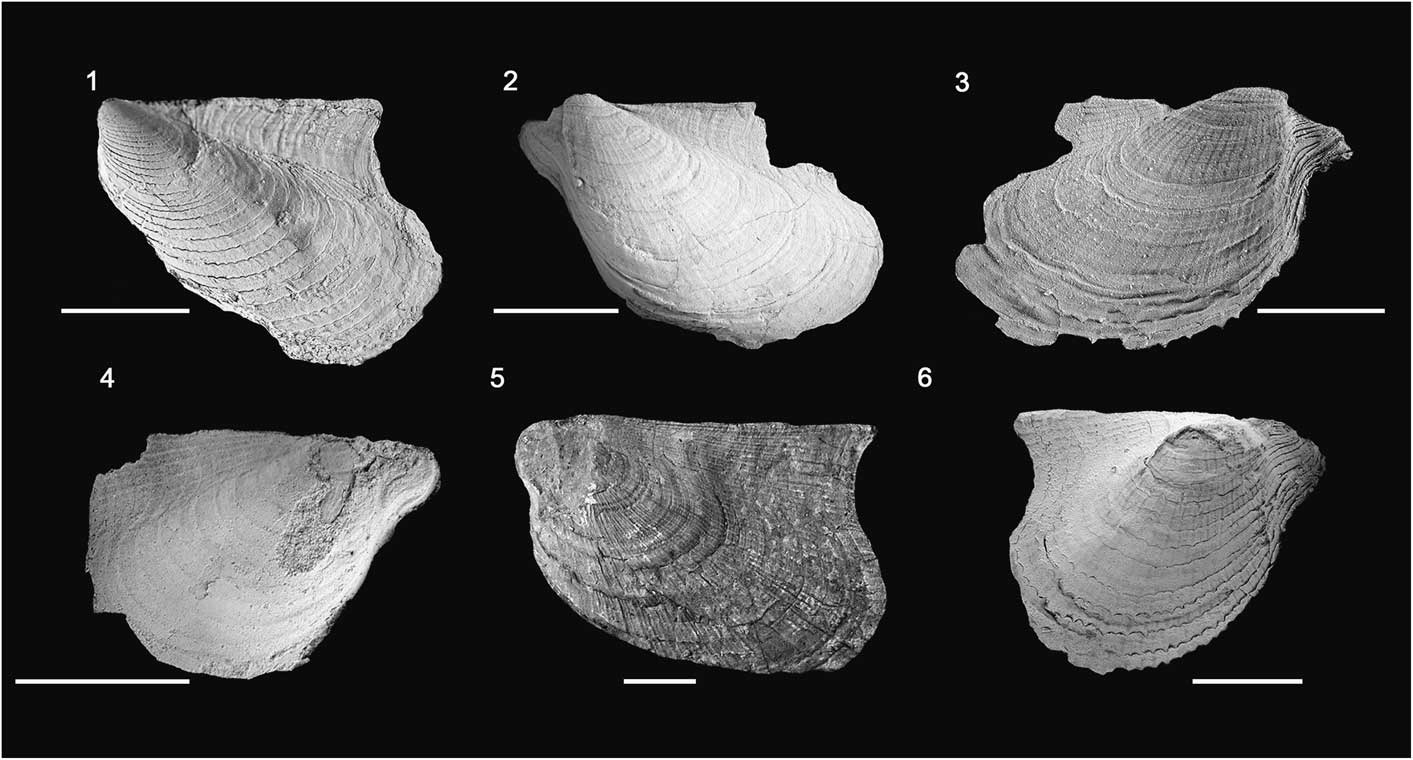
Our material of Actinopteria boydi was collected from 16 localities across central and western New York (Fig. 1). Four additional specimens had only vague locality but detailed stratigraphic data. The material comes from three stratigraphic levels: the Skaneateles (GIV-1), Ludlowville (GIV-2), and Moscow (GIV-3) formations spanning ~3–4 Myr (Fig. 1; Table 1; Brett et al., Reference Brett, Baird, Bartholomew, DeSantis and Ver Straeten2010). These units comprise depositional sequences characterized by transgressive, highstand, and falling-stage systems tracts (Fig. 1; Brett et al., Reference Brett, Baird, Bartholomew, DeSantis and Ver Straeten2010). Each of the four formations represents approximately a third-order cycle of sea-level change lasting ~1–1.5 Myr (Brett and Baird, Reference Brett and Baird1996; Brett et al., Reference Brett, Ivany, Bartholomew, DeSantis and Baird2009). The transgressive system tracts are capped by silty mudstones and siltstones (Brett et al., Reference Brett, Baird, Bartholomew, DeSantis and Ver Straeten2010); all samples examined in this study represent material sampled from these ‘caps’ of the depositional cycles (Brett et al., Reference Brett, Baird, Bartholomew, DeSantis and Ver Straeten2010). All specimens are internal, external, and composite molds (Fig. 2) and samples from field collections were supplemented by museum specimens from the Paleontological Research Institution, the New York State Museum, and the American Museum of Natural History. Detailed descriptions of Linsley localities are available in his thesis (Linley, Reference Linsley1986).
Actinopteria boydi from the Middle Devonian of New York: (1) PRI 73120, #4 Easement Road, LV, internal mold, GIV-1, length 2.7 cm; (2) PRI 73121, Oran Gulf, LV, internal mold, GIV-1, length 2.9 cm; (3) PRI 73122, Oran Gulf, LV, external mold, GIV-1, length 3.1 cm; (4) PRI 73123, Oran Gulf, RV, internal mold, GIV-1, length 2 cm; (5) PRI 73124, Deep Run Gully, LV, internal mold, GIV-3, length 5 cm; (6) PRI 73125, Nickel Middle, LV, external mold, GIV-1, length 2.8 cm. Scale bars = 1 cm.
Number of specimens from examined lithofacies within each stratigraphic unit.

Actinopteria boydi’s valve interior, including the taxonomically important traits of musculature and dentition, are poorly known. Additionally, delicate auricles, although well known, are seldom completely preserved, leaving the outline of the shell disk and sculptural elements as the primary diagnostic traits to identify species and morphological variants. Here we use A. boydi’s disk outline to quantify morphological variation that is difficult to capture by traditional height and length measurements of the entire skeleton. Of the examined material, 171 valves were sufficiently well preserved to be used for this morphometric landmark study.
Although Actinopteria boydi is slightly inequivalve, its margins do not overlap or gape but coincide with the commissural plane. Thus, both right and left valves can be pooled into one dataset; images were mirrored prior to digitization (anterior to left). Each specimen was oriented with its commissural plane parallel to the plane of the image, avoiding distortion of the shell outline. Digital images were taken with a Canon EOS Rebel digital camera and the resulting images were converted into .tps files using the tpsUtil software package (Rohlf, Reference Rohlf2004). The image order was randomized prior to landmarking to prevent bias due to batch processing of similarly preserved specimens; landmarks were placed using the tpsdig software (Rohlf, Reference Rohlf2005).
We defined a set of seven landmarks describing the outline of the shell disk, including three type I landmarks placed on biologically homologous features of the shell and four type II landmarks describing curvature maxima of the disk outline (Fig. 3; Hennessy et al., Reference Hennessy, McLearie, Kinsella and Waddington2005). The preservation of the material limited the number of usable specimens for an outline or curve analysis (Fig. 2); to collect an adequate number of data points, we limited our landmarks to reliably reproducible landmarks describing a heptagon of the shell disk, providing biologically relevant information on the variation of its morphology. The chosen landmarks, additionally, captured the position of auricles and byssus in relation to the shell body, adding information beyond the outline of the shell disk.
Actinopteria specimen (PRI 73126, LV) with morphological characteristics and landmarks (LM). LM 1, beak (type I); LM 2, intersection of shell disk and posterior hinge line (dorsal terminus anterior of sulcus) (type II); LM 3, junction of posterior auricle and shell disk (ventral terminus of sulcus) (type I); LM 4, maximum posterior point of shell disk (type II); LM 5, maximal ventral point of shell disk (type II); LM 6, maximum anterior point of shell disk (type II); LM 7, junction of anterior auricle and shell disk (type I).

Although inconsistent preservation of intact posterior and anterior auricle extremities prevented their landmarking, the chosen landmarks include junction points of these skeletal elements with the shell disk. Landmarks were placed solely by one author to avoid the introduction of a collector bias into the dataset. In cases of insufficient outline preservation, the largest complete growth line was used for landmarking.
Landmark data were examined using MorphoJ software (Klingenberg, Reference Klingenberg2011); Cartesian landmark coordinates were scaled to centroid size, rotated, and translated through a Generalized Procrustes Analysis (GPA), eliminating size, location, and rotation effects before further analysis (Rohlf, Reference Rohlf1990, Reference Rohlf1999; Bookstein, Reference Bookstein1991; Slice, Reference Slice2001). The superimposed coordinates were then examined in a principal component analysis (PCA) to generate a series of vectors that summarize variation and covariation of the disk shape, allowing us to observe and interpret its variation (Zelditch et al., Reference Zelditch, Swiderski and Sheets2012). Canonical variate analyses (CVA) of the superimposed coordinates were used to describe and analyze and the difference between material assigned to predefined groups (stratigraphy and facies) (Zelditch et al., Reference Zelditch, Swiderski and Sheets2012). Thin-plate spline visualizations (Bookstein, Reference Bookstein1991) further provided graphic descriptions of shape transformations represented by the vectors resulting from the PCA.
The landmark data were analyzed to determine whether trends in shape can be discriminated across temporal and environmental gradients. Specimens were categorized by matrix grain size (silt, fine silt, or mud) to compare morphologies recorded in different lithologies. To determine significant shape differences through time intervals, specimens were grouped by stratigraphic level and compared; the principal component values were processed in PAST with a Mann-Whitney U pairwise to test for significant differences between groups (stratigraphic units/lithologies) (Hammer et al., Reference Hammer, Harper and Ryan2001).
Suprageneric systematic assignments follow those from the Treatise of Invertebrate Paleontology (Cox et al., Reference Cox, Newell, Boyd, Branson, Casey, Chavan, Coogan, Dechaseux, Fleming, Haas, Hertlein, Kauffman, Keen, LaRocque, McAlaster, Moore, Nuttall, Perkins, Puri, Smith, Soot-Ryen, Stenzel, Trueman, Turner and Weir1969).
Repository and institutional abbreviation
PRI, Paleontological Research Institution, Ithaca, New York.
Systematic paleontology
Class Bivalvia Linnaeus, Reference Linnaeus1758
Order Pterioida Newell, Reference Newell1965
Suborder Pteriina Newell, Reference Newell1965
Superfamily Pterioidea Gray, Reference Gray1847
Family Pterineidae Miller, Reference Miller1877
Genus Actinopteria Hall, Reference Hall1884
Type species
Avicula decussata Hall, Reference Hall1843, by subsequent designation (Bassler, Reference Bassler1915).
Diagnosis
Johnston (Reference Johnston1993, p. 48) revised the genus as: “Biconvex, moderately to slightly inequivalved, weakly inflated; right valve (RV) can be flattened distally at advanced growth stages; radial ribs thin, closely spaced, weaker on RV; anterior auricle small with rounded to flattened anterior edge; byssal sinus broad and shallow; byssal notch absent; posterior auricular sinus moderately to well developed; anterior adductor scar absent; auricular buttress prominent, thin and well differentiated from hinge plate; hinge plate narrow below ligament area, with 1–3 cardinal teeth per valve; cardinal teeth moderately to strongly prosocline through most of ontogeny (anteriormost tooth can be suborthocline at early to intermediate growth stages); 1–2 posterolateral teeth per valve and weakly divergent from hinge axis; edentulous gap separating cardinal and posteriolateral teeth.”
Remarks
Although varying in rank, the taxonomic concept of Actinopteria has been fairly stable over the past century. Like the observations by Amler (Reference Amler1995) and Rathmann and Amler (Reference Rathmann and Amler1992), we depart from Newell and LaRocque’s (Reference Newell and LaRocque1969) classification and consider Actinopteria as a distinct genus rather than a subgenus of Ptychopteria. It can be differentiated from Ptychopteria by lacking a truncated anterior auricle. Ptychopteria is more strongly inflated than Actinopteria and develops a deep byssal notch and strongly inflated anterior auricle (Bailey, Reference Bailey1983). Although similar in shape and development of auricles, Actinopteria can be differentiated from Leiopteria Hall, Reference Hall1883, which is also common in the Hamilton fauna, in having both radial and commarginal ornament, whereas Leiopteria possesses only concentric commarginal ornamentation. Differences between Actinopteria and Cornellites Williams, Reference Williams1908 can be found in the gibbous, highly inflated left valve (LV) and only slightly convex to flat RV (LaRocque, Reference La Rocque1950). Cornellites develops strong radial ribs on the LV and lacks ornamentation on the RV. Cornellites is characterized by a pronounced anterior auricle, whereas Actinopteria develops a stronger procrescent growth vector (LaRocque, Reference La Rocque1950). Leptodesma Hall, Reference Hall1883 is set apart from Actinopteria by the lack of radial ornament on its shell disk. Limoptera’s radial ribs are more prominent and widely spaced than in Actinopteria, and Limoptera’s outline is broader, suborthocline, and larger on average (Johnston, Reference Johnston1993).
Actinopteria boydi (Conrad, Reference Conrad1842)
1842 Avicula Bodyii Reference ConradConrad, p. 237, pl. 12, fig. 4.
1883 Actinopteria boydi; Reference HallHall, pl. 19, figs. 2–24, 26–30, pl. 23, figs. 5, 6.
1883 Actinopteria delta Reference HallHall, pl. 23, fig. 3.
1883 Actinopteria epsilon Reference HallHall, pl. 23, figs. 4–6, 8.
?1883 Actinopteria zeta Reference HallHall, pl. 23, fig. 9.
1884 Actinopteria boydi; Reference HallHall, p. 113, pl. 19, figs. 2–24, 26–30, pl. 84, figs. 16, 17.
?1884 Actinopteria pusila Reference HallHall, p. 123, pl. 84, fig. 3.
?1884 Actinopteria iota Reference HallHall, p. 127, pl. 84, fig. 7.
?1884 Actinopteria eta Reference HallHall, p. 124, pl. 84, figs. 8–11.
?1884 Actinopteria theta Reference HallHall, p. 125, pl. 84, figs. 18, 19.
?1884 Actinopteria delta; Reference HallHall, pl. 121, pl. 23, fig. 3.
1884 Actinopteria epsilon; Reference HallHall, pl. 122, pl. 23, figs. 4–6, 8.
?1884 Actinopteria zeta; Reference HallHall, p. 123 pl. 23, fig. 9, pl. 84, figs. 1, 2.
1962a Actinopteria boydi; Reference McAlesterMcAlester, p. 23, pl. 3, figs. 25, 26 [see for synonymy].
Lectotype
McAlester (Reference McAlester1962a, p. 28) designated Conrad’s original specimen (Reference Conrad1842, pl. 12, fig. 4) as the lectotype. Unfortunately, as noted by McAlester (Reference McAlester1962a) and subsequent inquiries by the authors, the whereabouts of this specimen is unknown.
Revised diagnosis
Medium-sized to large Actinopteria; shape of shell disk varying from subcircular to narrow; procrescent growth vector present; angle between hinge line and posterior sulcus variable. Ornamentation consisting of densely packed, evenly spaced, fine radial costae and evenly spaced, incremental commarginal growth lines covering entire disk and both anterior and posterior auricles.
Occurrence
The type material is from the Middle Devonian (Givetian), probably Skaneateles Formation, of Hamilton, Madison County, New York, U.S.A. Actinopteria boydi has thus far been identified only from Middle and Upper Devonian of the Hamilton, Genesee, Sonya, and West Falls groups of northeastern North America. Our study includes only specimens from the Middle Devonian Hamilton Group of New York State.
Description
Shell medium to large (maximum length=8 cm); inequilateral; inequivalve left valve more convex than weakly inflated to flattened RV; umbo broadly convex, with beak slightly extending above dorsal margin and subterminal; main disk oblique and weakly retrocrescent with tightly curved posterior margin and more gently curved ventral margin; posterior auricle broad with long straight dorsal margin, delimited from main disk by sulcus; posterior auricular sinus shallow in adults, but more pronounced in juveniles; anterior auricle small, rounded, clearly delimited from main disk by narrow sulcus and byssal sinus; byssal notch absent. Ornamentation consisting of densely packed radial costae, extending nearly all the way from beak to valve margin and occurring on both anterior and posterior auricles; undulations present in commarginal growth lines in some specimens, and some composite molds of LV preserving reticulate surface sculpture. RV weakly concave, with flattened umbo, posterior auricle extended as in LV, anterior auricle smooth, rounded, with sharp byssal sinus; radial sculpture weak to absent later in ontogeny. Pallial line continuous, extending parallel to shell margin from posterior adductor impression to small anterior adductor scar situated just anterior of beak. Ligament internal, supported by two or three longitudinal grooves parallel to dorsal hinge margin. Dentition unknown.
Materials
Skaneateles Formation: Pompey Road Cut: 8 LV, 6 RV; Rt. 5: 9 LV, 3 RV; Rt. 12 North (Linsley loc. 20): 5 LV; South Five Corners (Linsley loc. 22): 1 LV, 1RV; Dipleura locality (Linsley loc. 11): 3 LV; Nickel Middle (Linsley loc. 21): 5 LV; 4 Easement Road: 2 RV; Oran Gulf Quarry: 44 LV, 24 RV. Ludlowville Formation: Madison County: 1 LV; Livingston County: 1 LV; Cayuga Lake: 1 LV, 3 RV; Cascade Road Cut: 9 LV, 4 RV; Coon Hill: 1 RV; Little Beards Creek: 2 LV; Skaneateles Lake: 5 LV, 1 RV. Moscow Formation: Otsego County: 1 LV; Seneca Lake: 1 LV; Taughannock Lower Falls: 1 LV; Deep Run Gully: 3 LV, 1 RV; Long Hill Road: 1 RV; Kashong Creek: 1 LV, 2 RV; Soul Road: 4 LV; Cayuga Lake: 11 LV, 3 RV.
Remarks
Structures of internal morphology, including dentition, ligament, and musculature, are for the most part unknown and must be inferred from closely related species. Because of the apparent stability within pterineid families and the close relationship between Actinopteria boydi and A. decussata (see below), it is reasonable to assume that A. boydi has shell ultrastructure similar to that in A. decussata as described by Carter (Reference Carter1990) and Carter and Tevesz (Reference Carter and Tevesz1978) with a simple prismatic outer layer and nacreous inner layers. Likewise, the dentition of A. boydi could be cardinal teeth and 1–2 posterior lateral teeth extending nearly the length of the hinge margin (Johnston, Reference Johnston1993). Because the valve interiors of A. boydi are poorly known, recognition of this species relies mostly upon shape and ribbing characters.
In the Middle Devonian of New York, Actinopteria boydi is most likely to be confused with A. decussata or A. subdecussata Hall, Reference Hall1843. The last two species are described as having a stronger procrescent growth vector and a more clearly defined posterior auricular sulcus than in A. boydi. Our data illustrating the variation of shell disk shape in different facies and the material reviewed for this study suggest that A. decussata and A. subdecussata could be synonyms of A. boydi (see also McAlester, Reference McAlester1962a). A more comprehensive review including all Devonian Actinopteria taxa will further clarify the taxonomic situation of these related species.
Actinopteria boydi differs from A. taberi McAlester, Reference McAlester1962b, known from the Frasnian of Alaska (McAlester, Reference McAlester1962b), in being smaller, having more subdued ribs on the LV, a relatively larger anterior auricle, and more retrocrescent shape. Other Upper Devonian forms described from New York by Hall (Reference Hall1883, Reference Hall1884, e.g., A. delta, A. epsilon, A. zeta, etc.) might prove to be conspecific with A. boydi as predicted by McAlester (Reference McAlester1962a).
Results
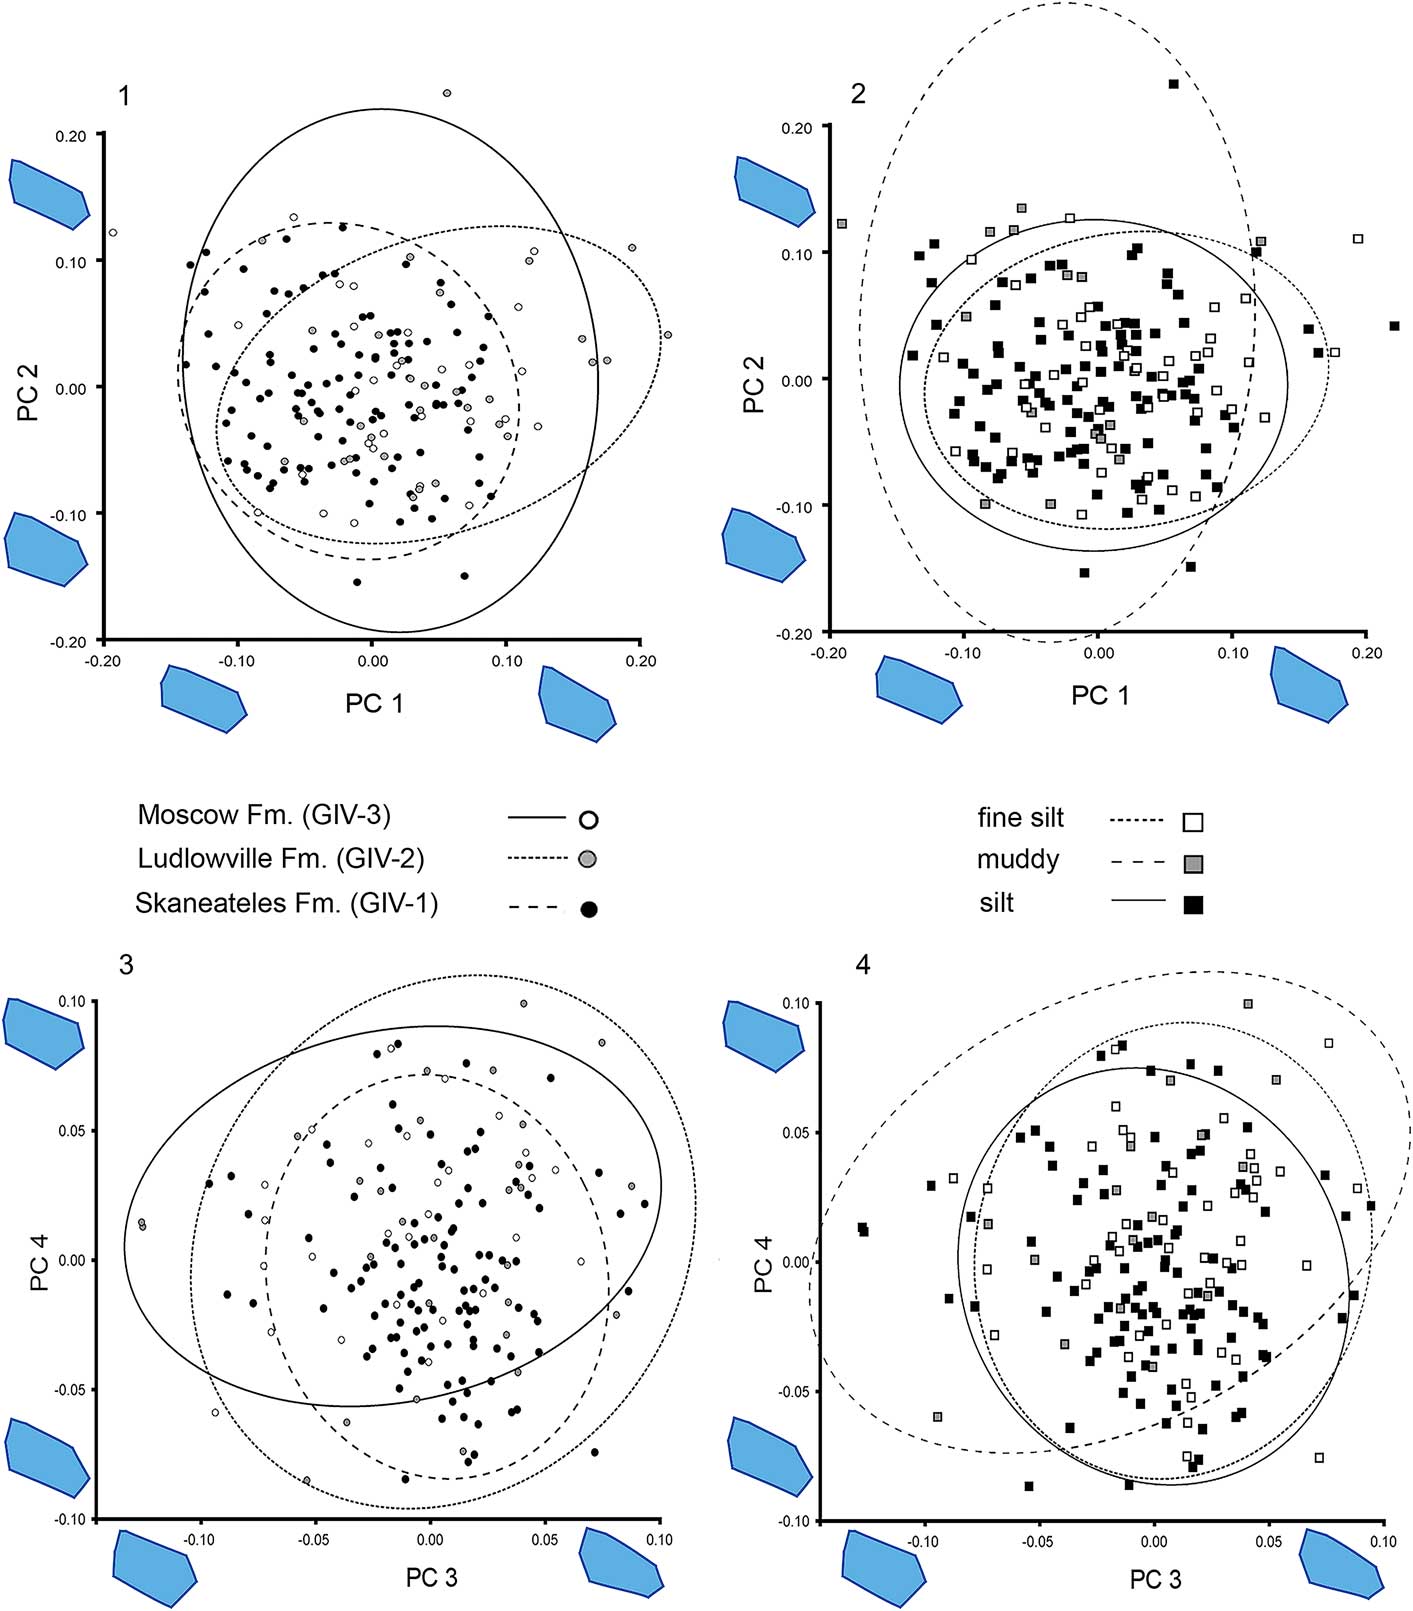
The PCA analysis of the landmark data shows that 32.4% of variation is summarized by PC 1 and 31.2% by PC 2; PC 3 and PC 4 account for 12% and 10.3% of the variance, respectively. Morphological variation captured by PC 1 is an anteroventral expansion of the valve disk (Fig. 4). The posterior portion of the sulcus shortens and the angle between the hinge line and posterior sulcus becomes wider (Fig. 4). The shell variability expressed by PC 2 is characterized by an increase of the anterior shell area relative to the posterior and an overall narrowing of the disk (Fig. 4); PC 3 and PC 4 describe the variation in length of the posterior sulcus and its angle in relation to the hinge line (Fig. 4).
Thin-plate spline demonstrating the average deformation of shell disk for PC 1 through PC 4 with the consensus shape depicted at the center. Red/hot = positive deformation; blue/cold = negative deformation).

Specimens from the Ludlowville Formation are on average narrower and more retrocrescent in outline than the Skaneateles material (Fig. 5.1). Those from both the Skaneateles and Ludlowville formations exhibit the same distribution in the morphospace defined by PC 3 and PC 4, with more variation present in the Ludlowville samples (Fig. 5.2). The material from the Moscow Formation includes more specimens with subcircular outlines and is more variable (PC 1 and PC 2; Fig. 5.1). Moscow specimens develop, on average, a longer posterior sulcus (PC 3 and PC 4, Fig. 5.3) than are found in the two older samples. A pairwise comparison of PC 1 through PC 4 values, grouped by their stratigraphic position, confirms these observations (Table 2). For PC 1, specimens from the Skaneateles Formation are significantly different from those from the younger Ludlowville and Moscow formations (p<0.001, Table 2). Comparing Ludlowville and Moscow formation specimens, on the other hand, does not yield significant results (p=0.15, Table 2). The only other significant difference can be found in comparison of Skaneateles and Moscow material PC 4 values (p=0.03, Table 2).
Principal components analysis scatterplot with 90% confidence ellipses of sample mean. Wire frames (shape scale factor −0.1 to 0.1) showing shape change along PC axis.
P-values of Mann-Whitney pairwise comparison of samples grouped by stratigraphic units using PC 1 and PC 2 values; asterisk denotes significant p-value.

Specimens collected in silt and fine silt facies develop similar morphological shell disks (Fig. 5.2); this is supported by the pairwise comparison of the PC 1 through PC 4, showing no significant differences among specimens from these substrates (Table 3), whereas specimens from the muddy facies are significantly different from those of the silt (PC 4, p=0.03) and fine silt samples (PC 1, p=0.02). On average, this mud-morph develops broader, circular shell disks with longer posterior sulci than the specimens from coarser sediments (Fig. 5.4).
P-values of Mann-Whitney pairwise comparison of samples grouped by lithofacies (PC 1 through PC 4 values); asterisk denotes significant p-value.

Skaneateles and Ludlowville formations (Table 1) include comparable numbers of specimens from the three lithofacies, but the Moscow Formation includes more specimens from the muddy facies. The overrepresentation of one facies in the youngest samples might have biased the data toward morphologies more prevalent in the muddy facies.
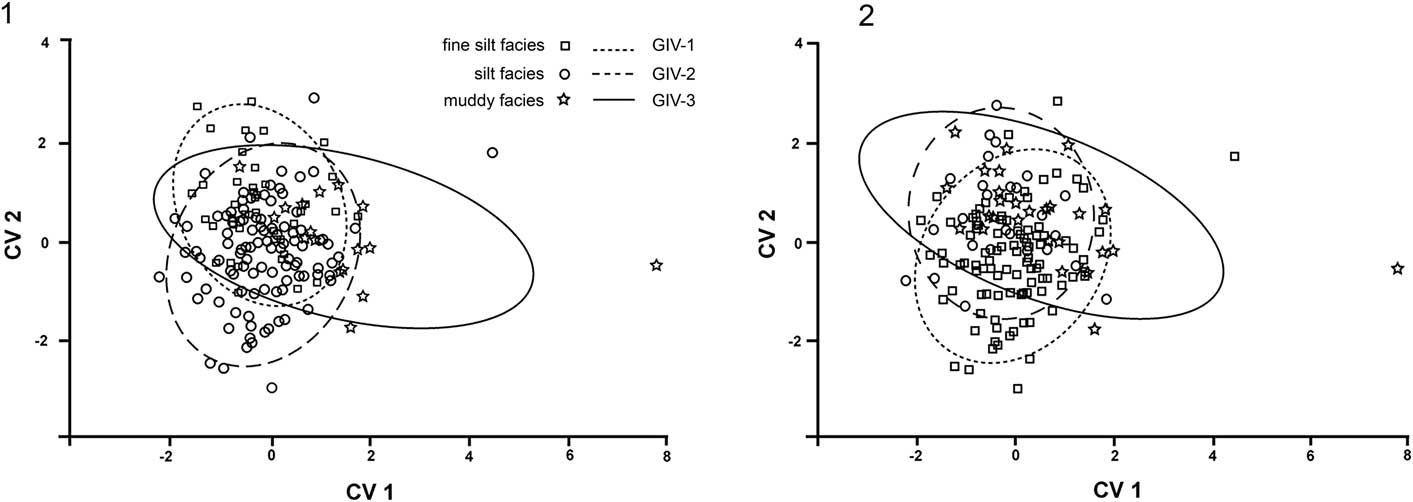
A CVA analysis of the differences among specimens grouped by stratigraphic position and facies relative to within-group variance (Fig. 6) demonstrates no clear separation of groups. Comparing stratigraphic units, CV 1 axis comprises 80% and CV 2 axis 20% of the variation; examining facies groups, CV 1 represents 59% and CV 2 41% of the variation. Most of the difference among groups can be found in development of the posterior sulcus and its orientation in relation to the hinge line. Skaneateles and Ludlowville formation specimens occupy much of the same morphospace. Material from the Moscow Formation is more variable, encompassing much of the range of both Skaneateles and Ludlowville formations (Fig. 6.2). Comparing the different lithofacies groups, the CVA expresses variation of the outline from more circular (CV 1) to more retrocrescent (CV 2) as the main difference among the three lithofacies (Fig. 6.1). Shell disks of specimens from the muddy facies are, on average, rounder, whereas specimens from fine silt and silt vary along the CV 2 axis, with fine silt samples being more retrocrescent than those from the silt facies.
Canonical variate analysis based on shape variations, grouped by facies (1) and stratigraphic position (2), all showing 90% confidence ellipses of population mean. fs = fine silt; GIV-1 = Skaneateles Formation; GIV-2 = Ludlowville Formation; GIV-3 = Moscow Formation; s = silt; m = muddy.
Discussion
It has been postulated that coordinated stasis is not only expressed in the taxonomic composition of a particular marine benthic community, but is also reflected in lineage-level morphological stasis (Brett, Reference Brett2012). For example, Lieberman et al. (Reference Lieberman, Brett and Eldredge1995) found morphological fluctuation in two brachiopod lineages rather than directional morphological change; our data support these results. Our results show that specimens from the Ludlowville Formation develop, on average, shell disks that have a slightly wider posterior sulcus and are anteroposteriorly shortened compared to older specimens from the Skaneateles Formation. The Moscow variant generally develops more circular specimens with longer posterior sulci, resulting in a slightly greater difference between the youngest samples and the rest. Despite these differences, the overall variability in the Actinopteria boydi lineage is generally not great. We found a statistical difference between the oldest Skaneateles Formation and the Ludlowville and Moscow samples, but these are limited to PC 1, which accounts for only 32% of the variation. Despite this difference, no distinct morphotypes distinguishing these two stratigraphic levels can be observed in the PCA analysis (Fig. 5). The variation captured is mostly driven by the greater variability of Ludlowville specimens’ outlines, but is not great enough to establish distinct morphological groups from the examined stratigraphic units.
The difference between Skaneateles and Moscow formations found in PC 1 and PC 4 seems to be an expression of the high proportion of mud morphs included in the Moscow material. Although only 1.9% of Skaneateles specimens are from this lithofacies, mud morphs comprise 41.4% of the Moscow specimens (Table 1). The overrepresentation of the distinctly different variant (see below) combined with a small sample size for the Moscow Formation could explain the significant difference between Moscow and Skaneateles samples. Additionally, the results of the CVA analysis showed no clear separation among the stratigraphic groups (Fig. 6). In summary, although differences can statistically be detected, these are limited to individual PC axes that do not amount to great overall differences. However, more data are needed to conclusively exclude or confirm phyletic change during this time period.
The Moscow sample exhibits a high degree of morphological variability within the sample. Modern organisms have been observed to respond to environmental perturbation by an increase of phenotypic plasticity (e.g., Hoffmann and Parsons, Reference Hoffmann and Parsons1997; Hoffmann and Hercus, Reference Hoffmann and Hercus2000; Chevin et al., Reference Chevin, Collins and Lefèvre2013). The reduction of suitable habitat, due to a major regression and the associated loss of habitable shelf area at the boundary of the Ludlowville and Moscow formations (Brett et al., Reference Brett, Hendy, Bartholomew, Bonelli and McLaughlin2007b, Reference Brett, Baird, Bartholomew, DeSantis and Ver Straeten2010; Ellwood et al., Reference Ellwood, Tomkin, Hassani, Bultynck, Brett, Schindler, Feist and Bartholomew2011) might represent such a disturbance, causing the increased morphological variability observed in the Moscow sample.
Our data show that specimens from the muddy facies generally develop broader and more circular shell disks with a longer posterior sulcus than samples from other facies. These morphologies suggest a link to environmental factors. Actinopteria boydi’s life habit was thoroughly discussed by Johnston (Reference Johnston1993) and has been interpreted as epifaunal and byssally attached to objects on the sea floor. Our data show that the location of the byssus at the ventral margin of the anterior auricle remains stable in relation to the rest of the shell (Fig. 4), suggesting that the low-angled epifaunal life position with the slightly inclined commissure of A. boydi remained more or less unchanged throughout the time interval. Johnston (Reference Johnston1993) demonstrated experimentally that morphologically similar taxa, such as the extant Pinctada sugillata (Reeve, Reference Reeve1857), utilize the shape of their posterior wing to channel water via the sulcus to the posterior inhalant siphon. Low pressure created by the water current enhances water intake by passive ventilation, resulting in lower energy expenditure during feeding. The broader shell disk of the mud morph might have maximized the flow velocity along the shell and in combination with a long posterior sulcus improved flow rates of water channeled over the posterior shell portion that is especially beneficial in environments with low water energy.
Overall, our data show no significant shift in disk morphology of Actinopteria boydi through ~3–4 Myr. We could not observe any group that was distinct enough to warrant separation of a distinct taxon in this time interval, hence, we conclude that the A. boydi lineage was in evolutionary stasis and that the observed differences are ecophenotypic variation of a single taxon in response to environmental conditions.
Acknowledgments
We would like to thank St. Lawrence University for partial funding of this project through the M.J. Erickson Geology University Fellows Endowment, and the Paleontological Research Institution in Ithaca for granting us access to their collections. We also thank M. TenEyck, SUNY Cortland, for assisting with photography of specimens.



