I. INTRODUCTION
Oxide materials are promising candidates for high-temperature thermoelectric (TE) applications. In contrast to conventional TE materials based on Bi2Te3, which are toxic and have limited chemical stability above T ∼523 K in air, they are temperature-stable, oxidation-resistant, and nontoxic.Reference Reddy, Noudem, Hebert and Goupil1–Reference Funahashi, Matsubara, Ikuta, Takeuchi, Mizutani and Sodeoka4 Oxide materials, especially with perovskite-type structure, can be easily synthesized with controllable composition and TE properties.Reference Weidenkaff5–Reference Aguirre, Canulescu, Robert, Homazava, Logvinovich, Bocher, Lippert, Döbeli and Weidenkaff8 The low costs of these materials are beneficial as well. The advantage of Bi2Te3-based TE materials is the better performanceReference Kim, Yin and Kagawa9, Reference Yamashita and Sugihara10 expressed by the figure-of-merit, ZT = S 2T/ρκ, where S is the Seebeck coefficient, ρ is the electrical resistivity, and κ is the thermal conductivity.Reference Rowe11
The maximum conversion efficiency is thermodynamically limited by the Carnot efficiency.Reference Yang and Caillat12 The performance and conversion efficiency of TE modules depend not only on the properties but also on the compatibility factors of the used TE materials, on the geometrical factors of the TE module, and on the quality of the electrical and thermal contacts.Reference Rowe11, Reference Snyder13, Reference Omer and Infield14 The direct conversion of solar irradiation into electricity at high temperatures has recently been experimentally demonstrated.Reference Tomeš, Suter, Trottmann, Aguirre, Haueter, Steinfeld and Weidenkaff15 A heat transfer analysis of directly irradiated TE modules has shown that 60% of the incident solar radiation is lost by reradiation.Reference Suter, Tomeš, Steinfeld and Weidenkaff16 Reradiation can be significantly reduced by utilizing a solar cavity-receiver.
The objective of the work presented in this article is to show the potential of thermoelectric oxide modules (TOMs) for the direct conversion of solar heat into electrical energy as possible low-maintenance alternative to conventional technologies. To proof this concept, a series of perovskite-type TOMs were placed in a solar cavity-receiver, which is aimed at reducing reradiation and thereby enhancing the conversion efficiency of the TOMs.Reference Suter, Tomeš, Steinfeld and Weidenkaff16 TOMs were measured individually and connected in series at different radiation levels in terms of the resulting temperature distribution in the cavity, open-circuit voltage, and maximum output power at different external loads. Finally, the conversion efficiency is evaluated.
II. EXPERIMENTAL
The TE legs consisted of synthesized La1.98Sr0.02CuO4 (p-type)Reference Zhou, Zhao, Chu and Shi17 and CaMn0.98Nb0.02O3 (n-type).Reference Bocher, Robert, Aguirre, Malo, Hébert, Maignan and Weidenkaff6 Both materials were prepared by a chimie douce synthesis procedure described in previous publicationsReference Weidenkaff5 and literature cited herein. The calcined powders of La1.98Sr0.02CuO4 and CaMn0.98Nb0.02O3 were characterized by x-ray diffraction (XRD).Reference Bocher, Robert, Aguirre, Malo, Hébert, Maignan and Weidenkaff6, Reference Zhou, Zhao, Chu and Shi17 The particle size was reduced to the 1–6 μm by ball milling the phase pure powders. Subsequently, the powders were pressed into disc-shaped pellets with a diameter of 32 mm using a hydrostatic press. Both p- and n-type pellets were sintered for 5 h at 1373 K and for 5 h at 1523 K, respectively. The final p- and n-type legs with a length of L ∼5.0 mm and a cross-sectional area of A ∼5.5 × 5.5 mm2 were obtained by grinding and cutting the pellets.
The electrical resistivity and the Seebeck coefficient were measured in air with a RZ2001i Ozawa Science measurement system (Nishiki, Japan) in the temperature range of 300 K < T < 950 K. The thermal conductivity was evaluated indirectly by separate measurements of the thermal diffusivity in a laser flash apparatus (Netzsch LFA, Burlington, MA) and the specific heat by a differential scanning calorimeter (Netzsch DSC, Burlington, MA).Reference Aguirre, Canulescu, Robert, Homazava, Logvinovich, Bocher, Lippert, Döbeli and Weidenkaff8
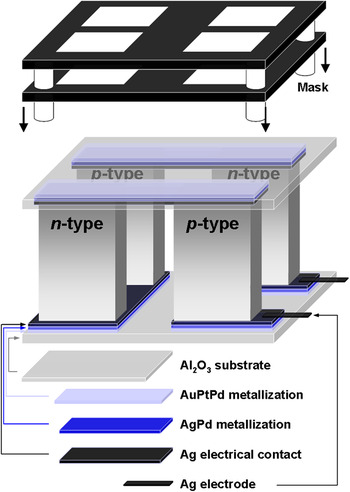
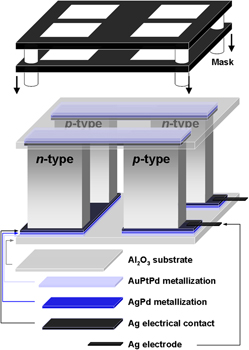
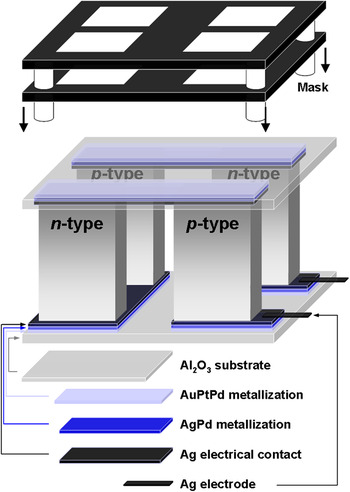
A series of four-leg TOMs were assembled by connecting the p- and n-type TE legs electrically in series and thermally in parallel between two electrically insulated and thermally conductive Al2O3 plates (Rubalit 708 S, CeramTec GmbH, Plochingen, Germany) with a cross-section of 25 × 25 mm2 and a thickness of 0.5 mm.Reference Tomeš, Robert, Trottmann, Bocher, Aguirre, Hejtmánek and Weidenkaff18 The assembly drawing is shown in Fig. 1. The electrical contacts between the TE legs and the Al2O3 plates were made by a two-step metallization process using two types of conductor paste chosen based on previous experimental observations. The first step was a two-layer screen-printingReference Chung19 through a stainless steel stencil to obtain an efficient metallization of the Al2O3 surface. This process was applied to both the surface of the TE legs and the Al2O3 plates. The first metal layer was provided by printing with 4597 AuPtPd conductor paste (DuPont, Wilmington, DE) to obtain a conductive surface, which is especially important on the electrically insulating Al2O3 plates. The AuPtPd-coated TE legs and Al2O3 plates were dried at 423 K for 15 min to evaporate the solvents, followed by annealing at 1223 K for 15 min to induce the diffusion. AuPtPd conductor paste embodied a strong adhesion on the Al2O3 surface. A second conductive layer was applied using a AgPd conductor paste (DuPont) and the same drying and annealing processes as described above. In a second step, a Ag sheet was placed between the TE legs and the Al2O3 plates on both, the hot and the cold sides of the TOMs serving as the electrical contacts. Several screening experiments revealed an improved connection of the Ag electrical contacts on an AgPd metal layer. Finally, the Al2O3 cover plates were attached and all components assembled (Fig. 1). The modules were heated at 1223 K for 1 h to solder the conductive layers and to ensure and test the thermal stability. The Al2O3 plate surface on the irradiated side was coated with a homogeneous graphite layer to increase the absorption of solar radiation.Reference Bramson20
Assembly drawing of a thermoelectric oxide module.
The performance of all TOMs was tested with a test unit: the open-circuit voltages were measured, and the maximum output power and the total resistance were evaluated. The current-voltage characteristic was recorded measuring the voltage at different external loads (Höcherl & Hackl DC load ZS 506-4 550 Watt, Konzell, Germany).21 The measurements were monitored using the LABVIEW software (National Instruments, Austin, TX).22 The output power was deduced from the current–voltage curve.Reference Tomeš, Robert, Trottmann, Bocher, Aguirre, Hejtmánek and Weidenkaff18 The hot side of the TOM was heated by a heater, and the cold side was cooled by a water-cooled Cu block. TOMs were attached to the Cu cooling block using a thermally conductive paste (DuPont) to guarantee a good heat transfer from the cold Al2O3 plate to the Cu cooling block. During the measurement, a pressure load of 80 kN·m−2 was applied to increase the heat transfer and to minimize the thermal resistance between the heater and the hot plate. The temperature on the hot and the cold sides of TOMs was measured using two K-type thermocouples.
The TOMs were tested in a solar cavity-receiver for their ability to convert solar radiation generated by a high-flux solar simulator (HFSS)Reference Hirsch, Zedtwitz, Osinga, Kinamore and Steinfeld23 into electrical energy. The radiative flux peaks in function of the HFSS arc were measured by a Thermogage Circular Foil Flux Transducer TG1000-1 (Sequoia Technology Ltd, Reading, UK) (accuracy ±3%) placed in the center of the focal plane. The radiative flux distribution was measured optically on an Al2O3-plasma-coated Lambertian target with a CCD camera equipped with optical filters and calibrated with a Kendall radiometer (error of ±8%). The flux measurement showed a quasi constant distribution within the aperture size of 20 × 81 mm2. Radiation losses in the compound parabolic concentrator (CPC) were estimated by a three-dimensional simulation of the HFSS, the CPC, and the cavity using a Monte-Carlo ray-tracing program.Reference Petrasch24 Assuming a CPC mirror reflectivity of 0.8 and a mirror reflection of 95%, losses of ∼33.3% were simulated.
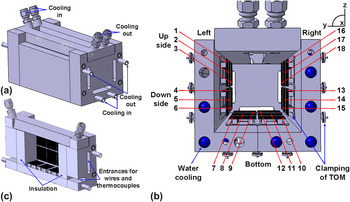
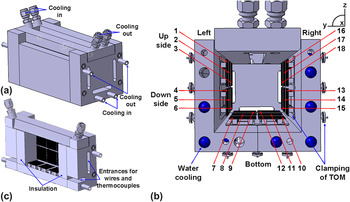
A sketch of a solar cavity-receiver designed for 18 TOMs is shown in Fig. 2. The rectangular shape of the solar cavity-receiver contains inlets and outlets for an encapsulated circulating water cooling system. The rectangular aperture for the incidence of concentrated solar radiation is at the top of the solar cavity-receiver. The integral water-cooled CPC has the function to enhance the radiative flux by a factor of 1.4 and to provide a uniform irradiation of the TE modules. This is crucial to realize equal temperature differences across each module. Besides the above-mentioned quality of the electrical and thermal contacts, the performance and conversion efficiency also depend on the packing quality of the TE modules inside the solar cavity-receiver including the lateral insulation of the TOM array (18 pcs.). All electric wires were connected at a pinboard allowing the connection to be switched from parallel (measurement of individual TOMs) to serial connection circuit (measurement of serial connected TOMs). An efficient thermal contact between the TOMs and the cooler of the solar cavity-receiver was provided by a thermal conduction paste (DuPont) and by a special clamping mechanism containing springs and ribbons (Fig. 2). The temperature on the hot side was monitored and controlled to avoid that the temperature in the cavity exceeds the melting point of Ag (T ∼1235 K) used in TOMs.Reference Bauccio25
Design of a solar cavity-receiver packed with 18 TOMs. (a) Exterior view containing the cavity and the compound parabolic concentrator, and (b) cross-sectional view and (c) longitudinal view of a solar cavity-receiver.
III. RESULTS AND DISCUSSION
The p- and n-type TE materials were hydrostatically pressed into pellets. They showed 90% of the theoretical density without any crack formation due to the uniformly applied pressure. The p- and n-type materials have thermal conductivities of 2.5 W·m−1 K−1 and 3 W m−1·K−1 above 300 K, respectively. Bocher et al.Reference Bocher, Aguirre, Logvinovich, Shkabko, Robert, Trottmann and Weidenkaff7 measured a by 0.78 W·m−1·K−1 lower thermal conductivity above 300 K for the n-type material. The difference can be attributed to modified synthesis conditions. For our case denser TE legs with better mechanical properties but different microstructure were obtained. A shorter sintering time and a lower sintering temperature (T = 1473 K) resulted in samples with different morphology and microstructure and lower theoretical density (80.77%). This result highlights that further research on the relation/trade-off between thermal conductivity and mechanical stability of the TE materials is needed to improve the thermal properties in high-temperature applications.
Similar TE properties of the p- and n-type TE materials are a prerequisite for good conversion efficiencies of TOMs as was described previously by Snyder et al.Reference Snyder13 The compatibility factor s, defined as s = [(1 + ZT)1/2−1]/ST is used to assess the similarity of the TE properties of different materials. For maximum conversion efficiencies at large temperature gradients, the compatibility factor should not vary much with temperature. The p-type (La1.98Sr0.02CuO4) and the n-type (CaMn0.98Nb0.02O3) leg materials were selected from candidate materials with regard to most suitable compatibility factors to maximize the conversion efficiency and enhance the output power.Reference Snyder13, Reference Tomeš, Suter, Trottmann, Aguirre, Haueter, Steinfeld and Weidenkaff15 Both materials have similar metallic electrical resistivities of ρ p = 24 mΩ·cm and ρ n = 20 mΩ·cm at T = 300 K, respectively. Both materials exhibit large absolute thermopower values (S p = +200 μV·K−1 and S n = −160 μV·K−1) at T = 300 K. The figure-of-merit ZT for the p- and n-type materials was published previously.Reference Tomeš, Suter, Trottmann, Aguirre, Haueter, Steinfeld and Weidenkaff15 The compatibility factors of both materials are perfectly matching around T = 425 K but differ by a factor of 1.3 at T = 500 K and by a factor of 2.3 at T = 800 K. This implies a decrease of the conversion efficiency of the four-leg TOMs at high-temperature gradients.
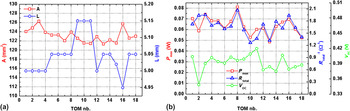
Figure 3(a) shows the geometrical parameters (cross-section and length) of the p- and n-type legs for all 18 modules. The TE area of two p- and two n-type legs (A) varies in the range of 121.3 mm2 < A < 126.3 mm2 and the TE leg length (L) in the range of 4.95 mm < L < 5.15 mm. The variability is a consequence of the production process of the p- and n-type pellets (see “Experimental”). The maximum output powers (P max), inverse total resistances (R total−1), and open-circuit voltages (V OC) for all TOMs are plotted in Fig. 3(b).
(a) Cross-sectional area and length of the p- and n-type thermoelectric legs. (b) Maximum output power (P max), inverse total resistance (R total−1), and open-circuit voltage (V OC) of all TOMs measured by applying heat by means of a heating plate.
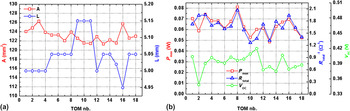
The corresponding temperatures on the hot side (T hot) and the cold side (T cold) of the TOMs were achieved using the heater and the water-cooled Cu block. T hot and T cold varied in the range of 680 K < T hot < 738 K and 338 K < T cold < 388 K, respectively, due to the position inaccuracy of the thermocouples. P max varies in the range of 0.048 W < P max < 0.081 W and V OC in the range of 0.349 V < V OC < 0.420 V. The variation of P max can be associated with the TOM’s total resistances, which vary in the range of 0.48 Ω < R total < 0.79 Ω. Figure 3(b) reveals that the progression of R total−1 and P max coincide. The diversity of the total resistance is mainly due to different contributions of the contact resistances (R cont), which are not negligible in a TOM.Reference Omer and Infield14 The different contact resistances are a consequence of the manufacturing method of the TOMs. In comparison, the material resistances (R mater) originating from small differences in the geometry of the p- and n-type TE legs do only make a minor contribution to the total resistances. R mater can be calculated from the temperature difference across the TE legs and the temperature-dependent electrical resistivity of the p- and n-type TE legs. This parameter is important for the determination of the contact resistance and the device quality [manufacturing quality factor (MQF)] associated with manufacturing defects according to the following equation: MQF = R mater/R total. The thermal contacts were not directly taken into account, but they are one of the parts influencing the MQF. The MQFs of all TOMs are in the range of 0.3 < MQF < 0.6, which is comparable to other published TOMs.Reference Lemonnier, Goupil, Noudem and Guilmeau26 The slight scattering of the open-circuit voltages is most probably due to inconsistencies of the thermal contacts between the Al2O3 plates and the cooler and heater, respectively.
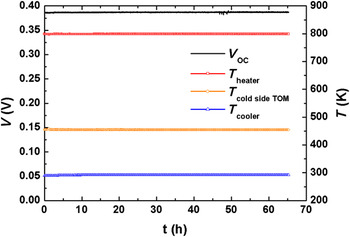
TE module failures are caused by degradation due to either changes in the TE material properties (sublimation of material, oxygen loss, crack formation due to thermal stress) or an increase in the electrical contact resistance, especially at high temperatures, mainly caused by compositional and structural changes in the vicinity of junctions. Therefore, one selected TOM was exposed to a temperature of ∼800 K measured at the heater for 65 h in air (Fig. 4). Relevant module parameters were measured at regular intervals. The maximum temperature gradient across the TOM (ΔT = T heater−T cold sideTOM), where T cold sideTOM is the temperature on the Al2O3 plate on the cold side of the TOM, is a good module stability indicator. In the course of the experiment, an average gradient of ΔT = 344.55 K with a standard deviation of σ = 0.56 K was determined. Other important parameter reflecting the stability of the TE materials is the open-circuit voltage. During the 65-h observation period, the open-circuit voltage was V OC = 0.3870 V with σ = 3.6 10−4 V. Expressed in percent, the standard deviation σ is small, suggesting that the TE materials are degradation-resistant.
Long-term measurement of TOM17 showing the progression of the open-circuit voltage and the temperatures on the heater, the cooler, and the cold (T cold) Al2O3 plates.
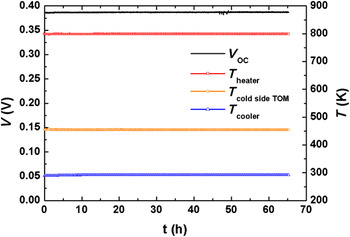
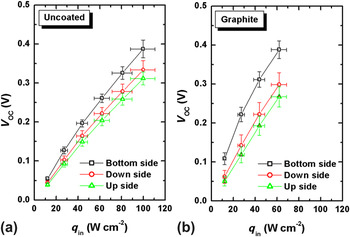
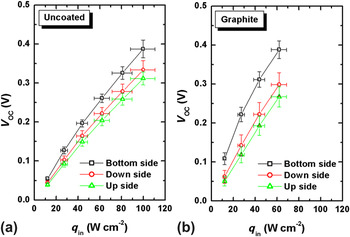
Figure 5 shows the average open-circuit voltages (V OC) of the modules with either uncoated or graphite-coated Al2O3 absorber plates depending on their position in the solar cavity-receiver (bottom, upper side, and lower side). The plots reveal the highest V OC for TOMs at the receiver bottom irrespective of the surface coating. At an incident heat flux of q in = 62 W·cm−2, open-circuit voltages were V OC = 0.261 V and V OC = 0.388 V for uncoated [Fig. 5(a)] and graphite-coated [Fig. 5(b)] TOMs at the receiver bottom, respectively. The (horizontal) errors of the incoming heat flux are due to inaccurate positioning of the solar cavity-receiver (±2.5 mm), leading to deviations between 10.8% ± 11.8%. The (vertical) errors of the open-circuit voltage are due to the averaging the measurement results of several TOMs and experiments. To obtain the same open-circuit voltage at the bottom with the uncoated compared to the graphite-coated TOM, an incident heat flux of q in = 99.8 W·cm−2 has to be applied. Both uncoated and graphite-coated TOMs located at the upper or lower sides of the receiver had lower open-circuit voltages.
Average open-circuit voltages (V OC) of (a) uncoated and (b) graphite-coated TOMs, in dependence of their position in the solar cavity-receiver (bottom, lower side, and upper side).
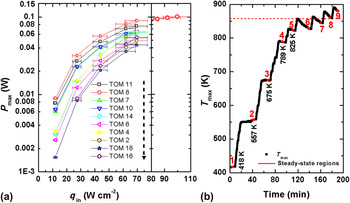
Maximum output powers (P max) of 10 graphite-coated TOMs are plotted in Fig. 6(a), and the maximum temperature T max (recorded at TOM11) against time is shown in Fig. 6(b). The red numbered labels in Fig. 6(b) indicate the steady-state regions of the maximal temperature T max, specified below. In the steady-state regions, T max [shown in Fig. 6(b)] and V OC were evaluated and P max was calculated. As expected, P max decreases in the order: receiver bottom (TOM8, TOM11, TOM7, and TOM10) > lower side wall (TOM14, TOM4, and TOM6) > upper side wall (TOM2, TOM18, and TOM16), which is indicated by the arrow in Fig. 6(a).
(a) Maximum output power (P max) of 10 individually measured graphite-coated TOMs. (b) Temperature (T max) recorded on the hot side of TOM11; the red numbered labels indicate the steady-state regions of T max.
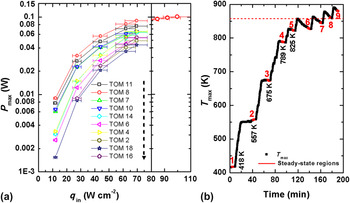
However, this pattern changes for the graphite-coated TOMs at an incident heat flux of q in >70 W·cm−2 and a maximum temperature of T max >858 K (recorded at TOM11) because of partial decomposition of the graphite layer (red dashed line). This process of the partial decomposition of the graphite layer starts at the TOMs at the receiver bottom (TOM8, TOM11, TOM7, and TOM10), resulting in a “saturation” of P max, as it is shown for TOM8 in Fig. 6(a). The possible solutions of the decomposition of the graphite layer could be the sealing of the solar cavity-receiver or exchanging the absorber layer by another material with similar thermal conductivity as Al2O3 and comparable emissivity as graphite. Nevertheless, the highest P max = 0.1 W was recorded for the module TOM8 at q in = 99.8 W·cm−2.
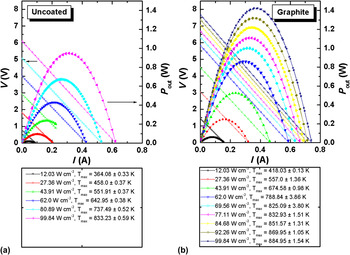
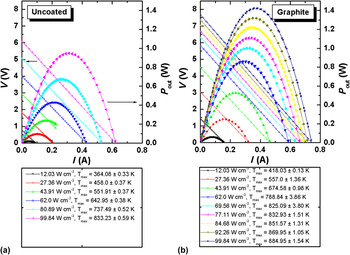
Output power and current–voltage curves for uncoated and coated TOMs connected in series are plotted in Fig. 7. The maximum temperature T max is stated below the graphs. The maximum generated voltage for uncoated and coated TOMs is 6.0 V at T max = 833 K and 7.7 V at T max = 885 K, respectively.
Output power and voltage (V) versus current (A) at different heat fluxes of (a) graphite-coated and (b) uncoated TOMs. T max is specified in all cases.
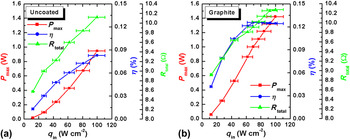
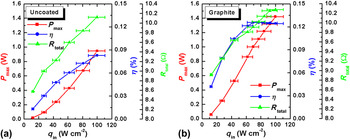
The maximum output power and total resistance of the TOMs were determined from the output power/voltage/current characteristics in Fig. 7. The conversion efficiency was calculated according to η = P max/(q in∙S CPC), where S CPC is the entry surface of the CPC. The maximum output power, the total resistance, and the conversion efficiency of coated and uncoated TOMs are plotted in Fig. 8. The maximum output power of P max ∼1.42 W was achieved for the coated TOMs connected in series [Fig. 8(b)]. The total resistance R total was slightly higher for coated TOMs than for uncoated TOMs because of a higher T max (Fig. 7) and increases with increasing heat flux from R total = 8.48 Ω and R total = 8.91 Ω at q in = 12.03 W·cm−2 to R total = 9.77 Ω and R total = 10.0 Ω at q in = 99.8 W·cm−2 for uncoated and coated TOMs, respectively. This is mainly attributed to an increase in the contact resistance R cont and in the material resistance of the TE legs due to the metallic properties, as previously shown.Reference Tomeš, Suter, Trottmann, Aguirre, Haueter, Steinfeld and Weidenkaff15 The conversion efficiency of the graphite-coated TOMs was already saturated at q in = 77.11 W·cm−2 and T max >858 K. The conversion efficiency increases with increasing heat fluxes up to η ∼0.08% and η ∼0.13% at q in = 99.8 W·cm−2 for uncoated and graphite-coated TOMs, respectively. By comparison, in a previous experiment, a single graphite-coated TOM subjected to direct concentrated irradiation only had a maximum conversion efficiency of η ∼0.08%.Reference Tomeš, Suter, Trottmann, Aguirre, Haueter, Steinfeld and Weidenkaff15 This implies an efficiency improvement of ∼62%.
Maximum output power (P max), total resistance (R total), and conversion efficiency (η) of (a) uncoated and (b) graphite-coated TOMs electrically connected in series.
IV. CONCLUSIONS
A series of TOMs with 0.3 < MQF < 0.6, containing La1.98Sr0.02CuO4 as p-type and CaMn0.98Nb0.02O3 as n-type TE material, were successfully fabricated and used to convert concentrated solar radiation into electrical energy by using concentrated thermal radiation as energy source. The TE materials were chosen based on best compatibility factors and not on TE activity. In a long-term measurement (65 h) of one selected TOM, performance stability at high temperatures was proven. A solar cavity-receiver packed with an array of TOMs was constructed to efficiently capture concentrated solar radiation and to reduce losses due to reradiation. Open-circuit voltage V OC and maximum output power P max of each TOM was measured individually showing the highest V OC and P max for TOMs located at the bottom of the cavity. Due to the higher absorptivity of graphite, V OC and P max were expected to be higher for coated than for uncoated TOMs at the same incoming solar power q in, which was confirmed by the measurements. The maximum generated voltage for coated TOMs connected in series was V OC = 7.7 V at T max = 885 K. The total resistance increased with increasing heat flux mainly due to an increase in the contact resistance R cont and in the material resistance of the TE legs arising from the material’s metallic nature. A maximum output power of P max ∼1.42 W and a solar-to-electricity conversion efficiency of η ∼0.13% was achieved for the coated TOMs, which is an improvement of ∼62% compared to a single graphite-coated TOM subjected to direct solar irradiation.
ACKNOWLEDGMENTS
We thank the Swiss Federal Office of Energy and Swiss National Foundation for financial support and O. Brunko, D. Alfarug, and U. Gfeller for their help with the synthesis.