1. Introduction
Heat transfer is vital in numerous engineering applications, significantly impacting energy efficiency, environmental conservation and technological innovation (Kharangate, Mudawar Reference Kharangate and Mudawar2017; Carey Reference Carey2020). Among various heat transfer mechanisms, phase change processes are particularly critical due to the latent heat release, which is substantially larger than the sensible heat involved in single-phase heat transfer (Perrot Reference Perrot1998). Phase change phenomena encompass both boiling and condensation, each with its unique characteristics and applications (Panzarella Reference Panzarella, Davis and Bankoff2000; Baltis & Geld Reference Baltis and Geld van der2015; Aursand Reference Aursand, Davis and Ytrehust2018; Ling Reference Ling, Fuster, Tryggvason and Zaleski2019; Bures & Sato 2021, 2022; Sinha Reference Sinha, Narayan and Srivastava2021; Singh & Premachandran Reference Singh and Premachandran2021). Condensation, a key phase change mechanism, occurs when vapour is cooled below the saturation temperature, which results in a transition to the liquid state (Crosser Reference Crosser1955; Rohsenow Reference Rohsenow1956; Tanasawa Reference Tanasawa1991). This process involves the release of latent heat, which is significantly greater than the sensible heat associated with single-phase cooling (Tandon Reference Tandon, Varma and Gupta1995; Dobson Reference Dobson and Chato1998). The efficiency of condensation directly impacts the performance of various thermal management systems, with implications for a wide range of technologies from power generation to electronics thermal cooling (Cavallini 2001; Cavallini 2006).
As for power generation, the importance of condensation processes cannot be overstated. The efficiency of steam turbine units is largely contingent on condenser performance (Pattanayak Reference Pattanayak, Padhi and Kodamasingh2019). More effective condensation can reduce turbine back pressure, thereby enhancing power generation efficiency. Due to the growing global energy demands, even marginal improvements in condensation efficiency can yield substantial energy savings and emissions reductions. The refrigeration and air conditioning industry is similarly highly dependent on condensation processes. In vapour compression cycles, condensation efficiency directly influences the system’s overall coefficient of performance. Enhancing condensation efficiency not only reduces energy consumption but also minimises refrigerant usage, thereby mitigating environmental impact. In the chemical processing industry, condensation is central to separation processes, product recovery and reaction heat management. For instance, in distillation processes, effective condensation is crucial for obtaining high-purity products. Optimisation of condensation in these processes can significantly improve product quality, reduce energy consumption and enhance overall process economics (Wang Reference Wang, Xu, Liu, Yang and Chen2021).
In modern thermal management solutions, heat pipes (McGlen Reference McGlen, Jachuck and Lin2004; Zhang Reference Zhang, Watson and Wong2007; Vasiliev Reference Vasiliev2008; He Reference He, Tian, Jiang and He2021) and vapour chambers (Patankar Reference Patankar, Weibel and Garimella2020; Ji Reference Ji, Qin, Liu, Jin, Yang and Meng2024) exemplify the utilisation of condensation principles. These devices achieve efficient heat transfer through evaporation--condensation cycles, finding widespread application in electronic cooling, aerospace and energy systems. Heat pipes can transfer substantial quantities of heat with minimal temperature gradients, while vapour chambers provide larger heat dissipation areas, particularly suitable for high power density scenarios. The efficacy of both technologies is greatly dependent on the efficiency of their internal condensation processes. Moreover, emerging immersion cooling technology also involves liquid condensation (Birbarah Reference Birbarah, Gebrael, Foulkes, Stillwell, Moore, Pilawa-Podgurski and Miljkovic2020). In this approach, electronic components are directly immersed in a low-boiling-point medium, offering exceptionally high cooling efficiency through phase change. Condensation plays a dual role here: directly cooling components and maintaining system operation through the condensation cycle. This technology shows immense potential in data centres and high-performance computing domains, which promises significant reductions in energy consumption and increased computational density.
The phenomenon of condensate film instability in compact thermosyphon condensers was investigated by Teng (Reference Teng, Cheng and Zhao1999) through an integro-differential analysis. They revealed a dual mechanism where surface tension controls instability under low vapour flow conditions, while hydrodynamic effects become dominant at higher velocities. Their work introduced a framework explaining how Rayleigh and Laplace instabilities contribute to capillary blocking, which can lead to film discontinuity and bridge formation. These effects may induce liquid accumulation at condenser endpoints, potentially compromising heat transfer efficiency in both compact thermosyphons and wickless micro heat pipes. Yan (Reference Yan and Lin1999) conducted experiments examining heat transfer characteristics and pressure losses during R-134a condensation in a 2.0 mm channel. It is found that heat transfer performance improves with increasing vapour quality and mass flux but shows an inverse relationship with both saturation temperature and heat flux. Similar trends were observed for pressure drop behaviour. Their work demonstrated enhanced heat transfer efficiency in smaller channels, with approximately 10
 $\%$
better performance compared with conventional sizes. Based on their experimental results, they developed new mathematical relationships for predicting heat transfer coefficients (HTCs) and friction factors.
Two-phase flow dynamics in thermosyphons were numerically investigated using volume-of-fluid (VOF) methodology by Fadhl and colleagues. Their computational approach successfully modelled both evaporator pool boiling and condenser film formation, showing strong correlation with experimental measurements. It is indicated that enhanced thermal performance when operating above 172 W input power (Fadhl, Wrobel & Jouhara Reference Fadhl, Wrobel and Jouhara2013, Reference Fadhl, Wrobel and Jouhara2015). Zhang (Reference Zhang, Li, Liu and Tian2018) investigated flow condensation in a pump-assisted separate heat pipe (PASHP) using R134a through experiments and numerical simulations. It is claimed that the Müller–Steinhagen–Heck and Chen models best predicted pressure drop and heat transfer, respectively. For simulations, they used the shear-stress transport
 $k-\omega$
turbulence model, VOF multiphase model and Lee heat transfer model. The flow was primarily annular, with the pressure drop and HTC increasing with mass flow and vapour quality. Simulations showed good agreement with correlations, validating the approach for studying PASHP condensation characteristics. Min (Reference Min, Zhong, Zhang, Cao and Yuan2023) investigated the condensation mass transfer time relaxation parameter (
 $r_c$
) used in Computational Fluid Dynamics (CFD) simulations of two-phase closed thermosyphons. Through experiments and numerical modelling, they quantitatively analyse the relationship between condensation mass transfer time relaxation parameter (
 $r_c$
) and key thermosyphon parameters. An empirical equation is developed relating
 $r_c$
to fluid properties, filling ratio and saturation temperature. The filling ratio shows the strongest influence on relaxation parameter, while vapour density has a minimal effect. This work provides a method to determine appropriate
 $r_c$
values for thermosyphon numerical simulations, enhancing the modelling accuracy of two-phase heat and mass transfer in these systems. Bai (Reference Bai, Chen, Li, Rao and Chyu2023) presents an improved mass transfer model for simulating film condensation heat transfer. The model introduces a controllable parameter of interfacial temperature difference, resolving weaknesses in the commonly used Lee model. Validated against theoretical, empirical and experimental data, the model shows good agreement within 6
 $\%$
deviation. The study investigates condensation characteristics under various conditions, including plate inclination, microgravity and vapour flow. The model captures interfacial behaviour accurately and provides insights into overall condensation heat transfer, offering a practical approach for determining phase change parameters. Cheng (Reference Cheng, Wang, Sun, Ji, Wang, Chen, Xu and Chen2023) employs the renormalisation group (RNG)
 $k-\varepsilon$
numerical model to examine R134a condensation heat transfer in smooth pipes at high vapour velocities (20–100 m s−1) and various inclination angles. The research reveals that liquid film thickness decreases significantly with increasing vapour velocity up to 60 m s−1. The HTC rises rapidly until 60 m s−1, then slows. Notably, pipe inclination minimally affects HTC at velocities above 60 m s−1. The authors propose a modified empirical correlation for HTC calculation at high vapour velocities exceeding 80 m s−1. This work offers valuable insights into condensation behaviour at high vapour velocities for heat pipe applications.
Recent advancements in surface engineering and nanotechnology have opened new avenues for enhancing condensation heat transfer (Gokhale Reference Gokhale, Plawsky and Wayner2003; Kubiak Reference Kubiak, Wilson, Mathia and Carval2011; Ben-Naim Reference Ben-Naim2012; Zeynali Reference Zeynali, Abolfazli and Vafai2017; Si Reference Si, Dong and Jiang2018; Kalantarpour & Vafai Reference Kalantarpour and Vafai2023; Tang et al. Reference Tang, Sun, Li and Vafai2024). Ji (Reference Ji, Qin, Liu, Jin, Yang and Meng2024) reveals that surface wettability significantly influences phase change processes in vapour chambers, with hydrophilic boiling surfaces (CA
 $=23.9^\circ$
) enhancing critical heat flux (CHF) by 92.57 % at high heat fluxes compared with neutral surfaces (CA
 $=89.0^\circ$
), while hydrophobic boiling surfaces (CA
 $=115.5^\circ$
) improve boiling heat transfer coefficient by 260.34 % at low heat fluxes. These findings demonstrate that optimal thermal performance in vapour chambers can be achieved through strategic surface modification, though careful consideration must be given to operating heat flux ranges to prevent burnout on hydrophobic surfaces. The development of superhydrophobic surfaces holds promise for more efficient dropwise condensation, potentially revolutionising multiple fields. However, the practical application of these innovative technologies still faces numerous challenges, including long-term stability and scalability issues. The study of condensation heat transfer is a multidisciplinary field, intersecting fluid mechanics, materials science and thermodynamics.
While previous studies have made significant contributions to understanding condensation heat transfer, several critical gaps remain unaddressed. First, existing research primarily focuses on either low-to-medium vapour velocities (typically below 20 m s−1) or single surface conditions, leaving the combined effects of high vapour velocities (20–100 m s−1) and varying surface wettability largely unexplored. Second, current numerical models often struggle to accurately predict condensation behaviour under these extreme conditions, with deviations exceeding 15 % from experimental data. This study offers three key innovations: (i) a comprehensive investigation of the synergistic effects between vapour velocity and surface wettability, specifically examining contact angles ranging from 5
 $^\circ$
to 175
 $^\circ$
under high-velocity conditions; (ii) development of an enhanced VOF-based numerical framework that incorporates improved interface mass transfer models, aiming to achieve better prediction accuracy for high-velocity condensation phenomena; and (iii) establishment of quantitative correlations for HTCs across the full spectrum of operating conditions, valid for Reynolds numbers ranging from laminar to turbulence. Additionally, our work addresses the practical limitations of existing models by providing specific guidance for optimal surface modification strategies under different operating conditions, with the goal of achieving a minimum 30 % enhancement in condensation heat transfer efficiency compared with conventional designs. These advances fill critical knowledge gaps in high-performance condenser design and provide practical guidelines for next-generation thermal management solutions.
By employing advanced numerical methods, including the VOF approach for liquid--vapour phase change studies (Hsu Reference Hsu, Lin, Popovic, Lin and Patankar2017; Lin Reference Lin, Lin, Hung, Lin and Hsu2021, Reference Lin, Lin, Kumar, Lin, Hsu and Hung2022a ,Reference Lin, Lin, Kumar, Lin and Hsu b ; Hsu Reference Hsu, Lin, Chen, Wang, Li, Pai and Lin2023, Reference Hsu, Kumar and Lin2024), this study presents a comprehensive numerical investigation into the effects of contact angle and inflow vapour velocity on condensation heat transfer in horizontal tubes. Using CFD modelling, we explore a wide range of inflow vapour velocities and contact angles from superhydrophilic to superhydrophobic conditions, with R134a as the working fluid. The selection of R134a is particularly relevant due to its widespread application in refrigeration and air conditioning systems, while the high-velocity conditions investigated are especially pertinent to modern compact heat exchangers where high mass fluxes are employed to achieve enhanced heat transfer rates. This numerical approach enables the simulation and analysis of conditions that may be challenging to achieve in experimental set-ups, providing valuable insights into the fundamental mechanisms governing condensation heat transfer. The investigation has important implications for future heat exchanger design and optimisation in various industrial applications.
The present work is structured as follows. Following this introduction in § 1, the numerical methodology is described in § 2, which encompasses the governing equations, boundary conditions and solution procedures. Subsequently, the problem formulation is delineated and the numerical model is validated in § 3. The results of the parametric study are then presented and discussed in § 4, with particular emphasis on the influence of geometric parameters on single bubble boiling. The paper concludes with a summary of the principal findings and their implications in § 5.
2. Methodology
The liquid--vapour phase transition phenomena has catalysed the development of diverse numerical methodologies, which possess their own unique strengths and limitations. These computational approaches span an extensive spectrum of scales and techniques that extend from atomic-level simulations to macroscopic continuum methods. At the microscopic scale, molecular dynamics (MD) simulations (Wei Reference Wei, Wang, Chen and Chen2024) provide invaluable insights into phase change processes at the atomic level. The lattice Boltzmann method (LBM) (Guo Reference Guo, Shi and Wang2000; Gong Reference Gong and Cheng2015) serves as a crucial link between microscopic and macroscopic scales, which offers a mesoscopic approach to fluid dynamics. For scenarios involving intricate interfacial dynamics, the phase field model (Jafari Reference Jafari and Okutucu-Özyurt2016) has demonstrated remarkable efficacy in capturing the evolution of phase boundaries. Among these diverse approaches, continuum methods ( Lorstad Reference Lörstad and Fuchs2004) distinguish themselves through their adaptability and computational efficiency, particularly when addressing large-scale problems. In contrast to LBM and MD techniques, continuum models exhibit compatibility with a wide array of grid structures and can effectively simulate phase change phenomena at scales pertinent to numerous engineering applications.
Within the domain of continuum approaches (Hsu 2010), researchers have devised several methodologies to tackle multiphase challenges. The VOF method (Lorstad Reference Lörstad and Fuchs2004), pioneered by Hirt (Reference Hirt and Nichols1981), excels in delineating sharp interfaces between phases. The immersed boundary method (Lorstad Reference Lörstad and Fuchs2004) offers a versatile framework for modelling complex geometries and dynamic boundaries. Furthermore, the level set method (Osher Reference Osher and Sethian1988; Bures & Sato Reference Bures and Sato2021; Singh & Premachandran Reference Singh and Premachandran2021; Bures & Sato Reference Bures and Sato2022) provides a robust platform for tracking evolving interfaces. Among these techniques, the VOF method has garnered significant attention in the realm of liquid--vapour flow simulations. Its capacity to model liquid--vapour interfaces and bubble dynamics with both qualitative and quantitative accuracy, which combines with its reasonable computational demands, renders it an appealing choice for researchers and engineers investigating phase change phenomena. By harnessing these sophisticated numerical tools, it is able to unlock a deeper understanding of the intricate physics underlying liquid--vapour phase transitions. Given these advantages, the VOF method is adopted as the primary numerical tool for investigating the condensation phenomena in this study.
2.1. Governing equations and VOF method
This section presents the fundamental equations that govern heat and mass transfer in this numerical study. The VOF approach employs volume fractions to represent distinct fluid phases within each computational cell. In the VOF model we denote the volume fraction of the
 $q$
th fluid as
 $\alpha _q$
. For a two-phase system comprising liquid and vapour, the sum of their respective volume fractions must equal unity, i.e.
 \begin{equation} \alpha _l + \alpha _v = 1, \end{equation}
where subscripts
 $l$
and
 $v$
indicate liquid and vapour phases, respectively. To ensure mass conservation, we apply transport equations for both phases:
 \begin{equation} \left \lbrace \begin{array}{ll} \displaystyle \frac {\partial }{\partial t}(\alpha _v\rho _v) + \nabla \cdot (\mathbf{u}\alpha _v\rho _v) = \dot {m}_{lv},\\ \displaystyle \frac {\partial }{\partial t}(\alpha _l\rho _l) + \nabla \cdot (\mathbf{u}\alpha _l\rho _l) = -\dot {m}_{lv}. \end{array} \right . \end{equation}
Here,
 $\dot {m}_{lv}$
represents the mass transfer rate from liquid to vapour,
 $t$
denotes time and
 $\mathbf{u}$
is the fluid velocity vector. For momentum and energy conservation, we utilise a one-fluid model, treating the fluid as a homogeneous mixture. The momentum conservation equation is expressed as
 \begin{equation} \displaystyle \frac {\partial }{\partial t}(\rho \mathbf{u}) + \nabla \cdot (\rho \mathbf{u}\mathbf{u}) = -\nabla p + \nabla \cdot (\mu \nabla \mathbf{u}) + \rho \mathbf{g} + \mathbf{F}, \end{equation}
where
 $p$
represents pressure,
 $\mathbf{g}$
denotes gravitational acceleration and
 $\mathbf{F}$
accounts for external forces. The properties of the fluid mixture, including density
 $\rho$
, dynamic viscosity
 $\mu$
, specific heat capacity
 $C_p$
and thermal conductivity
 $k$
, are calculated as weighted averages of the individual phase properties:
 \begin{equation} \left \lbrace \begin{array}{llll} \displaystyle \rho = \rho _l\alpha _l + \rho _v\alpha _v, \\ \displaystyle \mu = \mu _l\alpha _l + \mu _v\alpha _v,\\ \displaystyle C_p = C_{pl}\alpha _l + C_{pv}\alpha _v, \\ \displaystyle k = k_l\alpha _l + k_v\alpha _v. \end{array} \right . \end{equation}
The energy conservation equation, based on temperature, is given by
 \begin{equation} \displaystyle \frac {\partial }{\partial t}(\rho C_p T) + \nabla \cdot (\rho \mathbf{u} C_p T) = \nabla \cdot (k\nabla T) + S_h, \end{equation}
where
 $T$
is temperature and
 $S_h$
represents heat sources or sinks. To account for surface tension effects, we implement the continuum surface force model introduced by Brackbill (Reference Brackbill, Kothe and Zemach1992). This model relates the pressure drop across the interface to the surface tension coefficient and interface curvature, i.e.
 \begin{equation} \displaystyle p_2 - p_1 = \sigma \left (\frac {1}{R_1} + \frac {1}{R_2}\right ), \end{equation}
where
 $p_2 - p_1$
is the interfacial pressure drop,
 $\sigma$
is the surface tension coefficient and
 $R_1$
and
 $R_2$
are the principal radii of curvature. The surface tension force is incorporated into the momentum equation as an external force term
 $\mathbf{F}$
:
 \begin{equation} \displaystyle \mathbf{F} = \sigma \frac {\alpha _l\rho _l \kappa _l\nabla \alpha _l + \alpha _l\rho _v \kappa _v\nabla \alpha _v}{\frac {1}{2}(\rho _l + \rho _v)}. \end{equation}
The interface curvature
 $\kappa$
is calculated as
 \begin{equation} \displaystyle \kappa _l = -\kappa _v = -\nabla \cdot \left (\frac {\nabla \alpha _l}{|\nabla \alpha _l|}\right ). \end{equation}
This comprehensive set of equations forms the foundation of our numerical model, enabling accurate simulation of two-phase flow dynamics and associated heat transfer phenomena. By leveraging these equations within the VOF framework, the complex interactions between liquid and vapour phases can be captured effectively, including interface dynamics and phase transitions.
2.2. Turbulence model
To investigate the condensation problem in this study, the RNG
 $k-\varepsilon$
turbulence model is employed (Cheng Reference Cheng, Wang, Sun, Ji, Wang, Chen, Xu and Chen2023), which is a variant of the standard
 $k-\varepsilon$
model (Yakhot Reference Yakhot, Orszag, Thangam, Gatski and Speziale1992). The RNG
 $k-\varepsilon$
model can accurately predict flow characteristics in environments with complex shear flows, compression effects and vortices, particularly near boundaries where Reynolds number effects are significant.
The RNG
 $k-\varepsilon$
model is governed by two key transport equations: one for the turbulent kinetic energy
 $k$
and another for its dissipation rate
 $\varepsilon$
. These equations are expressed as follows:
 \begin{align} \frac {\partial (\rho _f k)}{\partial t} + \nabla \cdot (\rho _f \mathbf{u} k) &= \nabla \cdot \left [\left (\mu _{t,f} + \frac {\mu _f}{\sigma _k}\right ) \nabla k\right ] \notag\\ &\quad + \left [\mu _{t,f}(\nabla \mathbf{u} + (\nabla \mathbf{u})^T) : \nabla \cdot \mathbf{u}\right ] - \rho _f \varepsilon + G_b, \end{align}
 \begin{align} \frac {\partial (\rho _f \varepsilon )}{\partial t} + \nabla \cdot (\rho _f \mathbf{u}\varepsilon ) &= \nabla \cdot \left [\left (\mu _{t,f} + \frac {\mu _f}{\sigma _\varepsilon }\right ) \nabla \varepsilon \right ] \notag\\ &\quad + \frac {\varepsilon }{k}\left [C_{1\varepsilon }\mu _{t,f}(\nabla \mathbf{u} + (\nabla \mathbf{u})^T) : \nabla \cdot \mathbf{u} - C_{2\varepsilon }\rho _f \varepsilon \right ] \notag\\ &\quad + C_{1\varepsilon }C_{3\varepsilon }\frac {\varepsilon }{k}G_b. \end{align}
In these equations,
 $\rho _f$
represents the fluid density,
 $\mathbf{u}$
is the velocity vector,
 $\mu _f$
is the fluid’s dynamic viscosity and
 $G_b$
accounts for the generation of turbulence due to buoyancy. The turbulent viscosity
 $\mu _{t,f}$
, a critical parameter in the model, is calculated using
 \begin{equation} \mu _{t,f} = C_\mu \rho _f \frac {k^2}{\varepsilon } .\end{equation}
The model constants used in our CFD numerical simulations are presented in table 1. These parameters have been carefully selected to ensure accurate representation of the turbulent flow characteristics in our condensation study.
RNG
 $k-\varepsilon$
model parameters Cheng (Reference Cheng, Wang, Sun, Ji, Wang, Chen, Xu and Chen2023).

2.3. Phase change model
In the domain of two-phase flow simulations, the accurate representation of mass and energy exchange at the interface remains paramount for phase change phenomena modelling. Contemporary numerical methodologies have yielded various formulations, each exhibiting distinct characteristics and constraints. The energy jump model proposed by Gibou (Reference Gibou, Chen, Nguyen and Banerjee2007) emphasises the temperature discontinuity at the interface, establishing a mathematical framework for handling discontinuous thermal properties. The Schrage model (Schrage 1952) employs kinetic theory principles, which analyses molecular transport mechanisms across the liquid--vapour boundary. This formulation demonstrates particular efficacy in addressing non-equilibrium interfacial conditions. Furthermore, Lee’s model (Lee Reference Lee and Veziroglu1980) presents a mathematically rigorous methodology for characterising mass and energy transfer during phase transitions. Its mathematical consistency and computational efficiency have led to its extensive implementation in numerical phase change dynamics applications.
For this investigation, we have opted to implement Lee’s model due to its established reputation for accurately capturing the dynamics of two-phase systems. The foundation of this model rests on the concept of temperature-driven phase change, with the saturation temperature serving as a critical threshold. According to Lee’s formulation, the evaporation process commences when the local temperature at the interface surpasses the saturation temperature (
 $T_{{sat}}$
). This temperature differential acts as the primary driving force for mass transfer between the liquid and vapour phases. The mass transfer rate is governed by the equations
 \begin{align} &\,\,\dot {m}_{lv}=-\dot {m}_{vl}=\gamma _l\alpha _l\rho _l\frac {T-T_{{sat}}}{T_{{sat}}} ( T \gt T_{{sat}}, \text{evaporation}), \end{align}
 \begin{align} & \dot {m}_{vl}=-\dot {m}_{lv}=\gamma _v\alpha _v\rho _v\frac {T-T_{{sat}}}{T_{{sat}}} (T\lt T_{{sat}}, \text{condensation}), \end{align}
where
 $\gamma _l$
and
 $\gamma _v$
are the relaxation times for liquid and vapour phases mass transfer, respectively. Both
 $\gamma _l$
and
 $\gamma _v$
are chosen as the initial default values of 0.1
 $s^{-1}$
. The heat flux due to phase change at control volume
 $V_c$
can be calculated by
 \begin{equation} \displaystyle Q=\dot {m}_{lv}h_{lv}V_c=-\dot {m}_{vl}h_{lv}V_c, \end{equation}
where
 $h_{lv}$
is the latent heat. The heat source in the energy equation can then be calculated as
 \begin{equation} \displaystyle S_h=\frac {Q}{V_c}. \end{equation}
Lee’s model addresses both evaporation and condensation within a unified framework, seamlessly integrating with our conservation equations to capture the complexities of phase change. Its compatibility with the VOF method creates a powerful tool for simulating multiphase flows with phase transitions, allowing precise tracking of the liquid--vapour interface and accounting for mass and energy exchange.
3. Problem formulation
The primary goal of this investigation is to analyse how the contact effect and inflow vapour velocity influence condensation heat transfer performance. Our microchannel configuration extends from the foundational work presented in Cheng (Reference Cheng, Wang, Sun, Ji, Wang, Chen, Xu and Chen2023). Within this section, we detail the methodological components of our study, encompassing the fluid properties, microchannel geometric parameters, boundary conditions and our analytical approach.
3.1. Computational domain and boundary conditions
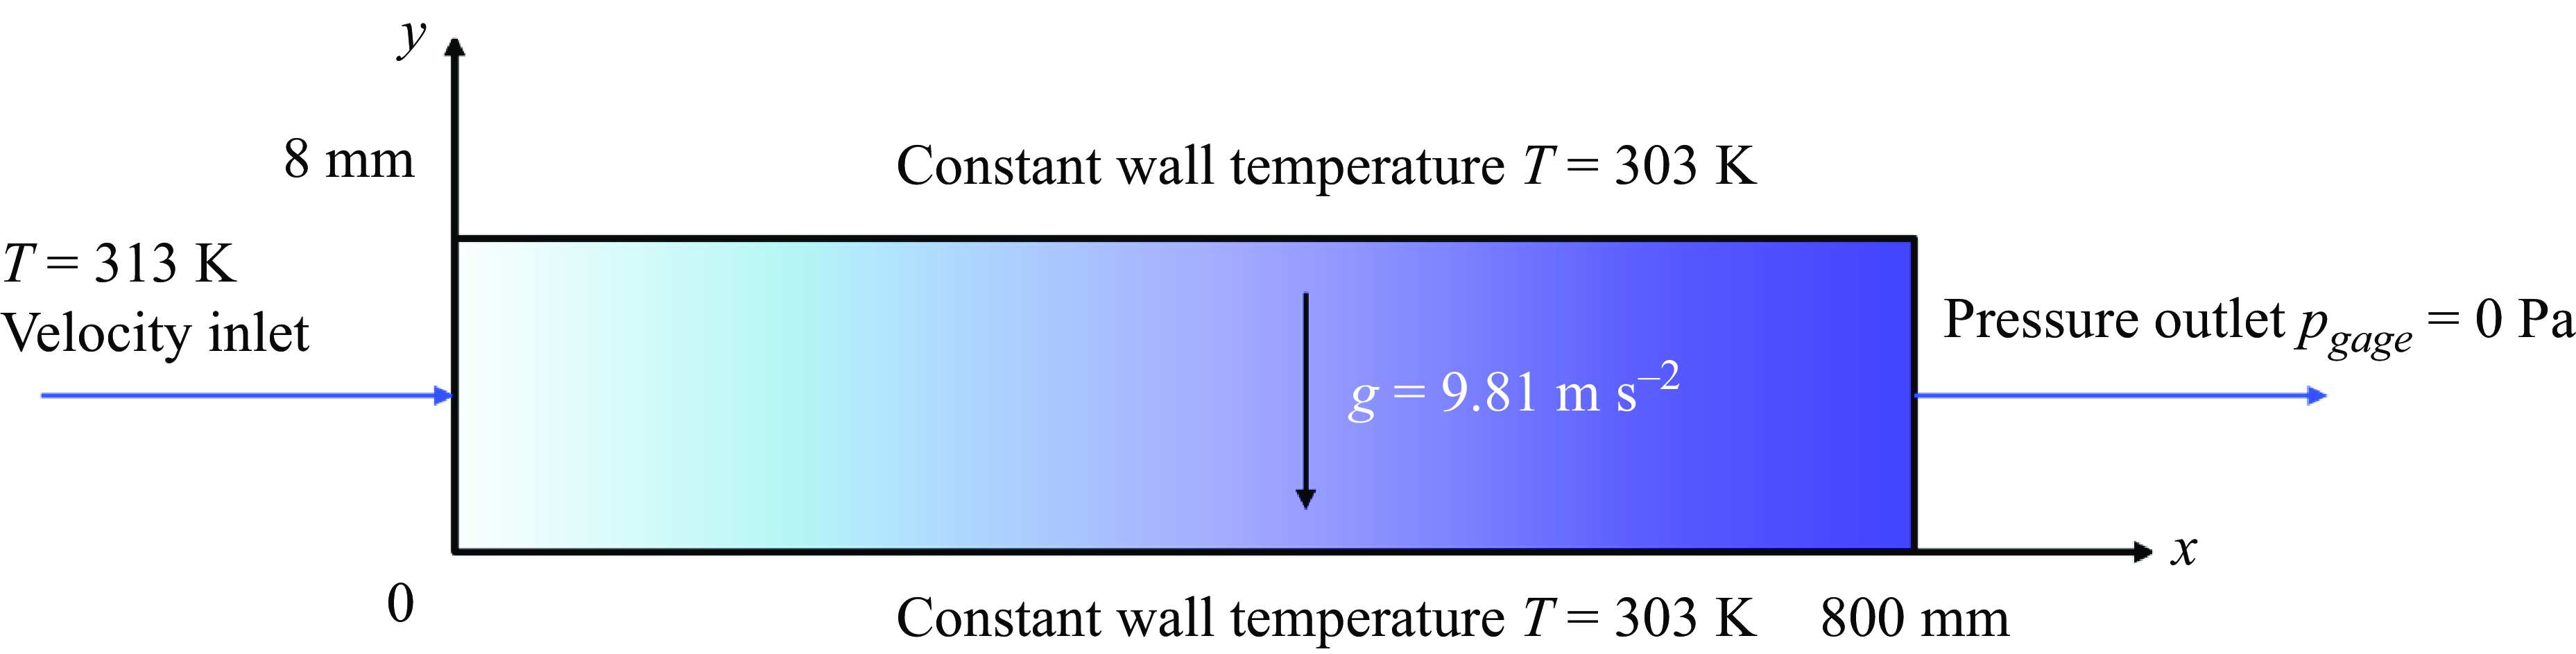
The computational domain is modelled as a two-dimensional configuration with dimensions of 800 mm in length and 8 mm in diameter, as shown in figure 1. The flow channel within the pipe maintains a constant diameter throughout its length. The computational domain has a velocity inlet boundary condition prescribed at the left boundary. To facilitate comparative analysis, inlet velocities of vapour flow were set at 0.1, 10, 20, 40 and 80 m s−1. The outlet pressure was maintained at (
 $p_{\textit{gage}}=0$
Pa), which is imposed at the right boundary, and gravity was defined as −9.80665 m s−
 $^2$
along the
 $y$
axis. The top and bottom walls are treated as stationary solid walls with a no-slip condition. In this study, the surface contact angle of both the upper and lower tube walls was systematically varied to investigate its impact on condensation heat transfer and surface droplet formation. The contact angles examined were
 $\theta = 0$
 $^{\circ }$
, 5
 $^{\circ }$
, 10
 $^{\circ }$
, 15
 $^{\circ }$
, 30
 $^{\circ }$
, 45
 $^{\circ }$
, 60
 $^{\circ }$
, 90
 $^{\circ }$
, 120
 $^{\circ }$
, 135
 $^{\circ }$
, 150
 $^{\circ }$
, 165
 $^{\circ }$
, 170
 $^{\circ }$
and 175
 $^{\circ }$
. The working fluid, R134a, was maintained at a saturation temperature of 313K at both the inlet and outlet, while the temperature of the upper and lower tube walls was kept constant at 303K.
Schematic of the horizontal microchannel geometry and boundary conditions.

3.2. Fluid properties and physical parameters
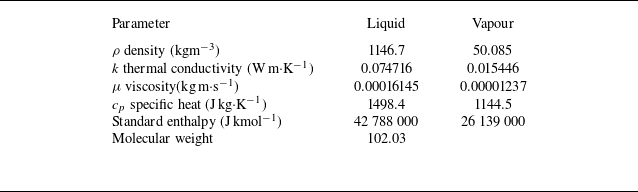
The working fluid employed in this simulation study was R134a (1,1,1,2-tetrafluoroethane, also known as tetrafluoroethane). The thermophysical properties of R134a in both gas and liquid phases at the saturation temperature of
 $T_{{sat}}=$
313K are listed in table 2, with the reduced pressure
 $p/p_c=0.25$
, where
 $p_c$
represents the critical pressure.
Fluid properties of R134a at
 $T_{sat}=313$
K (Lavrenchenko Reference Lavrenchenko, Ruvinskij, Iljushenko and Kanaev1992).

The surface tension
 $\sigma _{lv}$
will change with temperature, and its formula is
 \begin{equation} \sigma _{lv}(T) = \sum _{i=0}^{n=3} B_iT^i \left(\frac{{\text{N}}}{{\text{m}}}\right), \end{equation}
where
 $T$
is the temperature in Kelvin and
 $B_i$
are the polynomial coefficients for the working fluid, as shown in table 3.
Polynomial coefficients for the surface tension of the working fluid (Fadhl et al. Reference Fadhl, Wrobel and Jouhara2015).

This study examines the complex interdependence between inlet vapour velocity and contact angle, with a particular focus on condensation heat transfer in fluid systems. A comprehensive theoretical framework is presented, which incorporates inertial forces, surface tension effects, heat transfer and mass transport to model how variations in flow channel geometry can induce or suppress instabilities. Our analysis explores how relevant dimensionless numbers (Froude number (
 $Fr$
), Reynolds number (
 $ {\textit {Re}}$
), Weber number (
 $We$
), Peclet number (Pe), vapour Jakob number (
 $Ja_v$
), Bond number (
 $Bo$
), vapour Prandtl number (Pr
 $_v$
) and Nusselt number (
 $Nu$
)) evolve under different parameters, providing insight into the conditions that may trigger thermal performance.
Parameters investigated in the study and their respective ranges with fixed vapour Prandtl number Pr
 $_v=$
0.917.

The relative importance of buoyancy forces to inertial forces is characterised by the Froude number
 $Fr=u/\sqrt {gD}$
, where
 $u$
is the vapour flow velocity,
 $g$
is the gravitational force and
 $D$
is the characteristic length. The vapour Reynolds number
 $ {\textit {Re}}_v=\rho _vu_vD/\mu _v$
characterises the balance between vapour flow inertial and viscous forces while the Weber number
 $We = \rho u^2D/ \sigma$
represents the ratio of inertial forces to surface tension forces. The Peclet number Pe
 $_v=\rho _vc_{pv}uD/k_v$
represents the ratio of heat transferred by convection to heat transferred by conduction, where
 $k_v$
is the vapour conductivity and
 $c_{pv}$
is the vapour specific heat. The Bond number
 $Bo=(\rho _l-\rho _v)gD^2/\sigma$
measures the importance of gravitational forces compared with surface tension forces. The Jakob number is used in phase change heat transfer calculations and defined as
 $Ja_v=c_{pv}\Delta T/h_{lv}$
. The vapour Prandtl number defined as Pr
 $_v=\mu _vcp_{v}/k_v$
has a constant value of 0.917, which shows that the viscous effects of the fluid are more pronounced relative to its thermal conduction effects. In this study the effect of wall subcooling (
 $\Delta T$
) is fixed, and it can be specified in non-dimensional form through this work as
 $Ja_v/$
Pr
 $_v$
with a constant value of 0.076.
Table 4 summarises the values of the parameters used in these simulations. The system exhibits varying flow regimes and heat transfer characteristics across a wide range of operating conditions, as evidenced by the dimensionless parameters. The Froude numbers (
 $Fr = 0.357-285.71$
) range from gravity-dominated to inertia-dominated flow, indicating a transition from gravity-influenced flow patterns at lower velocities to momentum-driven flow at higher velocities. The vapour Reynolds numbers (
 ${\textit {Re}}_v = 3,239-$
 $2,591,301$
) span from laminar to fully turbulent flow regimes, suggesting significant variations in mixing intensity and boundary layer characteristics across operating conditions. The Weber numbers (
 $We = 0.50-320,544$
) indicate a transition from surface tension-dominated flow at lower velocities to inertia-dominated flow at higher velocities, potentially affecting droplet formation, interface stability and condensation mechanisms. The Peclet numbers (
 ${\textit {Pe}} = 2,968-2,375,130$
) demonstrate that convective heat transfer remains dominant over conductive heat transfer across all conditions, with the intensity varying with flow rate. Additionally, the Bond number (
 $Bo = 85.97$
) being greater than unity indicates that gravitational forces exceed surface tension effects, favouring liquid film formation. This combination of parameters suggests a versatile condensation system capable of operating under various flow conditions, from relatively gentle to highly turbulent regimes, making it suitable for studying heat transfer mechanisms across a broad range of applications.
Nusselt (Reference Nusselt1916) assumed that the condensate film on a cold surface behaves as a laminar flow with the vapour temperature at
 $T_{sat}$
, neglecting the vapour--liquid interfacial shear stress. Due to the extremely thin fluid film, the liquid film’s momentum and energy are considered negligible. With a no-slip boundary condition
 $u(0)=0$
and zero shear stress at the liquid surface
 $\partial u/\partial y=0$
, the velocity distribution within the liquid film can be derived as
 \begin{equation} u(y)=\frac {g(\rho _l-\rho _v)\delta ^2}{\mu _l}\left ( \frac {y}{\delta }-\frac {1}{2}\left(\frac {y}{\delta }\right)^2\right ), \end{equation}
where
 $\delta$
represents the condensate film thickness,
 $g$
is the gravitational acceleration,
 $\rho _l$
and
 $\rho _v$
are the densities of liquid and vapour phases, respectively, and
 $\mu _l$
is the dynamic viscosity of the liquid phase. The condensate mass flow rate per unit width
 $w$
is expressed as
 $G(x)$
:
 \begin{equation} \frac {\dot {m}(x)}{w}=\int _0^{\delta (x)}\rho _lu(y){\rm d}y=\frac {g\rho _l(\rho _l-\rho _v)\delta ^3}{3\mu _l}=G(x). \end{equation}
From the above mass flow rate per unit width, the following equation can be derived:
 \begin{equation} \delta (x)=\left [\frac {4k_l\mu _l(T_{{sat}}-T_s)x}{g\rho _l(\rho _l-\rho _v)h_{lv}}\right ]^{1/4} .\end{equation}
Rohsenow (Reference Rohsenow1956) modified the boundary layer thickness based on heat and mass transfer effects, accounting for potential subcooling between the saturated fluid temperature and wall temperature gradient:
 \begin{equation} h'_{lv}=h_{lv}+0.68C_{pl}(T_{{sat}}-T_s) .\end{equation}
The heat flux at the liquid--vapour interface can be calculated by
 \begin{equation} q_s^*=h_x(T_{{sat}}-T_s) .\end{equation}
By applying Fourier’s law of conduction:
 \begin{equation} h_x=\frac {k_l}{\delta }.\end{equation}
Finally, the heat transfer correlation coefficient can be obtained. Based on the average surface thickness, the average HTC can be derived as
 \begin{equation} \overline {h_L}=0.934\left [\frac {g\rho _l(\rho _l-\rho _v)k_l^3h'_{lv}}{4\mu _l(T_{{sat}}-T_s)L}\right ]^{1/4}. \end{equation}
The Nusselt number can then be obtained as
 \begin{equation} \overline {Nu_L}=\frac {\overline {h_L}L}{k_l}=0.934\left [\frac {g\rho _l(\rho _l-\rho _v)L^3h'_{lv}}{\mu _lk_l(T_{{sat}}-T_s)}\right ]^{1/4}. \end{equation}
The calculation of heat transfer efficiency employed in this research utilises convective heat transfer correlations for internal flows. The fundamental framework builds upon the pioneering work of Dittus–Boeiter, as referenced in Winterton (Reference Winterton1988), incorporating their established single-phase heat transfer principles. This correlation integrates two key dimensionless parameters along with three experimentally determined coefficients. The mathematical representation can be expressed as
 \begin{equation} Nu= \frac {hD}{k} = f_1( {\textit {Re}})f_2({\textit {Pr}}) = C {\textit {Re}}^n{\textit {Pr}}^m. \end{equation}
In this equation, the parameters are defined as follows: the convective HTC (
 $h$
), the characteristic diameter of the tube (
 $D$
) and the fluid’s thermal conductivity (
 $k$
). The dimensionless groups include
 $\textit {Re}$
(Reynolds number) and
 $\textit {Pr}$
(Prandtl number). The exponent
 $m$
varies depending on the thermal process: 0.3 for cooling operations and 0.4 for heating conditions. Based on empirical observations, the coefficient
 $n$
is commonly taken as 0.8, while the proportionality constant
 $C$
is established as 0.023. Additionally,
 $f_1$
and
 $f_2$
represent correction functions that account for the fluid dynamic and thermodynamic effects in heat transfer calculations.
Crosser (Reference Crosser1955) suggested that the flow velocity in the gas–liquid pipeline directly affects heat transfer, mainly influenced by the gas flow velocity and fluid viscosity coefficient. Akers et al. (Reference Akers, Deans and Crosser1959) proposed a calculation formula based on this theory. The calculation domain’s boundary layer thickness and the temperature difference between the gas and liquid phases at the interface will affect the convective HTC. The relationship can be expressed as:
 \begin{equation} Nu = \frac {hD}{k_L} = C {\textit {Re}}_{eq}^n{\textit {Pr}}^m .\end{equation}
The equivalent Reynolds number is crucial in this calculation. Its calculation formula is
 \begin{equation} {\textit {Re}}_{eq} = G\left [(1-x) + x\left (\frac {\rho _l}{\rho _v}\right )^{0.5}\right ]\frac {D}{\mu _l}, \end{equation}
where
 $G$
represents the mass flux,
 $x$
represents the gas quality,
 $\rho _l$
and
 $\rho _v$
represent the densities of liquid and gas phases, respectively. Using this formula for calculation,
 $m$
is adjusted to 1/3,
 $C$
is adjusted to 0.026 and
 $n$
is set to 0.8.
Dobson (Reference Dobson and Chato1998) considered that the flow velocity in the tube would affect the change of Reynolds number. Based on this theory, a dimensionless parameter
 $X_{tt}$
, which represents the flow velocity of the gas in the tube, is set. It can be calculated as
 \begin{equation} X_{tt} = \left (\frac {1-x}{x}\right )^{0.9}\sqrt {\frac {\rho _v}{\rho _l}}\left (\frac {\mu _l}{\mu _v}\right )^{0.1}, \end{equation}
where
 $X_{tt}$
represents the gas flow velocity and
 $x$
is the working fluid quality.
Through experimental investigations of multiple working fluids, Cavallini (Reference Cavallini, Del Col, Doretti, Matkovic, Rossetto, Zilio and Censi2006) refined the understanding of the proportionality constant
 $C$
in convective heat transfer. Their detailed analysis of gas flow effects on heat transfer mechanisms yielded important correlations between flow characteristics and heat transfer performance. Their research identified that while gas flow rate and convective heat transfer demonstrate a strong correlation at moderate velocities, the relationship changes significantly at higher speeds. Specifically, they observed that gas velocities exceeding 80 m s−1 led to reduced cooling efficiency, attributed to insufficient residence time for condensation. Their work culminated in a new correlation that quantifies the relationship between gas velocity and HTCs:
 \begin{equation} Nu = 0.023\mathrm{\textit {Re}}_{eq}^{0.8}{\textit {Pr}}^{0.4}\left (1.5 + \frac {1.75}{X_{tt}^{0.9}}\right ).\end{equation}
The calculations for equivalent Reynolds number (
 ${\textit {Re}}_{eq}$
) and Nusselt number (
 $Nu$
) in this study shown in § 4 are based on the correlations proposed by Crosser (Reference Crosser1955) and later refined by Cavallini (Reference Cavallini, Del Col, Doretti, Matkovic, Rossetto, Zilio and Censi2006), which account for gas--liquid flow characteristics and convective heat transfer mechanisms in two-phase flow conditions.
3.3. Solution method
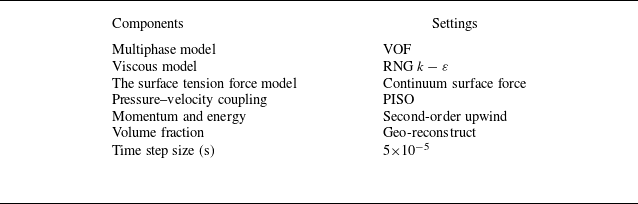
The numerical simulations were conducted using a CFD software package ANSYS (2020) that employs the finite volume method to discretise and solve the governing equations. The simulation parameters are summarised in table 5. A turbulence flow RNG
 $k-\varepsilon$
model was adopted and gravitational effects were incorporated. The VOF method was implemented to track the smooth interface between phases. No-slip boundary conditions were imposed on the coupled walls. The time step size used was 5
 $\times 10^{-5}$
s. The pressure--velocity coupling in the transient simulation was achieved using the pressure-implicit with splitting of operators (PISO) scheme (Issa Reference Issa, Gasman and Watkins1986). Second-order upwind discretisation was employed for both momentum and energy equations (Murthy Reference Murthy and Mathur1997).
Settings for numerical simulation.

3.4. Grid independence test and model validation
Mesh configuration for the simulation model. (a) Overall illustration of the mesh structure. (b) Close-up view of the boundary layer mesh refinement.

To conduct a detailed analysis of the shear flow near the wall, wall enhancement functions are employed. Consequently, during the mesh generation phase, the boundary of the model is refined, as illustrated in figure 2. The boundary layer mesh can be achieved through inflation or bias techniques. This preparatory step is primarily conducted to enhance the accuracy of wall heat transfer effects. To ensure both computational efficiency and precision, tetrahedral elements are utilised for mesh construction. According to Cheng (Reference Cheng, Wang, Sun, Ji, Wang, Chen, Xu and Chen2023), the mesh fineness, distribution density, boundary refinement and overall mesh quantity directly influence both the condensation heat transfer effectiveness and computational time. As reported in their study, simulations were conducted using various mesh sizes: 40 669, 60 740, 84 868, 104 322 and 124 057 elements. These simulations analysed condensation heat transfer with an inlet gas velocity of 20 m s−1. The analysis revealed that increasing the number of mesh elements generally improved heat transfer performance. However, this trend gradually plateaued, indicating diminishing returns beyond a certain point. This observation suggests that excessively high mesh counts do not necessarily enhance computational efficiency and may, in fact, increase calculation time and convergence difficulties. Based on these findings, a mesh size of 84 868 elements was selected for the computational simulations. To validate the model, a mesh convergence study was conducted in comparison with the work of Cheng (Reference Cheng, Wang, Sun, Ji, Wang, Chen, Xu and Chen2023) shown in figure 3(a). The relationship between the number of mesh elements and the HTC is illustrated in figure 3(b). Based on the optimal mesh count, an inlet velocity of 20 m s−1, and other fixed parameters, the HTC was calculated. The simulation results were subsequently validated against experimental data. The average discrepancy between the numerical predictions and the experimental measurements was found to be merely 4.01 %. This low error percentage underscores the high accuracy and reliability of the numerical model in predicting heat transfer phenomena within the specified condensation tube configuration.
Comparison of HTC results. (a) Grid independence study from previous work by Cheng (Reference Cheng, Wang, Sun, Ji, Wang, Chen, Xu and Chen2023), which shows the HTC versus grid numbers. (b) Time evolution of HTC in the present study.

4. Results and discussion
Through careful selection of coupled parameters related to fluid properties, flow velocity and contact angle, a flow condensation study is established in the present computations. This regime encompasses a significant influence of both surface effect and flow inertia. Section 4.1 examines the effect of velocity on condensation heat transfer. The effect of surface wettability on liquid condensation is analysed in § 4.2. The coupled effect of inflow velocity and surface wettability is presented in § 4.3.
4.1. The effect of inflow vapour velocity on condensation heat transfer
Inflow vapour velocity plays a crucial role in condensation heat transfer, which significantly influences both the phase change process and HTC. The flow characteristics and phase distribution patterns are particularly sensitive to variations in inlet velocity, which directly affects the condensation efficiency and overall system performance. The broad velocity study (0.1–80 m s−1) was conducted to investigate the full spectrum of condensation behaviour, with 0.1 m s−1 specifically included to observe detailed condensation patterns in the quasi-steady state. This low-velocity case serves as an important baseline that helps visualise the fundamental condensation mechanisms, even though it shows the lowest heat transfer efficiency. In this series of visualisations, the red regions represent the vapour phase while the blue areas denote the liquid phase, which provides a clear delineation of the two-phase flow dynamics within the microchannels under various vapour inflow velocities.
4.1.1. Liquid condensation pattern in quasi-steady state
Quasi-steady state condensation patterns of R134a (
 $p / p_c=0.25$
) near the outlet region (750--800 mm) of the horizontal tube at different inlet velocities at
 $Ja_v/$
Pr
 $_v=0.076$
. The inlet velocities are: (a) 0.1 m s−1, (b) 10 m s−1, (c) 20 m s−1, (d) 40 m s−1, and (e) 80 m s−1. The color scale represents the phase distribution, with red indicating vapor and colors from yellow to blue indicating increasing liquid fraction.

Figure 4 illustrates the quasi-steady state R134a (
 $p/p_c=0.25$
) liquid condensation patterns inside a horizontal tube across a range of inlet velocities from 0.1 to 80 m s−1.The computational domain encompasses a pipe with a total length of 800 mm; however, the region of interest is confined to the terminal section (750–800 mm) proximal to the outlet. This focused analysis is justified by the negligible condensation phenomena observed in the upstream region (0–750 mm). The spatial discretisation of the liquid condensation characteristics is particularly emphasised in this exit region, where the phase change dynamics exhibit more pronounced manifestations. The colour scale represents the phase distribution, with red indicating vapour and the progression from yellow to blue signifying increasing liquid fraction.
At the lowest velocity of 0.1 m s−1, significant liquid accumulation is observed at the bottom of the tube, indicated by the yellow to blue regions. This stratification is a result of gravity-driven flow, where the slow vapour movement allows condensed liquid to settle, forming a distinct layer at the bottom. This stratified flow regime is characteristic of low-velocity condensation in horizontal tubes. At moderate velocities of 10 and 20 m s−1, the stratification becomes less pronounced. The higher vapour velocity creates increased shear at the liquid--vapour interface, promoting better mixing. While some liquid still accumulates at the bottom, it is less distinct than in the low-velocity case. The increased turbulence at these velocities enhances heat transfer, potentially leading to more uniform condensation along the tube walls. At high velocities of 40 and 80 m s−1, the flow appears almost entirely vapour, as indicated by the predominant red colour. However, this does not necessarily imply less condensation. Instead, it suggests that the high vapour velocity is likely entraining the condensed liquid, creating a mist or annular flow regime. The liquid film on the tube walls is probably very thin and moving at high speed, making it less visible in this representation.
These observations reveal important physical insights about the condensation process. The increasing velocity demonstrates a transition from stratified flow to potentially annular or mist flow, significantly affecting heat and mass transfer rates. Higher velocities lead to thinner liquid films due to increased shear, which can enhance heat transfer by reducing thermal resistance. However, these higher velocities also reduce the residence time of the vapour in the tube, potentially limiting the total amount of condensation despite improved HTCs. The elevated velocities will lead to an increased pressure drop along the tube, a crucial consideration in system design, although this effect is not directly shown in the visualisation. The transition to more turbulent regimes at higher velocities generally enhances heat transfer, but there may be an optimal velocity beyond which further increases yield diminishing returns.
Time evolution of R134a (
 $p/p_c=0.25$
) liquid volume fraction inside the horizontal condensation tube with different inlet velocities: (a) 0.1 m s−1, (b) 10 m s−1, (c) 20 m s−1, (d) 40 m s−1 and (e) 80 m s−1 at
 $Ja_v/$
Pr
 $_v=0.076$
.

4.1.2. Temporal volume fraction of condensation liquid
Figure 5 illustrates the temporal R134a (
 $p/p_c=0.25$
) liquid volume fraction for different inlet velocities in a horizontal condensation tube with
 $Ja_v/$
Pr
 $_v=0.076$
. The graph tracks the liquid accumulation process for velocities ranging from 0.1 to 80 m s−1 over a 0.5 s period. At the lowest velocity of 0.1 m s−1, represented by the black line, we observe a steady increase in liquid fraction throughout the simulation, reaching the highest final value among all cases. This indicates significant condensation and liquid accumulation at low flow rates. The 10 m s−1case (red line) shows a similar trend but with a slightly lower final liquid volume fraction. As we move to higher velocities, a distinct pattern emerges. The 20 m s−1 case (green line) initially follows the lower velocity trends but stabilises earlier at a lower liquid fraction. For the highest velocities of 40 and 80 m s−1 (blue and pink lines, respectively), minimal liquid accumulation is observed, with the curves quickly plateauing at very low liquid fractions. This behaviour suggests that at higher velocities, the increased shear forces and reduced residence time significantly limit liquid accumulation within the tube, despite potential increases in the condensation rate. This figure effectively captures the transition from gravity-dominated flow at low velocities to shear-dominated flow at high velocities, which demonstrates the complex interaction between condensation rate, liquid entrainment and flow dynamics in horizontal condensation tubes.
4.1.3. Temporal heat transfer characteristics
Time evolution of R134a (
 $p/p_c=0.25$
) HTC for various inlet velocities: (a) 0.1 m s−1, (b) 10 m s−1, (c) 20 m s−1, (d) 40 m s−1 and (e) 80 m s−1 in a horizontal condensation tube with
 $Ja_v/$
Pr
 $_v=0.076$
.

Figure 6 illustrates the temporal development of HTCs for different inlet velocities ranging from 0.1 to 80 m s−1 in a horizontal condensation tube over a 0.5 s period. The trend reveals a clear correlation between inflow vapour velocity and heat transfer performance. At the lowest velocity of 0.1 m s−1, the HTC starts low and gradually increases, reaching about 6 kWm
 $^2\cdot$
K−1 by the end of the simulation. As the inlet velocity increases, both higher initial and final HTCs are observed, with faster stabilisation times. The most striking feature is the significant enhancement in heat transfer performance at higher velocities. The 80 m s−1 case exhibits the highest HTC, fluctuating around 15 kWm
 $^2\cdot$
K−1, more than double that of the lowest velocity case. This substantial improvement can be attributed to increased turbulence and thinner liquid films at high velocities, which reduce thermal resistance and enhance heat transfer.
Interestingly, the curves for higher velocities (40 and 80 m s−1) show rapid initial increases followed by relatively stable values with some fluctuations. This suggests that at these velocities, the flow quickly establishes a quasi-steady state of heat transfer. In contrast, lower velocities show a more gradual increase over time, indicating a slower development of the condensation process and thermal boundary layer. The data implies that there might be an optimal velocity range for heat transfer enhancement. While increasing velocity generally improves heat transfer, the relative gain diminishes at very high speeds. This could be due to reduced residence time for heat transfer or the onset of different flow regimes like annular or mist flow. Our findings demonstrate both qualitative and quantitative agreement with the seminal work of Cheng (Reference Cheng, Wang, Sun, Ji, Wang, Chen, Xu and Chen2023), which states the increasing flow velocity enhances the HTC.
4.2. Effect of surface wettability on liquid condensation
Contact angle, a crucial parameter in surface wettability, significantly influences the condensation heat transfer process by affecting droplet formation, liquid film dynamics and overall heat transfer efficiency. The interaction between liquid and solid surfaces, characterised by the contact angle, plays a fundamental role in determining condensation modes and thermal performance. This section investigates the influence of contact angle with specified inlet velocity on condensation heat transfer performance. In the combined velocity-contact angle investigation, the study concentrated on the inflow vapour velocity range of 10–80 m s−1 as this range better represents typical operating conditions in practical applications. This selection was particularly meaningful since higher velocities demonstrated more significant heat transfer effects, making them more relevant for industrial applications. While very low velocities (such as 0.1 m s−1) were valuable for fundamental understanding, they were excluded from the combined study due to their limited practical applicability, given their poor heat transfer performance. This focused approach allowed for a more efficient and application-oriented investigation of the interaction between velocity and contact angle effects on condensation behaviour.
4.2.1. Inflow vapour velocity of 10 m s−1
The gas entering from the inlet condenses into liquid due to the cooling effect of the tube wall. Figure 7 illustrates the evolution of R134a (
 $p/p_c=0.25$
) liquid fraction for various contact angles ranging from 0
 $^\circ$
(highly hydrophilic) to 90
 $^\circ$
(hydrophobic) at an inlet velocity of 10 m s−1 in a condensation tube. The condensed liquid volume fraction ranged from 0.00219–0.00259. The data are presented across three time scales: (a) the full simulation time of 0–0.5 s, (b) a detailed view from 0.40 to 0.52 s and (c) a close-up view from 0.480 to 0.492 s. In figure 7(a) a consistent increase in liquid fraction for all contact angles up to about 0.3 s is observed, after which the growth rate slows and begins to stabilise. Notably, the 90
 $^\circ$
contact angle (hydrophobic) shows a consistently higher liquid fraction throughout most of the simulation, while the more hydrophilic surfaces (0
 $^\circ$
–15
 $^\circ$
) tend to group together at slightly lower liquid fractions. The detailed view (figure 7
b) and close-up view (figure 7
c) reveal the subtle dynamics of the condensation process. These graphs show fluctuations in liquid fraction, indicating a continuous process of liquid formation, accumulation and possible removal. The amplitude of these fluctuations appears to be larger for the less hydrophilic surfaces (45
 $^\circ$
–90
 $^\circ$
), suggesting a more dynamic liquid--vapour interface.
These results demonstrate the complex relationship between surface wettability, vapour shear and gravity at moderate flow velocities. The data clearly shows that the contact angle influences the liquid volume fraction, even at this 10 m s−1 inflow velocity. The hydrophobic surface (90
 $^\circ$
) consistently exhibits higher liquid fractions throughout the simulation. This can be attributed to the formation of discrete droplets or thicker liquid films on these surfaces, which enhance liquid retention. Conversely, highly hydrophilic surfaces (0
 $^\circ$
–15
 $^\circ$
) demonstrate lower liquid fractions. This phenomenon likely occurs because the condensed liquid spreads into a very thin film on these surfaces, making it more susceptible to being swept away by the vapour flow. The intermediate contact angles show a gradual transition between these two extremes, which highlights the continuous nature of wettability’s effect on condensation dynamics. The observed differences in liquid fraction and fluctuation patterns underscore the persistent influence of surface properties on local condensation behaviour. These findings suggest that at moderate velocities like 10 m s−1, surface wettability plays a discernible role in shaping condensation patterns and liquid retention.
The R134a (
 $p/p_c=0.25$
) liquid fraction evolution for hydrophilic contact angles at 10 m s−1 inlet velocity with
 $Ja_v/$
pr
 $_v=0.076$
. (a) Full simulation time from 0 to 0.5 s. (b) Detailed view from 0.40 to 0.52 s. (c) Close-up view from 0.480 to 0.492 s.

The R134a (
 $p/p_c=0.25$
) liquid fraction evolution for hydrophobic contact angles at 10 m s−1 inlet velocity with
 $Ja_v/$
Pr
 $_v=0.076$
. (a) Full simulation time from 0 to 0.5 s. (b) Detailed view from 0.30 to 0.55 s. (c) Close-up view from 0.480 to 0.492 s.

Figure 8 illustrates the evolution of R134a (
 $p/p_c=0.25$
) liquid fraction for various hydrophobic contact angles ranging from 90
 $^\circ$
to 175
 $^\circ$
at an inlet velocity of 10 m s−1 in a condensation tube. The condensed liquid volume fraction ranged from 0.00205–0.00260. The data are presented across three time scales: (a) the full simulation time of 0–0.5 s, (b) a detailed view from 0.30 to 0.55 s and (c) a close-up view from 0.480 to 0.492 s. In figure 8(a) a rapid increase in liquid fraction for all contact angles up to about 0.3 s is observed, followed by a stabilisation period. Interestingly, the liquid fractions for different contact angles converge to similar values, ranging between 0.0020 and 0.0025, suggesting that at this inlet velocity, the impact of contact angle on overall condensation rate is applicable for hydrophobic surfaces. The detailed view (figure 8
b) and close-up view (figure 8
c) reveal subtle differences in the condensation behaviour for different contact angles. These graphs show fluctuations in liquid fraction, indicating a dynamic process of droplet formation, growth and removal. The most hydrophobic surfaces (165
 $^\circ$
–175
 $^\circ$
) seem to exhibit slightly lower liquid fractions and smaller amplitude fluctuations compared with the less hydrophobic surfaces (90
 $^\circ$
–120
 $^\circ$
).
The similarity in average liquid fraction across different contact angles suggests that at 10 m s−1, the subtle differences observed, particularly in the fluctuation patterns, indicate that surface properties still influence local condensation dynamics. The lower liquid fractions and smaller fluctuations for the most hydrophobic surfaces might be attributed to easier droplet removal due to reduced adhesion to the surface. Conversely, the slightly higher liquid fractions and larger fluctuations for the less hydrophobic surfaces (90
 $^\circ$
–120
 $^\circ$
) could be due to a balance between droplet formation and removal that allows for slightly more liquid retention. These observations suggest that in hydrophobic conditions at moderate velocities, the condensation process is characterised by a continuous cycle of droplet nucleation, growth and removal, with the balance slightly shifted towards more efficient removal for the most hydrophobic surfaces.
Effect of hydrophilic contact angle on R134a (
 $p/p_c=0.25$
) condensation parameters at 10 m s−1 inlet velocity with
 $Ja_v/$
Pr
 $_v=0.076$
, the figures show zoomed-in views near the wall region to highlight liquid film formation and distribution for various contact angles (CA): (a) CA = 0
 $^\circ$
, (b) CA = 5
 $^\circ$
, (c) CA = 10
 $^\circ$
, (d) CA = 15
 $^\circ$
, (e) CA = 30
 $^\circ$
, (f) CA = 45
 $^\circ$
and (g) CA = 60
 $^\circ$
. The colour scale indicates liquid fraction from 0 (red) to 1.0 (blue), demonstrating the variation in liquid film thickness and interface characteristics as the contact angle changes.

Figure 9 demonstrates the effect of hydrophilic contact angles on R134a refrigerant condensation parameters, specifically focusing on the liquid film formation near the wall region. The analysis examines different contact angles ranging from 0
 $^\circ$
to 60
 $^\circ$
, revealing several significant phenomena in the condensation process. The
 $x$
-axis position varies across different contact angles because liquid film formation does not occur uniformly along the wall. Instead, the analysis focuses on regions near the outlet where liquid film formation is most pronounced and clearly observable. The
 $x$
-coordinate shifts are carefully selected to capture these representative areas of liquid film development, typically occurring around
 $x$
= 0.79, though the exact position varies with different contact angles.
A particularly noteworthy observation is the consistent
 $y$
-axis range of 0–0.0003 across all cases, which provides a standardised framework for comparing liquid film characteristics. The visualisation employs a colour scheme where red represents the primary liquid phase region, while a thin multi-coloured layer at the bottom (transitioning from blue to yellow) indicates the interface between the liquid film and vapour phase. As the contact angle increases from 0
 $^\circ$
to 45
 $^\circ$
, there is a clear trend in the liquid film behaviour. The most striking feature is the gradual decrease in liquid film height, evidenced by the reducing thickness of the blue region at higher contact angles. This phenomenon can be attributed to the changing surface wettability characteristics. At lower contact angles, the liquid demonstrates better spreading behaviour, resulting in a more distributed film thickness.
However, an intriguing reversal occurs between 45
 $^\circ$
and 60
 $^\circ$
, where the liquid film thickness unexpectedly increases. This reversal might be attributed to several possible mechanisms. First, fluid dynamic effects at higher contact angles (60
 $^\circ$
) might generate local vortices or secondary flows, leading to liquid accumulation in certain regions. Second, a new balance point between surface tension, gravity and fluid inertial forces might be established at 60
 $^\circ$
, preventing the maintenance of the thinnest film state observed at 45
 $^\circ$
. Third, the larger contact angle might trigger interface instabilities that result in local film thickening. These hypotheses require further experimental investigation and numerical simulation to fully understand the underlying physical mechanisms. The interface transition zone, marked by the colourful gradient band, maintains similar characteristics across different contact angles, though its position shifts with the contact angle changes. This consistent interface behaviour, despite varying contact angles, suggests a robust physical mechanism governing the liquid--vapour interaction in the condensation process. These observations are crucial for understanding heat transfer efficiency and optimising heat exchanger designs, as the liquid film thickness and distribution directly impact the overall heat transfer performance of the system.
Effect of hydrophobic contact angle on R134a (
 $p/p_c=0.25$
) condensation parameters at 10 m s−1 inlet velocity with
 $Ja_v/$
Pr
 $_v=0.076$
, the figures show zoomed-in views near the wall region to highlight liquid film formation and distribution for various contact angles (CA): (a) CA = 90
 $^\circ$
, (b) CA = 120
 $^\circ$
, (c) CA = 135
 $^\circ$
, (d) CA = 150
 $^\circ$
, (e) CA = 165
 $^\circ$
, (f) CA = 170
 $^\circ$
and (g) CA = 175
 $^\circ$
. The colour scale indicates liquid fraction from 0 (red) to 1.0 (blue), demonstrating the variation in liquid film thickness and interface characteristics as the contact angle changes.

The distribution of liquid film during R134a condensation is visualised in figure 10 for varying contact angles ranging from
 $90^{\circ }$
to
 $175^{\circ }$
. The simulations were performed at reduced pressure
 $p/p_c = 0.25$
, inlet velocity of 10 m s−1 and dimensionless parameter
 $J_{av}/Pr_v = 0.076$
. The colour maps represent the phase distribution, with blue (1.0) indicating the liquid phase and red (0) denoting the vapour phase. For lower contact angles (
 $90^{\circ }$
–
 $135^{\circ }$
), the liquid--vapour interface exhibits a relatively sharp and stable stratification, indicating dominant surface tension effects. At contact angle
 $\text{CA} = 135^{\circ }$
, the liquid film reaches its minimum thickness, suggesting an optimal condition for liquid--vapour phase interaction and potentially enhanced heat transfer performance. As the contact angle increases beyond
 $150^{\circ }$
, interfacial instabilities become more pronounced, particularly evident in cases (e)–(g). This phenomenon can be attributed to the enhanced dropwise condensation behaviour on more hydrophobic surfaces (
 $\text{CA} \gt 150^{\circ }$
), where surface tension forces increasingly compete with gravitational and shear forces. Notably, at
 $\text{CA} = 175^{\circ }$
, a complete vapour film is observed adjacent to the wall, demonstrating the extreme non-wetting behaviour at this high contact angle. This vapour layer, combined with the significant liquid film breakup and reorganisation above it, represents a transition to a Leidenfrost-like state where the liquid phase is effectively suspended above a vapour cushion. The minimum film thickness at
 $135^{\circ }$
and the complete vapour film formation at
 $175^{\circ }$
represent two distinct critical phenomena in the condensation mechanism, each with significant implications for heat transfer efficiency.
4.2.2. Inflow vapour velocity of 20 m s−1
The R134a (
 $p/p_c=0.25$
) liquid fraction evolution for hydrophilic contact angles at 20 m s−1 inlet velocity with
 $Ja_v/$
pr
 $_v=0.076$
. (a) Full simulation time from 0 to 0.5 s. (b) Detailed view from 0.30 to 0.55 s. (c) Close-up view from 0.480 to 0.492 s.

Figure 11 illustrates the evolution of R134a (
 $p/p_c=0.25$
) liquid fraction for various hydrophilic contact angles (0
 $^\circ$
–90
 $^\circ$
) at an inlet velocity of 20 m s−1 in a condensation tube. The condensed liquid volume fraction ranged from 0.00118 to 0.00134. The data are presented across three time scales: (a) the full simulation time of 0–0.5 s, (b) a detailed view from 0.30 to 0.55 s and (c) a close-up view from 0.4800 to 0.4900 s. In figure 11(a) a rapid increase in liquid fraction for all contact angles up to about 0.2 s is shown, followed by a stabilisation period. Interestingly, at this higher inlet velocity of 20 m s−1, the differences in liquid fraction between various contact angles are less pronounced compared with the 10 m s−1 case. This suggests that the increased vapour shear at higher velocities plays a more dominant role in liquid removal, somewhat mitigating the effects of surface wettability. The detailed view (figure 11
b) and close-up view (figure 11
c) reveal subtle dynamics in the condensation process. These graphs show fluctuations in liquid fraction, indicating a continuous process of liquid formation, accumulation and removal. The amplitude of these fluctuations appears similar across different contact angles, suggesting that at this velocity, the vapour shear forces are strong enough to create a more uniform liquid layer behaviour regardless of surface wettability.
The increased vapour velocity leads to stronger shear forces, which appear to override some of the surface tension effects that were more prominent at lower velocities. This results in a more uniform liquid distribution across different contact angles. The slightly higher liquid fraction observed for the 90
 $^\circ$
contact angle (least hydrophilic) could be attributed to the formation of larger droplets that are more resistant to removal by vapour shear. However, the difference is less significant compared with the 10 m s−1 case, indicating that the higher velocity flow is more effective at removing even these larger droplets. These findings suggest that at higher velocities like 20 m s−1, the choice of surface treatment may have less impact on overall condensation behaviour than at lower velocities. The dominant effect of vapour shear in liquid removal at this velocity implies that other factors, such as tube geometry or overall HTC, may become more critical in optimising condensation processes under these conditions.
The R134a (
 $p/p_c=0.25$
) liquid fraction evolution for hydrophobic contact angles at 20 m s−1 inlet velocity with
 $Ja_v/$
pr
 $_v=0.076$
. (a) Full simulation time from 0 to 0.5 s. (b) Detailed view from 0.30 to 0.55 s. (c) Close-up view from 0.4800 to 0.4900 s.

Figure 12 illustrates the evolution of R134a (
 $p/p_c=0.25$
) liquid fraction for various hydrophobic contact angles (90
 $^\circ$
–175
 $^\circ$
) at an inlet velocity of 20 m s−1 in a condensation tube. The condensed liquid volume fraction ranged from 0.00121 to 0.00140. The data are presented across three time scales: (a) the full simulation time of 0–0.5 s, (b) a detailed view from 0.30 to 0.55 s and (c) a close-up view from 0.480 to 0.492 s. In figure 12(a) a rapid increase in liquid fraction for all contact angles up to about 0.2 s is observed, followed by a stabilisation period. At this higher inlet velocity of 20 m s−1, the differences in liquid fraction between various hydrophobic contact angles are less pronounced compared with lower velocities. This suggests that the increased vapour shear at higher velocities plays a more dominant role in liquid removal, somewhat mitigating the effects of extreme hydrophobicity. The detailed view (figure 12
b) and close-up view (figure 12
c) reveal subtle dynamics in the condensation process. These graphs show fluctuations in liquid fraction, indicating a continuous process of droplet formation, growth and removal. The amplitude of these fluctuations appears similar across different contact angles, suggesting that at this velocity, the vapour shear forces are strong enough to create a more uniform droplet behaviour regardless of the degree of hydrophobicity.
The increased vapour velocity leads to stronger shear forces, which appear to override some of the surface tension effects that were more prominent at lower velocities. This results in a more uniform liquid distribution across different hydrophobic contact angles. The slightly higher liquid fraction observed for the less hydrophobic angles (90
 $^\circ$
–120
 $^\circ$
) could be attributed to the formation of larger droplets that are more resistant to removal by vapour shear. However, the difference is less significant compared with lower velocity cases, indicating that the higher velocity flow is more effective at removing even these larger droplets. These findings suggest that at higher velocities like 20 m s−1, the degree of hydrophobicity may have less impact on overall condensation behaviour than at lower velocities. The dominant effect of vapour shear in droplet removal at this velocity implies that other factors, such as tube geometry or overall HTC, may become more critical in optimising condensation processes under these conditions. This has important implications for the design of condensation systems operating at higher velocities, where the choice of surface treatment may be less critical than other design parameters.
4.2.3. Inflow vapour velocity of 40 m s−1
The R134a (
 $p/p_c=0.25$
) liquid fraction evolution for hydrophilic contact angles at 40 m s−1 inlet velocity with
 $Ja_v/$
pr
 $_v=0.076$
.(a) Full simulation time from 0 to 0.5 s. (b) Detailed view from 0.30 to 0.55 s. (c) Close-up view from 0.480 to 0.492 s.

Figure 13 illustrates the evolution of the liquid fraction for various hydrophilic contact angles (0
 $^\circ$
to 90
 $^\circ$
) at an inlet velocity of 40 m s−1 in a condensation tube. The condensed liquid volume fraction ranged from 0.000468 to 0.000542. The data are presented across three time scales: (a) the full simulation time of 0–0.5 s, (b) a detailed view from 0.30 to 0.55 s and (c) a close-up view from 0.480 to 0.4902 s. In figure 13(a) a rapid increase in liquid fraction for all contact angles up to about 0.1 s is observed, followed by a stabilisation period. At this high inlet velocity of 40 m s−1, the differences in liquid fraction between various contact angles are minimal, with all curves closely overlapping. This suggests that at such high velocities, the effect of surface wettability on liquid accumulation is significantly diminished. The detailed view (figure 13
b) and close-up view (figure 8
c) reveal high-frequency fluctuations in the liquid fraction for all contact angles. These fluctuations are more pronounced and rapid compared with lower velocity cases, indicating a highly dynamic condensation process. The amplitude and frequency of these fluctuations appear similar across different contact angles, suggesting that the vapour shear forces at this velocity dominate over surface tension effects in controlling liquid behaviour.
The R134a (
 $p/p_c=0.25$
) liquid fraction evolution for hydrophobic contact angles at 40 m s−1 inlet velocity with
 $Ja_v/$
Pr
 $_v=0.076$
. (a) Full simulation time from 0 to 0.5 s. (b) Detailed view from 0.30 to 0.55 s. (c) Close-up view from 0.480 to 0.492 s.

Figure 14 illustrates the evolution of liquid fraction for various hydrophobic contact angles (90
 $^\circ$
to 175
 $^\circ$
) at an inlet velocity of 40 m s−1 in a condensation tube. The condensed liquid volume fraction ranges from 0.000478 to 0.000535. The data are presented across three time scales: (a) the full simulation time of 0–0.5 s, (b) a detailed view from 0.30 to 0.55 s and (c) a close-up view from 0.480 to 0.492 s. In figure 14(a) a rapid increase in liquid fraction for all contact angles up to about 0.05 s is shown, followed by a stabilisation period. At this high inlet velocity of 40 m s−1, the differences in liquid fraction between various hydrophobic contact angles are minimal, with all curves closely overlapping. This suggests that at such high velocities, the effect of surface hydrophobicity on liquid accumulation is significantly diminished. The detailed view (figure 14
b) and close-up view (figure 14
c) reveal high-frequency fluctuations in the liquid fraction for all contact angles. These fluctuations are more pronounced and rapid compared with lower velocity cases, indicating a highly dynamic condensation process. The amplitude and frequency of these fluctuations appear similar across different contact angles, suggesting that the vapour shear forces at this velocity dominate over surface tension effects in controlling droplet behaviour.
At an inlet velocity of 40 m s−1, the condensed liquid volume fraction is much lower than previous cases. The condensation dynamics is predominantly governed by intense vapour shear forces rather than surface wettability effects. The high-velocity vapour flow generates substantial shear forces that effectively remove condensed liquid regardless of surface hydrophobicity, resulting in a nearly uniform liquid distribution across different contact angles. This phenomenon is characterised by rapid fluctuations indicating a continuous cycle of condensation and removal, where liquid condensate is promptly stripped away by the strong vapour current. The observed uniformity in liquid fraction across varying contact angles suggests that the condensation process at this velocity regime is primarily controlled by the high-speed vapour flow rather than surface properties. These findings have significant implications for condensation system design in high-velocity applications. At speeds of approximately 40 m s−1, the selection of surface treatments for modifying hydrophobicity may have minimal impact on overall condensation behaviour. Instead, the optimisation of condensation processes under these high-velocity conditions should prioritise other design parameters, such as tube geometry, overall HTC and pressure drop considerations.
4.2.4. Inflow vapour velocity of 80 m s−1
The R134a (
 $p/p_c=0.25$
) liquid fraction evolution for hydrophilic contact angles at 80 m s−1 inlet velocity with
 $Ja_v/$
pr
 $_v=0.076$
. (a) Full simulation time from 0 to 0.5 s. (b) Detailed view from 0.30 to 0.55 s. (c) Close-up view from 0.480 to 0.492 s.

Figure 15 illustrates the evolution of liquid fraction for various hydrophilic contact angles (0
 $^\circ$
to 90
 $^\circ$
) at an extremely high inlet velocity of 80 m s−1 in a condensation tube. The condensed liquid volume fraction ranged from 0.0001593 to 0.000106. The data are presented across three time scales: (a) the full simulation time of 0–0.5 s, (b) a detailed view from 0.30 to 0.55 s and (c) a close-up view from 0.4800 to 0.4920 s.
In figure 15(a) we observe an extremely rapid increase in liquid fraction for all contact angles within the first 0.05 s, followed by a highly fluctuating steady state. At this very high inlet velocity, the differences in liquid fraction between various contact angles are negligible, with all curves overlapping and exhibiting similar fluctuation patterns. This suggests that at such extreme velocities, the effect of surface wettability on liquid accumulation is almost entirely overshadowed by the dominant influence of vapour shear forces. The detailed view (figure 15 b) and close-up view (figure 15 c) reveal intense, high-frequency fluctuations in the liquid fraction for all contact angles. These fluctuations are more rapid and chaotic compared with lower velocity cases, indicating an extremely dynamic condensation process dominated by turbulent flow. The amplitude and frequency of these fluctuations appear nearly identical across different contact angles, further emphasising the overwhelming influence of vapour shear forces in controlling liquid behaviour at this velocity.
These results highlight the complete dominance of vapour shear forces over surface wettability effects at extremely high flow velocities. The 80 m s−1 vapour velocity generates such strong shear forces that they effectively strip away any condensed liquid almost instantaneously, regardless of the surface’s hydrophilicity. This results in a uniform, highly dynamic liquid distribution across all contact angles. The observed behaviour suggests that at 80 m s−1, the condensation process is in a constant state of flux, with rapid cycles of condensation and immediate removal. The strong vapour current likely creates a very thin, turbulent liquid film or a mist-like layer of tiny droplets that are continuously formed and swept away. This regime of condensation is primarily controlled by the extreme flow conditions rather than surface properties.
These findings have significant implications for condensation system design at very high velocities. It is suggested that at speeds around 80 m s−1, surface treatments for hydrophilicity have negligible impact on overall condensation behaviour. Instead, factors such as tube geometry, overall HTC, pressure drop and material durability under high-speed flow conditions become the critical considerations in optimising condensation processes. This understanding could lead to a shift in design focus for extreme high-speed condensation systems, where the emphasis might be placed on managing the intense shear forces and optimising overall system hydrodynamics rather than surface wettability treatments
The R134a (
 $p/p_c=0.25$
) liquid fraction evolution for hydrophilic contact angles at 80 m s−1 inlet velocity with
 $Ja_v/$
pr
 $_v=0.076$
. (a) Full simulation time from 0 to 0.5 s. (b) Detailed view from 0.30 to 0.55 s. (c) Close-up view from 0.480 to 0.492 s.

Figure 16 illustrates the evolution of the liquid fraction for various hydrophobic contact angles (90
 $^\circ$
to 175
 $^\circ$
) at an extremely high inlet velocity of 80 m s−1 in a condensation tube. The condensed liquid volume fraction ranged from 0.0001602 to 0.000106. The data are presented across three time scales: (a) the full simulation time of 0–0.5 s, (b) a detailed view from 0.30 to 0.55 s and (c) a close-up view from 0.480 to 0.492 s.
In figure 16(a) an extremely rapid increase in liquid fraction is observed for all contact angles within the first 0.05 s, followed by a highly fluctuating steady state. At this very high inlet velocity, the differences in liquid fraction between various hydrophobic contact angles are minimal, with all curves overlapping and exhibiting similar fluctuation patterns. This suggests that at such extreme velocities, the effect of surface hydrophobicity on liquid accumulation is almost entirely overshadowed by the dominant influence of vapour shear forces. The detailed view (figure 16 b) and close-up view (figure 16 c) reveal intense, high-frequency fluctuations in the liquid fraction for all contact angles. These fluctuations are more rapid and chaotic compared with lower velocity cases, indicating an extremely dynamic condensation process dominated by turbulent flow. The amplitude and frequency of these fluctuations appear nearly identical across different contact angles, further emphasising the overwhelming influence of vapour shear forces in controlling liquid behaviour at this velocity.
These results highlight the complete dominance of vapour shear forces over surface hydrophobicity effects at extremely high flow velocities. The 80 m s−1 vapour velocity generates such strong shear forces that they effectively strip away any condensed liquid almost instantaneously, regardless of the surface’s hydrophobicity. This results in a uniform, highly dynamic liquid distribution across all contact angles. The observed behaviour suggests that at 80 m s−1, the condensation process is in a constant state of flux, with rapid cycles of droplet formation and immediate removal. The strong vapour current likely creates a very thin, turbulent liquid film or a mist-like layer of tiny droplets that are continuously formed and swept away. This regime of condensation is primarily controlled by the extreme flow conditions rather than surface properties.
Effect of contact angle on R134a (
 $p/p_c=0.25$
) condensation parameters at 10 m s−1 inlet velocity with
 $Ja_v/$
pr
 $_v=0.076$
. (a) Heat transfer coefficient, (b) equivalent Reynolds number (Re
 $_{eq}$
) and (c) Nusselt number (
 $Nu$
) as functions of contact angle.

4.3. Coupled effect of inflow vapour velocity and surface wettability on flow characteristics
Figure 17 illustrates the relationship between contact angle and three key parameters in condensation heat transfer at an inflow vapour velocity of 10 m s−1: HTC, equivalent Reynolds number (Re
 $_{eq}$
) and Nusselt number (
 $Nu$
). The HTC (figure 17
a) shows a nonlinear relationship with contact angle, peaking around 120
 $^\circ$
–140
 $^\circ$
. The manipulation of surface wettability through contact angle modification demonstrates a significant impact on heat transfer performance. The HTC exhibits a notable enhancement of 19.1% between its peak and minimum values. The observed relationship can be explained by the distinct condensation mechanisms across different surface wettabilities. On superhydrophilic surfaces, the condensate forms a continuous liquid film due to strong surface adhesion. While this complete wetting behaviour initially promotes condensation, the accumulated liquid film acts as a thermal barrier, impeding vapour-to-surface heat transfer. This thermal resistance reduces the local temperature gradient at the vapour--liquid interface, diminishing the overall HTC. Conversely, on superhydrophobic surfaces, the extreme non-wetting behaviour inhibits the formation of stable liquid condensate. Although this characteristic promotes droplet mobility and surface renewal, the poor thermal contact between the condensate and the cooling surface restricts the rate of latent heat removal, adversely affecting the overall heat transfer performance. These contrasting mechanisms indicate that optimal condensation heat transfer occurs at intermediate wettability conditions (around 120
 $^\circ$
–140
 $^\circ$
), where a balance exists between condensate removal efficiency and effective thermal transport through the liquid phase.
The equivalent Reynolds number (Re
 $_{eq}$
) shown in figure 17(b) decreases with increasing contact angle, indicating that more hydrophobic surfaces lead to reduced liquid film thickness or droplet size, resulting in lower fluid velocities near the wall. The Nusselt number (
 $Nu$
) shown in figure 17(c) exhibits a nonlinear relationship with contact angle, with local minima around 90
 $^\circ$
–120
 $^\circ$
and higher values at both hydrophilic and extremely hydrophobic angles. These trends reveal the intricate physics governing condensation at moderate flow velocities. The peak in HTC for moderately hydrophobic surfaces likely results from an optimal balance between dropwise and filmwise condensation. At these angles, droplets are large enough to promote efficient heat transfer but small enough to be easily removed by vapour shear, preventing the formation of an insulating liquid layer. The decreasing Reynolds number (Re
 $_{eq}$
) with increasing contact angle suggests that hydrophobic surfaces promote droplet formation and removal, reducing overall liquid retention. The Nusselt number (
 $Nu$
) trend indicates that both very hydrophilic and very hydrophobic surfaces enhance convective heat transfer, possibly through different mechanisms: thin film conduction for hydrophilic surfaces and efficient droplet removal for highly hydrophobic ones. Table 6 reveals significant variations in the standard deviation of the HTC (
 $\sigma _{\textit{htc}}$
) across different contact angles at an inlet velocity of 10 m s−1. Notably, the highest variability occurs at 90
 $^\circ$
(170.48 Wm
 $^2\cdot$
K−1), while the lowest is observed at 10
 $^\circ$
(40.01 Wm
 $^2\cdot$
K−1). This variability pattern suggests that the stability of heat transfer is highly dependent on the contact angle between the fluid and the surface. Concurrently, figure 17(a) illustrates a generally increasing trend in the HTC as the contact angle increases, reaching a peak around 135
 $^\circ$
before slightly declining at higher angles. This trend, when considered alongside the standard deviation data, points to intricate fluid dynamics at play in the system. The physics underlying these observations involve several interrelated phenomena. As the contact angle changes, it alters the wettability of the surface, which in turn affects how the fluid interacts with it. This changing interaction influences the thermal boundary layer and, consequently, the efficiency of heat transfer. The varying contact angles may also induce transitions between laminar and turbulent flow regimes, particularly evident in the high standard deviation at 90
 $^\circ$
. These flow regime transitions can significantly impact both the rate and stability of heat transfer.
Standard deviation of HTC (
 $\sigma _{\textit{htc}}$
, unit: W m
 $^2\cdot$
K−1) for various contact angles at an inlet velocity of 10 m s−1.

Effect of contact angle on R134a (
 $p/p_c=0.25$
) condensation parameters at 20 m s−1 inlet velocity with
 $Ja_v/$
Pr
 $_v=0.076$
. (a) Heat transfer coefficient, (b) equivalent Reynolds number (Re
 $_{eq}$
) and (c) Nusselt number (
 $Nu$
) as functions of contact angle.

Figure 18 illustrates the effect of contact angle on key condensation parameters at an inflow vapour velocity of 20 m s−1, presenting relationships between contact angle and HTC, equivalent Reynolds number (Re
 $_{eq}$
) and Nusselt number (
 $Nu$
). The HTC shown in figure 18(a) demonstrates a clear increasing trend with rising contact angle, suggesting that at 20 m s−1, more hydrophobic surfaces promote better heat transfer. The HTC exhibits a notable enhancement of
 $\gt$
11.7 % between its peak and minimum values. This can be attributed to the formation of dropwise condensation on hydrophobic surfaces, which typically offers lower thermal resistance compared with filmwise condensation on hydrophilic surfaces. Compared with the inflow velocity of 10 m s−1, the maximum HTC at 20 m s−1 demonstrates a substantial enhancement of
 $\gt$
38.8 %, which underscores the significant role of convective heat transfer in the condensation process. This marked improvement in heat transfer performance highlights the dominant influence of vapour shear on condensate removal and thermal transport efficiency at higher flow velocities. Conversely, the equivalent Reynolds number (Re
 $_{eq}$
) shown in figure 18(b) decreases as the contact angle increases, indicating significant changes in flow characteristics near the wall with varying surface wettability. On hydrophilic surfaces, a thicker liquid film forms, leading to higher Reynolds numbers (Re
 $_{eq}$
), while on more hydrophobic surfaces, dropwise condensation dominates, resulting in less continuous liquid and consequently lower Reynolds numbers (Re
 $_{eq}$
). The Nusselt number (
 $Nu$
) shown in figure 18(c), which represents the ratio of convective to conductive heat transfer, increases with contact angle. This trend aligns with the HTC behaviour and further confirms that hydrophobic surfaces enhance convective heat transfer at this velocity.
These results reveal complex interactions between surface wettability, fluid dynamics and heat transfer at 20 m s−1 inlet velocity. The enhanced heat transfer on hydrophobic surfaces can be explained by several factors. Hydrophobic surfaces promote dropwise condensation, which typically offers lower thermal resistance compared with continuous liquid films on hydrophilic surfaces. The decreasing equivalent Reynolds number (Re
 $_{eq}$
) with increasing contact angle suggests thinner liquid layers or smaller droplets on hydrophobic surfaces, reducing thermal resistance. Additionally, hydrophobic surfaces may facilitate faster removal of condensed droplets, constantly exposing a fresh surface area for condensation and enhancing overall heat transfer. At 20 m s−1, vapour shear forces are significant and might interact more effectively with droplets on hydrophobic surfaces, enhancing heat transfer through improved droplet removal and surface renewal. The linear increase in Nusselt number (
 $Nu$
) with contact angle suggests that the enhancement in convective heat transfer outweighs any potential reduction in conductive heat transfer through the liquid phase.
Table 7 shows the standard deviation of HTC (
 $\sigma _{\textit{htc}}$
) across different contact angles at 20 m s−1 inlet velocity, revealing distinctive patterns in condensation dynamics. Hydrophilic surfaces (0
 $^\circ$
–15
 $^\circ$
) exhibit moderate fluctuations (
 $\sigma _{\textit{htc}}\approx$
137–149 Wm
 $^2\cdot$
K−1) due to consistent liquid film formation, while the intermediate wettability region (30
 $^\circ$
–45
 $^\circ$
) shows the lowest fluctuations (
 $\sigma _{\textit{htc}}\approx$
103–110 Wm
 $^2\cdot$
K−1), suggesting optimal stability in heat transfer performance. As surface hydrophobicity increases (60
 $^\circ$
–120
 $^\circ$
), higher standard deviations (
 $\sigma _{\textit{htc}}\approx$
156–166 Wm
 $^2\cdot$
K−1) indicate more dynamic droplet behaviour. The extreme hydrophobic region (150
 $^\circ$
–175
 $^\circ$
) demonstrates the most significant fluctuations, peaking at 229.18 Wm
 $^2\cdot$
K−1 for 165
 $^\circ$
, indicating highly dynamic condensate behaviour. This trend reveals that surface wettability not only affects heat transfer magnitude but also significantly influences its temporal stability, with intermediate contact angles providing the most consistent performance under high-velocity flow conditions.
Standard deviation of HTC (
 $\sigma _{\textit{htc}}$
, unit: W m
 $^2\cdot$
K−1) for various contact angles at an inlet velocity of 20 m s−1.

Effect of contact angle on R134a (
 $p/p_c=0.25$
) condensation parameters at 40 m s−1 inlet velocity with
 $Ja_v/$
Pr
 $_v=0.076$
. (a) Heat transfer coefficient, (b) equivalent Reynolds number (Re
 $_{eq}$
) and (c) Nusselt number (
 $Nu$
) as functions of contact angle.

Figure 19 illustrates the effect of contact angle on key condensation parameters at an inlet velocity of 40 m s−1, presenting relationships between contact angle and HTC, equivalent Reynolds number (Re
 $_{eq}$
) and Nusselt number (
 $Nu$
). The HTC (figure 19
a) shows a complex nonlinear relationship with the contact angle. It initially decreases slightly for small contact angles, reaches a minimum around 40
 $^\circ$
, and then increases for larger contact angles, eventually plateauing for highly hydrophobic surfaces. This trend suggests that at this high velocity, moderately hydrophobic surfaces (
 $\gt$
90
 $^\circ$
) generally promote better heat transfer than hydrophilic ones. The HTC exhibits a minor enhancement of
 $\gt$
1.04 % between its peak and minimum values. The equivalent Reynolds number (Re
 $_{eq}$
) (Figure 19
b) exhibits an interesting peaked behaviour, with a maximum occurring around 30–40
 $^\circ$
. This peak indicates a transition in flow regime, possibly from film condensation to dropwise condensation. The subsequent decrease and stabilisation of the equivalent Reynolds number (Re
 $_{eq}$
) for higher contact angles suggest a more consistent dropwise condensation regime for hydrophobic surfaces. The Nusselt number (
 $Nu$
) (figure 19
c) shows a slight increase for small contact angles, peaks around 20
 $^\circ$
, and then gradually decreases and stabilises for higher contact angles. This trend partially mirrors the HTC behaviour but with some notable differences, particularly in the hydrophilic range.
These results shows that the enhanced heat transfer on hydrophobic surfaces can be attributed to the promotion of dropwise condensation, which typically offers lower thermal resistance compared with filmwise condensation on hydrophilic surfaces. However, the high vapour velocity appears to mitigate some of the advantages typically associated with extreme hydrophobicity. The peaked behaviour of the Reynolds number suggests a critical transition point in the condensation mechanism. This transition likely involves a shift from a continuous liquid film to discrete droplets, significantly altering the near-wall flow characteristics. The Nusselt number (
 $Nu$
) trend indicates that while hydrophobic surfaces generally enhance convective heat transfer at this velocity, the effect is less pronounced than at lower velocities. This could be due to the dominant influence of high-speed vapour flow, which may override some of the surface tension effects typically seen in condensation processes. These findings have important implications for designing high-performance condensers operating at high velocities. We suggest that moderately hydrophobic surface treatments could improve heat transfer efficiency, but the benefits may be less dramatic than at lower speeds due to the overriding influence of vapour shear.
The standard deviation of HTC (
 $\sigma _{htc}$
) at 40 m s−1 inlet velocity (shown in table 8) demonstrates a relatively uniform distribution across different contact angles, with values ranging from 76.59 to 125.49 Wm
 $^2\cdot$
K−1. This narrower range of fluctuations, compared with lower velocities (20 m s−1), indicates that the high vapour shear forces dominate the condensation process. The variations between hydrophilic (
 $0^\circ$
–
 $45^\circ$
,
 $\sigma _{htc} \approx$
90–125 Wm
 $^2\cdot$
K−1) and hydrophobic surfaces (
 $90^\circ$
–
 $175^\circ$
,
 $\sigma _{htc} \approx$
76–124 Wm
 $^2\cdot$
K−1) are less pronounced, suggesting that surface wettability effects become less significant at this high-velocity regime. This behaviour can be attributed to the intense vapour shear forces that rapidly strip away condensed liquid regardless of surface properties, leading to more uniform condensation dynamics across all contact angles. The absence of extreme peaks in
 $\sigma _{htc}$
further supports that the condensation process is primarily controlled by the high-speed vapour flow rather than surface wettability effects.
Standard deviation of HTC (
 $\sigma _{\textit{htc}}$
, unit: W m
 $^2\cdot$
K−1) for various contact angles at an inlet velocity of 40 m s−1.

Effect of contact angle on R134a (
 $p/p_c=0.25$
) condensation parameters at 80 m s−1 inlet velocity with
 $Ja_v/$
pr
 $_v=0.076$
. (a) Heat transfer coefficient, (b) equivalent Reynolds number (Re
 $_{eq}$
) and (c) Nusselt number (
 $Nu$
) as functions of contact angle.

Figure 20 illustrates the effect of contact angle on key condensation parameters at an extremely high inlet velocity of 80 m s−1, presenting relationships between contact angle and HTC, equivalent Reynolds number (Re
 $_{eq}$
) and Nusselt number (
 $Nu$
). The HTC (figure 20
a) shows a sharp peak at very low contact angles, followed by a relatively constant value across most of the contact angle range. The maximum value is approximately 15.11 kWm
 $^2\cdot$
K−1, while the minimum value occurs at around
 $120^\circ$
with approximately 15.03 kW/m
 $^2\cdot$
K. The difference between these peak and valley values is approximately equal to 0.08 kWm
 $^2\cdot$
K−1, representing a variation approximately equal to 0.53 % relative to the average value. This relatively small deviation suggests that the HTC remains fairly consistent across different contact angles, with only minor fluctuations in performance.This suggests that at this extreme velocity, the heat transfer enhancement typically associated with specific surface wettabilities is largely overshadowed by the dominant effect of the high-speed vapour flow. The equivalent Reynolds number (Re
 $_{eq}$
) (figure 20
b) exhibits minimal variation across most of the contact angle range, with a notable spike around 120
 $^\circ$
–130
 $^\circ$
. This spike could indicate a brief transition in flow regime, possibly related to a shift in droplet formation or removal dynamics at this specific wettability. The Nusselt number (
 $Nu$
) (figure 20
c) remains remarkably consistent across the entire range of contact angles, with only a slight dip observed around 100
 $^\circ$
–120
 $^\circ$
. This near-constant behaviour further emphasises the diminished influence of surface wettability on heat transfer performance at such high velocities. These results highlight the overwhelming dominance of vapour shear forces at 80 m s−1 inlet velocity. The extreme flow conditions appear to negate many of the surface tension and wettability effects typically observed in condensation processes at lower velocities. The consistent HTC across different contact angles suggests that the condensation mechanism is primarily controlled by the high-speed vapour flow rather than surface properties. The brief fluctuations observed in the equivalent Reynolds number (Re
 $_{eq}$
) and HTC around 100
 $^\circ$
–130
 $^\circ$
might indicate a narrow range where surface properties briefly influence the flow dynamics, possibly due to a specific interaction between droplet formation, vapour shear and surface tension at these contact angles. These findings have significant implications for the design of ultra-high-speed condensation systems. They suggest that at velocities around 80 m s−1, the choice of surface treatment for wettability becomes largely irrelevant to overall heat transfer performance. Instead, design considerations should focus on managing the extreme flow conditions, including factors such as pressure drop, structural integrity and optimising overall system geometry to handle the high-speed flow effectively.
The standard deviation of HTC (
 $\sigma _{htc}$
) at 80 m s−1 inlet velocity (shown in table 9) demonstrates significant variations across different contact angles (136.31–190.29 Wm
 $^2\cdot$
K−1). While hydrophilic surfaces (
 $0^\circ$
–
 $45^\circ$
,
 $\sigma _{htc} \approx$
147–190 Wm
 $^2\cdot$
K−1) and moderately hydrophobic surfaces (
 $60^\circ$
–
 $120^\circ$
,
 $\sigma _{htc} \approx$
163–174 Wm
 $^2\cdot$
K−1) show higher fluctuations, extremely hydrophobic surfaces (
 $135^\circ$
–
 $175^\circ$
,
 $\sigma _{htc} \approx$
136–153 Wm
 $^2\cdot$
K−1) exhibit relatively lower variations. The maximum fluctuation occurs at
 $15^\circ$
(190.29 Wm
 $^2\cdot$
K−1), while the minimum appears at
 $135^\circ$
(136.31 Wm
 $^2\cdot$
K−1). This pattern suggests that even at extremely high velocities, surface wettability continues to influence the stability of heat transfer performance, though the range of these fluctuations is more constrained compared with lower velocity regimes.
Standard deviation of HTC (
 $\sigma _{\textit{htc}}$
, unit: W m
 $^2\cdot$
K−1) for various contact angles at an inlet velocity of 80 m s−1.

Effect of contact angle on R134a (
 $p/p_c=0.25$
) condensation parameters at various inlet velocities with
 $Ja_v/$
pr
 $_v=0.076$
. (a) Heat transfer coefficient, (b) equivalent Reynolds number (Re
 $_{eq}$
) and (c) Nusselt number (
 $Nu$
) as functions of contact angle.

From figure 21 it is found that the HTC demonstrates a positive correlation with increasing vapour velocity. This enhancement in HTC can be attributed to the intensification of convective heat transfer mechanisms at higher velocities. Specifically, as the vapour velocity increases from 10 to 80 m s−1, there is a consistent upward trend in the HTC values, indicating more efficient heat transfer processes. The Nusselt number (
 $Nu$
) exhibits an increasing trend with rising vapour velocity, indicating enhanced convective heat transfer relative to conductive heat transfer. This correlation suggests that forced convection becomes increasingly dominant in the heat transfer process as vapour velocity increases. The equivalent Reynolds number (Re
 $_{eq}$
) distribution exhibits a remarkable phenomenon, with the maximum Re
 $_{eq}$
occurring at a vapour velocity of 20 m s−1. This behaviour can be attributed to the complex interaction between vapour flow and condensate formation. At an inflow vapour velocity of 20 m s−1, the flow conditions create an optimal environment for condensate formation, which subsequently leads to enhanced Re
 $_{eq}$
values. However, when the vapour velocity surpasses 20 m s−1, the condensation dynamics undergo a significant transition. The increased vapour shear forces prevent the liquid condensate from maintaining stable formation on the surface. Furthermore, at these elevated velocities (40 and 80 m s−1), the high-velocity vapour stream generates sufficient entrainment forces to effectively remove condensate droplets before they can accumulate on the surface. This mechanism of droplet removal and inhibited condensate formation ultimately results in reduced Re
 $_{eq}$
values at these higher vapour velocities, despite the increased flow rate. This observation underscores the critical balance between vapour velocity and condensate stability in determining the overall heat transfer characteristics of the system.
5. Conclusion
Using VOF-based CFD modelling, this study investigated the effects of surface wettability and inlet velocity on R134a (
 $p/p_c=0.25$
) condensation heat transfer in horizontal tubes. The findings reveal complex interdependencies between inlet velocity, surface wettability and condensation heat transfer mechanisms. At moderate inlet velocities (10 m s−1), surface wettability significantly influences condensation behaviour. The HTC exhibits a notable enhancement of
 $\gt$
19.1% between peak and minimum values, with optimal performance observed at contact angles between
 $120^\circ$
--
 $140^\circ$
. This enhancement stems from an optimal balance between condensate removal efficiency and effective thermal transport through the liquid phase. At higher velocities (20 m s−1), while surface wettability effects persist, their impact diminishes. The HTC shows an enhancement of
 $\gt$
11.7 % across different contact angles. Compared with the 10 m s−1 case, the maximum HTC demonstrates a substantial improvement of
 $\gt$
38.8 %, underscoring the significant role of convective heat transfer in the condensation process. At very high velocities (40 m s−1), the influence of surface wettability becomes less pronounced. The HTC variation reduces to
 $\gt$
1.04 % between peak and minimum values, suggesting that vapour shear forces begin to dominate over surface tension effects. The standard deviation of HTC (
 $\sigma _{htc}$
) shows a narrower range of fluctuations (76.59–125.49 Wm
 $^2\cdot$
K−1) compared with other velocities. At extreme velocities (80 m s−1), surface wettability effects become minimal, with the HTC showing only approximately equal to a 0.53 % variation across different contact angles. The key physical mechanisms governing these behaviours are as follows.
-
(i) The HTC demonstrates a positive correlation with increasing vapour velocity, highlighting the significant influence of flow rate on heat transfer performance. This is consistent with the previous work by Cheng (Reference Cheng, Wang, Sun, Ji, Wang, Chen, Xu and Chen2023). Within each velocity regime except at 80 m s−1, larger contact angles consistently lead to enhanced HTC values, indicating the beneficial effect of surface hydrophobicity; however, at the highest velocity of 80 m s−1, this contact angle dependency becomes negligible as the dominant vapour shear forces override the surface wettability effects.
-
(ii) The equivalent Reynolds number (Re
 $_{eq}$
) exhibits its peak value at a moderate vapour velocity of 20 m s−1, demonstrating an optimal condition for condensate formation and flow characteristics. This non-monotonic behaviour is attributed to the competing mechanisms between condensate formation at moderate velocities and condensate removal at higher velocities (40 and 80 m s−1), where increased vapour shear forces prevent stable liquid film formation and enhance droplet entrainment.
-
(iii) The Nusselt number demonstrates a general increasing trend with rising vapour velocity, indicating enhanced convective heat transfer at higher flow rates. However, within each specific velocity regime, the impact of contact angle on the Nusselt number varies distinctly, suggesting complex interactions between surface wettability and heat transfer mechanisms.
-
(iv) Superhydrophilic surfaces form thicker liquid films at low flow velocities, increasing thermal resistance and suppressing convection. Conversely, superhydrophobic surfaces facilitate phase change and convection under these conditions.

These insights provide valuable guidance for optimising condensation systems across different velocity regimes. They suggest that surface wettability modifications are most effective at moderate velocities, while at higher velocities, design focus should shift toward managing flow dynamics and system geometry. Future research directions should include the investigation of additional working fluids, exploration of different tube geometries and the examination of the limitations of marginal effects on heat transfer enhancement with increasing inlet velocity.
Acknowledgements
The authors are pleased to acknowledge the National Science and Technology Council of Taiwan, National Taipei University of Technology, Ministry of Education (MOE) in Taiwan, DELTA Inc., for their support to this research.
Funding
The authors are pleased to acknowledge the National Science and Technology Council of Taiwan (113-2221-E-027-075), National Taipei University of Technology, Ministry of Education (MOE) in Taiwan, DELTA Inc., for their financial support to this research.
Declaration of interests
The authors report no conflict of interest.
Author contributions
Bing-Kai: conceptualisation, investigation, data curation, validation, draft. Nai-Tsun Chang: data curation, visualisation. Hua-Yi, Hsu: conceptualisation, methodology, investigation, data curation, validation, funding acquisition, project administration, software, writing — draft, review, editing.
Data availability statement
The data that support the findings of this study are openly available.