





Introduction
The increasing awareness of animal welfare, environmental sustainability and food security has reshaped agricultural practices, emphasizing the need for ethical and sustainable protein sources. A significant challenge in this evolving landscape is food insecurity, exacerbated by the insufficient availability of plant-based proteins for livestock. Indeed, at the European level, only 37 % of these proteins are domestically sourced, making their importation necessary (European Commission - Directorate-General for Agriculture and Rural Development, 2024). Among the various imported products, soybean raises the greatest concern due to its high import rate (70 %) and the European Feed Manufacturers’ Federation (FEFAC) call for the use of ‘responsible soy’, provided from production sites adhering to strict sustainability guidelines (FEFAC, 2021). Additionally, under EU organic legislation, genetically modified organisms and products produced from or by GMOs are prohibited in organic production, which makes the sourcing of non-GM protein feed materials particularly relevant for organic supply chains (European Commission, 2018). Despite the difficulties, soy remains a major protein source for livestock farming (Parrini et al., Reference Parrini, Aquilani, Pugliese, Bozzi and Sirtori2023). Particularly for pig farming, soy constitutes a high-quality protein source for pigs, providing essential amino acids (EAAs) such as lysine, threonine and tryptophan, which are deficient in common cereal grains (Jezierny et al., Reference Jezierny, Mosenthin and Bauer2010). Although there has been a growing interest in recent years in reducing dietary crude protein levels in swine feed while supplementing with free amino acids (AAs), the overall demand for protein remains high (Rocha et al., Reference Rocha, Duarte and Kim2022). This dependency has contributed to what is known as the ‘protein gap’, with 70 % of animal feed proteins being imported (Fitches, Reference Fitches2016). Given these constraints, Europe is prioritizing research into alternative protein sources to reduce reliance on imported soybeans and enhance the sustainability of livestock farming (Gislon et al., Reference Gislon, Bava, Colombini, Zucali, Crovetto and Sandrucci2020). One promising approach involves incorporating self-produced high-protein ingredients, such as legumes, into livestock diets (Ghidoli et al., Reference Ghidoli, Frazzini, De Benedetti, Sangiorgio, Landoni, Scarafoni, Rossi and Pilu2023; Tabacco et al., Reference Tabacco, Comino and Borreani2018). Cultivating legumes in rotation with grain crops offers multiple environmental benefits. These include a reduced reliance on nitrogen fertilizers due to their nitrogen-fixing ability, disruption of pest and pathogen life cycles and increased soil organic carbon levels (Kebede, Reference Kebede2021; Nemecek et al., Reference Nemecek, Von Richthofen, Dubois, Casta, Charles and Pahl2008; Stagnari et al., Reference Stagnari, Maggio, Galieni and Pisante2017). Among grain legumes, L. albus is of particular interest due to its high crude protein content, favourable AA composition and adaptability to marginal soils and low-input agricultural systems (Patterson, Reference Patterson2000). White lupin seeds typically contain high levels of protein (300–400 g/kg dry matter) and energy (3700 Kcal/kg), with lower requirements for external inputs compared with other leguminous crops such as peas (Pisum sativum) and faba beans (Vicia faba) (Crépon et al., Reference Crépon, Marget, Peyronnet, Carrouée, Arese and Duc2010; Voisin et al., Reference Voisin, Guéguen, Huyghe, Jeuffroy, Magrini, Meynard, Mougel, Pellerin and Pelzer2014). Moreover, lupin cultivation is well suited to Mediterranean environments and organic farming systems, where crop rotation options and protein self-sufficiency are often limited (Voisin et al., Reference Voisin, Guéguen, Huyghe, Jeuffroy, Magrini, Meynard, Mougel, Pellerin and Pelzer2014). In addition to the need to find alternative sources of protein, animal nutrition currently focuses on ingredients that not only meet animals’ nutritional requirements but also promote their overall health (Frazzini et al., Reference Frazzini, Reggi, Dell’Anno, Fifi, Scaglia, Ferri and Rossi2024). In pig farming, during the weaning transition, piglets experience significant microbial imbalances in the gut, known as dysbiosis. This condition is characterized by a reduction in beneficial anaerobic bacteria (such as Clostridia and Bacteroidia) and an increase in facultative anaerobes (such as Enterobacteriaceae) (Guevarra et al., Reference Guevarra, Lee, Lee, Seok, Kim, Kang, Johnson, Isaacson and Kim2019). Diet-induced dysbiosis may be a key factor predisposing animals to post-weaning diarrhoea and the occurrence of enteric infections. So, providing highly digestible and nutritionally rich diets during this period is essential to support their growth and health (Dell’Anno et al., Reference Dell’Anno, Frazzini, Reggi, Ferri, Scaglia, Schiasselloni, Inglesi, Riva, Verdile, Pasquariello and Rossi2024). Although lupin seeds have been used in pig nutrition for decades (Pearson and Carr, Reference Pearson and Carr1976), information regarding their effects on gut microbiota composition and nutrient utilization in weaned piglets remains limited, particularly when compared with other commonly used legume protein sources (Schutkowski et al., Reference Schutkowski, König, Kluge, Hirche, Henze, Schwerdtle, Lorkowski, Dawczynski, Gabel, Große and Stangl2019). This lack of data is especially relevant given the physiological immaturity of the digestive system in young piglets, which may influence their ability to efficiently utilize lupin-based diets (Salgado et al., Reference Salgado, Freire, Mourato, Cabral, Toullec and Lallès2002). Beyond nutritional benefits, integrating lupin into livestock feed could provide farmers, particularly those who use strategies focused on avoiding the use of genetically modified organisms in food and feed (GM-free strategies), with a sustainable and economically viable protein source (Abraham et al., Reference Abraham, Ganopoulos, Madesis, Mavromatis, Mylona, Nianiou-Obeidat, Parissi, Polidoros, Tani and Vlachostergios2019). By investigating the impact of lupin-based diets on gut microbiota and nutrient absorption, this study contributes to a better understanding of how established feed ingredients such as lupin can be strategically used to support animal health and sustainable livestock production. Therefore, the aim of this study was to evaluate the effects of replacing soybean meal with L. albus in the diets of weaned piglets on faecal microbiota composition, nutrient digestibility, growth performance and selected blood parameters.
Materials and methods
Chemical composition of L. albus
The bromatological characterization of L. albus Tennis variety was carried out according to the ‘Official Methods of Analysis’ (AOAC, 2023) and was used to describe the nutritional profile of the experimental ingredient in order to include it in the experimental diet. Trypsin inhibitor activity was measured according to ISO 14902, with slight modifications (ISO Standard 14902, 2017). Each experiment was performed in duplicate.
Animal, housing, experimental design and diet formulation
The experimental trial was approved by the Animal Welfare Organization of the University of Milan (OPBA authorization n° 4_2023) in accordance with European regulations (Dir. EU 2010/63). The trial was conducted on a commercial farm, enrolling 20 weaned piglets (Landrace x Large White; 28 ± 2 days). The number of animals was calculated a priori using GPower Software considering gut microbiota modulation as the primary outcome of the study, assuming a significance level (α) of 0.05 and a statistical power of 80 %. The sample size definition considered two experimental groups, three repeated measurements, a correlation among repeated measures of 0.5, and a nonsphericity correction ϵ = 1. Under these assumptions, the estimated sample size provided adequate statistical power to detect an effect size of Cohen’s f = 0.35.
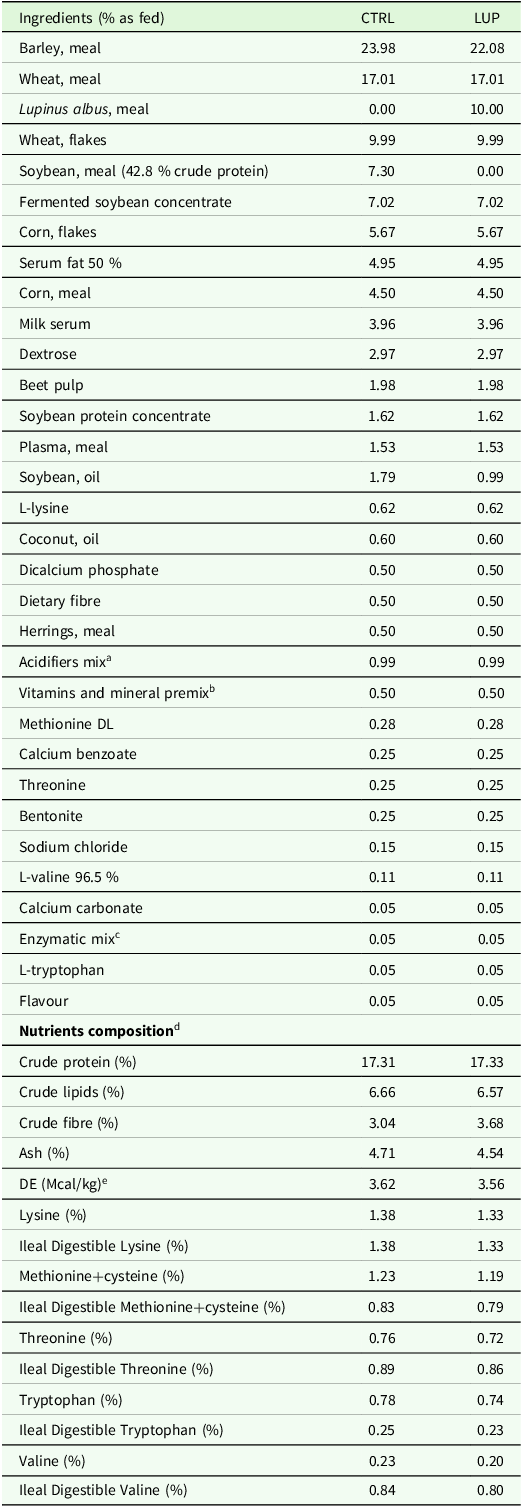
The animals, individually identified using the ear tag, were assigned to two experimental groups (10 piglets/group) according to a stratified randomized design, with animals stratified by initial body weight (control: 10.11 ± 1.56 kg; treatment: 10.01 ± 2.16 kg) and sex, with an equal proportion of males and females in each group. Piglets were housed under standardized environmental conditions (27 °C and 60 % relative humidity) for 28 days. After a one-week adaptation period during which all piglets received the same commercial basal diet, the animals were fed with two experimental isonitrogenous and isoenergetic diets for the remainder of the trial. The diets were formulated using Plurimix System® software (version 2.4; Fabermatica, Cremona, Italy) to meet the nutritional requirements of weaned piglets (Table 1) (National Research Council, 2012) and were produced by Ferraroni S.p.A. (Bonemerse, Italy). Throughout the experimental period, feed was provided ad libitum and supplied in meal form. Particularly, a complementary feed, constituting 90 % of the diet, was supplemented with 10 % of L. albus seed meal for the treatment diet (LUP) and with a 10 % premix (composition of final formula: 1.9 % of barley meal, 7.3 % of soybean meal and 0.8 % of soybean oil) for the control (CTRL). The produced experimental diets were analysed in triplicate in terms of principal nutrients: DM, EE, CP, CF and ash content (AOAC, 2023). The dietary inclusion level of L. albus was selected based on nutritional and practical criteria and is consistent with inclusion ranges previously reported in the literature (Ciurescu et al., Reference Ciurescu, Dumitru, Lefter and Râmbu2025).
Experimental diet composition and principal chemical characteristics (%as fed basis) divided by control (CTRL) and treatment group (LUP)

Table 1. Long description
A table comparing the composition and principal chemical characteristics of experimental diets for control (CTRL) and treatment (LUP) groups of piglets. The table has 38 rows and 3 columns. The columns are labeled ‘Ingredients (% as fed)’, ‘CTRL’, and ‘LUP’. The rows list various ingredients and their percentages in the diets, followed by the nutrients composition. Row 1: Barley, meal, 23.98, 22.08. Row 2: Wheat, meal, 17.01, 17.01. Row 3: Lupinus albus, meal, 0.00, 10.00. Row 4: Wheat, flakes, 9.99, 9.99. Row 5: Soybean, meal (42.8 % crude protein), 7.30, 0.00. Row 6: Fermented soybean concentrate, 7.02, 7.02. Row 7: Corn, flakes, 5.67, 5.67. Row 8: Serum fat 50 %, 4.95, 4.95. Row 9: Corn, meal, 4.50, 4.50. Row 10: Milk serum, 3.96, 3.96. Row 11: Dextrose, 2.97, 2.97. Row 12: Beet pulp, 1.98, 1.98. Row 13: Soybean protein concentrate, 1.62, 1.62. Row 14: Plasma, meal, 1.53, 1.53. Row 15: Soybean, oil, 1.79, 0.99. Row 16: L-lysine, 0.62, 0.62. Row 17: Coconut, oil, 0.60, 0.60. Row 18: Dicalcium phosphate, 0.50, 0.50. Row 19: Dietary fibre, 0.50, 0.50. Row 20: Herrings, meal, 0.50, 0.50. Row 21: Acidifiers mix, 0.39, 0.39. Row 22: Vitamins and mineral premix, 0.50, 0.50. Row 23: Methionine DL, 0.28, 0.28. Row 24: Calcium benzoate, 0.25, 0.25. Row 25: Threonine, 0.25, 0.25. Row 26: Bentonite, 0.25, 0.25. Row 27: Sodium chloride, 0.15, 0.15. Row 28: L-valine 96.5 %, 0.11, 0.11. Row 29: Calcium carbonate, 0.05, 0.05. Row 30: Enzymatic mix, 0.05, 0.05. Row 31: L-tryptophan, 0.05, 0.05. Row 32: Flavour, 0.05, 0.05. Row 33: Crude protein (%), 17.31, 17.33. Row 34: Crude lipids (%), 6.66, 6.57. Row 35: Crude fibre (%), 3.04, 3.68. Row 36: Ash (%), 4.71, 4.54. Row 37: DE (Mc/Kg), 3.62, 3.56. Row 38: Lysine (%), 1.38, 1.33.
a Composition of acidifiers mix: E 330 Citric acid (1a) 0,17 mg, 1a238 Calcium formate 89,60 mg, E 321 Butylhydroxytoluene (BHT) 0,34 mg, E 310 Propyl gallate 0,17 mg, 1m558i Bentonite. 2,02 mg, E 562 Sepiolite 645,68 mg, 1m558 Bentonite 2.744,00 mg.
b Composition of vitamins and mineral premix: 3a672a Vitamin A (Retinyl acetate) 16.000,00 UI, 3a671 Vitamin D3 (Cholecalciferol) 2.000,00 UI, 3a925 Betaine hydrochloride 1.120,00 mg, 3a880 Biotin 0,22 mg, 3a890 Choline chloride 336,00 mg, 3a316 Folic acid 1,12 mg, 3a315 Ni-acinamide 33,60 mg, 3a841 Calcium D-pantothenate 16,80 mg, 3a821 Vitamin B1 (Thiamine mononitrate) 2,24 mg, Vitamin B12 (Cyanocobalamin) 0,03 mg, 3a825i Vitamin B2 (Riboflavin) 5,60 mg, 3a831 Vitamin B6 (Pyridoxine hydrochloride) 3,92 mg, 3a312 Vitamin C (Sodium calcium ascorbyl phosphate) 168,00 mg, 3a700 Vitamin E (All-rac-alpha-tocopheryl acetate) 134,40 mg, 3a711 Vitamin K3 (Menadione nicotinamide bisulphite) 2,24 mg, 3b412 Copper (Copper oxide-I) 100,00 mg, 3b202 Iodine (Calcium iodate anhydrous) 1,12 mg, 3b103 Iron (Iron sulphate-II monohydrate) 134,40 mg, 3b502 Manganese (Manganese oxide-II) 56,00 mg, 3b801 Selenium (Sodium selenite) 0,39 mg, 3b603 Zinc (Zinc oxide) 112,00 mg, 3c322 L-lysine monohydrochloride, technically pure 5.382,00 mg, 3c410 L-threonine 2.758,00 mg, 3c440 L-tryptophan 480,00 mg.
c Composition of enzymatic mix: 4a24 6-phytase EC 3.1.3.26 (Solid form) 2.016,00 FTU, 4a1604i Endo1,3(4)-beta-glucanase EC 3.2.1.6 1.650,00 UV, 4a1604i Endo-1,4-beta-xylanase EC 3.2.1.8 1.210,00 UV, 4d210 Benzoic acid 1.380,40 mg.
d The calculation was performed with Plurimix System® software (Fabermatica, Cremona, Italy) and values are presented as fed basis.
e DE: digestible energy content estimated from NRC (2012).
Growth performance, diarrhoea incidence and sampling procedures
Body weight (BW) was recorded individually on the following days: 0 (T0), 7 (T1), 14 (T2), 21 (T3) and 28 (T4). Each pen’s feed intake was recorded by measuring the feed refused once a week. The average daily gain (ADG) was calculated based on individual BWs recorded over time. Individual faecal samples from the rectal ampulla were collected from each piglet at T0, T1, T2, T3 and T4 and stored at −20 °C for further analysis. Rectal swabs collected from each piglet at T0, T2 and T4 were stored at −80 °C until the microbiota analysis. The faecal consistency of each pig was scored during the faecal sampling procedure using a four-level scale: 0 = normal consistency (faeces firm and well-formed); 1 = soft consistency (faeces soft and formed); 2 = mild diarrhoea (fluid faeces, usually yellowish); 3 = severe diarrhoea (faeces watery and projectile) (Rossi et al., Reference Rossi, Dell’Anno, Turin, Reggi, Lombardi, Alborali, Filipe, Riva, Riccaboni, Scanziani, Dall’Ara, Demartini and Baldi2023). A faecal consistency score ≤ 1 (0,1) was considered normal, whereas a faecal score > 1 (2,3) was defined as diarrhoea. According to the regular veterinarian practice, blood was collected at T0 and T4 from the jugular vein using vacuum tubes without anticoagulants to assess the metabolic parameters of the animals.
Diet digestibility and mineral content of faecal samples
Faeces collected during the trial were analysed for the content of DM and nitrogen according to AOAC method 930.15 and AOAC method 2001.11, respectively. The nitrogen apparent digestibility was assessed through the acid-insoluble ash marker (Sales and Janssens, Reference Sales and Janssens2003) and calculated according to the following equation:
 $\begin{align*}&{Apparent}\ {Nutrient}\ {Digestibility}\ \left({\rm \% }\right) \\ &\,\,\,\,\,\,=100\times \left(1- {AIA\ in\ feed\ \over AIA\ in\ {faeces}}\times \ {{nutrient}\ in\ {faeces} \over {nutrient}\ in\ feed}\right)\end{align*}$
For the mineral content determination, 100 mg of dried faecal samples were digested in 10 mL of 65 % nitric acid in Teflon tubes and heated at a one-step temperature ramp (120 °C in 10 min and maintained for 10 min). After mineralization, samples were analysed through inductively coupled plasma mass spectrometry (Aurora-M90 ICP-MS, Bruker Corporation, Germany). Calibration curves were obtained for Na, Mg, Al, P, K, Ca, Cr, Mn, Fe, Co, Ni, Cu, Zn, As, Se, Mo, Cd, Tl, Pb and samples were diluted 1:100 (w/v) in 0.3 M nitric acid. The check of nebulization performance was performed adding an aliquot of 2 mg/L of a standard solution (72Ge, 89Y, 159Tb) to the samples up to reach a final concentration of 20 μg/L. To remove the polyatomic interference a collision-reaction interface with an H2 flow of 80 mL/min through a skimmer cone was used (Giupponi et al., Reference Giupponi, Leoni, Colombo, Cassani, Hejna, Rossi and Pilu2021).
DNA extraction from swabs and generation of 16S rRNA gene data
According to the manufacturer’s protocol, DNA was extracted from each rectal swab using the QIAamp PowerFaecal Pro DNA kit (Qiagen, Hilden, Germany), and quality (260/280 ratio of ∼1.8) and quantity were assessed using a NanoDrop ND-1000 spectrophotometer (NanoDrop Technologies, Wilmington, DE, USA). The isolated DNA was then stored at −20 °C until use. PCR amplification was performed using the Applied Biosystem 2700 thermal cycler (ThermoFisher Scientific) using specific primers (forward: CCTACGGGNGGCWGCAG; reverse: GACTACHVGGGTATCTAATCC) for targeting the V3-V4 hypervariable regions of the 16S rRNA gene, according to Caporaso and colleagues (Reference Caporaso, Lauber, Walters, Berg-Lyons, Lozupone, Turnbaugh, Fierer and Knight2011). Samples were amplified following the condition described in the previous study (Frazzini et al., Reference Frazzini, Cremonesi, Scaglia, Castiglioni, Biscarini, Besana and Rossi2023). Amplicons were cleaned with Agencourt AMPure XP (Beckman, Coulter Brea, CA, USA), and libraries were prepared following the 16S Metagenomic Sequencing Library Preparation Protocol (Illumina, San Diego, CA, USA).
Demultiplexed paired-end reads from 16S rRNA-gene sequencing were first checked for quality using FastQC (Andrews, Reference Andrews2010). Reads were then cleaned by removing primers and adapters with the Python tool Cutadapt (Martin, Reference Martin2011), and by trimming for quality using the C++ tool Sickle (Joshi and Fass, Reference Joshi and Fass2011), with Phred threshold >20 (i.e., the end part of the reads was removed if its quality deteriorated). After cleaning, forward and reverse paired-end reads were joined together using the Python pipeline Micca (Microbial Community Analysis), specifically the function ‘merge pairs’ with default values (i.e., minimum overlap length = 32, the maximum number of mismatches in the overlap region = 8). Assembled reads were filtered for quality, discarding reads with missing/uncalled bases or with an expected error rate larger than 1 % (1 error in 100 bases). All remaining reads were used to identify amplicon sequence variants (ASV) with the denoising approach (Rosen et al., Reference Rosen, Callahan, Fisher and Holmes2012) implemented in the Micca function ‘otu’ (method ‘denovo_unoise’). Finally, the identified OTUs were classified using the Micca function ‘classify’ to assign taxa as annotated in the 16S rRNA database of Ribosomal Database Project (Wang et al., Reference Wang, Garrity, Tiedje and Cole2007): the minimum confidence value to assign taxonomy to a sequence was 0.8. ASV with fewer than 15 counts in less than 3 samples have been filtered out of the ASV table. Microbial richness, diversity and evenness within samples were estimated using the following indices: Chao1 and ACE for richness; Shannon, Simpson and Fisher alpha for diversity; and Simpson E and Pielou J (Shannon evenness) for evenness. Among-sample diversity was quantified using the Bray-Curtis index. Before calculating the Bray-Curtis index, OTU counts were normalized for nonuniform sequencing depth using cumulative sum scaling.
Blood serum analyses of serum metabolites and mineral levels
The blood samples collected were centrifuged at 3000 rpm for 15 minutes at 4 °C, and the serum was collected. The serum was then analysed by the Istituto Zooprofilattico Sperimentale della Lombardia ed Emilia Romagna (IZSLER, Brescia, Italy), using a multiparametric autoanalyser for clinical chemistry (ILab 650; Instrumentation Laboratory Company, Lexington, MA, USA). The parameters taken into account were: calcium (mmol/L), aspartate aminotransferase (AST-GOT; IU/L); alanine aminotransferase (ALT-GPT; IU/L), total protein (g/L), albumin (g/L), globulin (g/L), albumin/globulin (A/G ratio), urea (mmol/L), glucose (mmol/L), total bilirubin (µmol/L), total cholesterol (mmol/L), phosphorus (mmol/L) and magnesium (mmol/L), alkaline phosphatase (IU/L).
The analyses for the detection of mineral content in blood serum were performed according to the methodology described by Laur et al. (Reference Laur, Kinscherf, Pomytkin, Kaiser, Knes and Deigner2020), for comparative analysis of the trace element concentrations of Na, K, Al, P, Se, Cu, Mn, Ca, Fe, Mg, Co, Mo, Cd, Pb, Zn, Cr, Ni. An Agilent 7900 ICP-MS (Agilent Technologies, Tokyo, Japan) equipped with standard nickel cones, connected to a SPS 4 Autosampler (Agilent Technologies, Tokyo, Japan) was used for all measurements. All measurements were performed in triplicates from each vial (Laur et al., Reference Laur, Kinscherf, Pomytkin, Kaiser, Knes and Deigner2020).
Statistical analysis
Data analysis was performed with GraphPad Prism software (version 9.00). The normality of data distribution was tested using the Shapiro–Wilk test, and homoscedasticity was verified with Bartlett’s test. Individual (BW, ADG) and faecal score data were analysed using a full factorial model. The model included fixed effects for treatment, time and their interaction (Treatment: Trt, Time: Time, Interaction: Trt * Time). Additionally, the subject was considered a random factor, and the fixed effect of sex was initially included but removed due to its lack of significance in reducing degrees of freedom. Average daily feed intake (ADFI) and gain to feed ratio (G:F) were calculated at the pen level, as piglets were group-housed (one pen per treatment). Therefore, these parameters are reported as descriptive values only, and no statistical analysis of treatment effects was performed, as the pen was the experimental unit. Covariate matrix of protein digestibility, serum metabolites, serum and faecal minerals was used for the mixed procedure of SAS software in order to correct for the initial variability. Treatment effects were subsequently evaluated at the different experimental time points, with all comparisons adjusted for baseline values. Multiple comparisons among groups at each time-point were evaluated by performing Tukey’s Honest Significance Difference test (Tukey’s HSD) or Šidák’s correction for reducing the probability of increasing alpha error due to multiple comparisons over time. For the gut microbiota, a linear model was used to analyse the differences between groups in terms of alpha diversity indices, including the fixed effect of time, treatment and their interaction; the single pig was considered as the experimental unit and included as a random effect. Specifically, differences between treatments in terms of alpha diversity indices and ASV abundance were assessed using a within-timepoint linear model: y ij = µ + T j + e ij, where y ij represents the alpha diversity index value or the normalized ASV count of the i-th sample in the j-th treatment group; μ is the overall mean; T j is the fixed effect of treatment (CTRL or treated group); and e ij is the random residual error term. Beta diversity was evaluated using the Bray-Curtis dissimilarity matrix. Principal coordinate analysis based on Bray–Curtis distances was performed to visualize differences in microbial community structure between treatments and timepoints. Subsequently, pairwise comparisons between groups were statistically assessed using permutational multivariate analysis of variance (PERMANOVA), non-parametrically performed with the adonis function from the vegan package in R (Oksanen et al., Reference Oksanen, Blanchet, Friendly, Kindt, Legendre, Mcglinn, Minchin, O’hara, Simpson, Solymos, Stevens, Szoecs and Wagner2020). The data were considered statistically different for p < 0.05. Results are presented as means ± standard error or standard deviation.
Results
Chemical composition of lupins and experimental diets
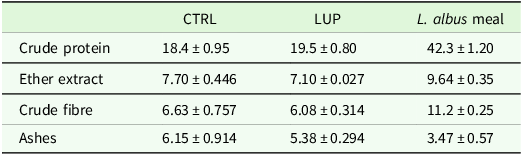
The chemical composition of L. albus Tennis variety seeds disclosed a content of: 8.90 ± 0.8 % of moisture, 42.30 ± 1.2 % of CP; 11.18 ± 0.25 % of CF; 9.64 ± 0.35 % of EE; 3.47 ± 0.57 % of ashes; 2.30 ± 0.3 % of starch on dry matter basis (Table 2). TIA assay showed an inhibition capacity of 2.10 ± 1.1 %. The inclusion of 10 % L. albus seed meal as a replacement for soybean meal resulted in only minor changes in the overall nutrient composition of the experimental diets, which remained isoenergetic and isonitrogenous and met the nutritional requirements of the animals (Table 2).
Analysed nutrient profile of the experimental diets and L. albus used in this trial administered to control (CTRL) and lupin (LUP) groups (% as dry matter basis)

Table 2. Long description
A table comparing nutrient profiles of control (CTRL), lupin (LUP), and L. albus meal diets. The table has four rows and four columns. Column headers are CTRL, LUP, and L. albus meal. Row labels are Crude protein, Ether extract, Crude fibre, and Ashes. Row 1: Crude protein, CTRL 18.4 ± 0.95, LUP 19.5 ± 0.80, L. albus meal 42.3 ± 1.20. Row 2: Ether extract, CTRL 7.70 ± 0.446, LUP 7.10 ± 0.027, L. albus meal 9.64 ± 0.35. Row 3: Crude fibre, CTRL 6.63 ± 0.757, LUP 6.08 ± 0.314, L. albus meal 11.2 ± 0.25. Row 4: Ashes, CTRL 6.15 ± 0.914, LUP 5.38 ± 0.294, L. albus meal 3.47 ± 0.57.
Data are shown as means ± standard error.
Growth performance
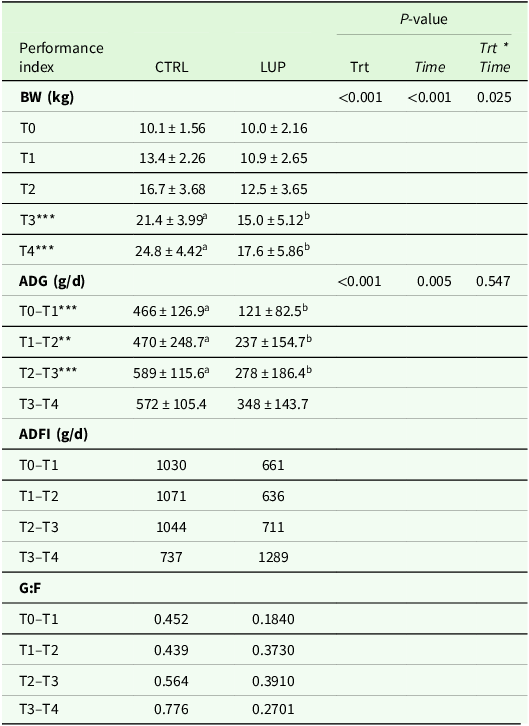
Piglets’ growth registered significant differences from 21 to 28 days of trial between the experimental groups (p < 0.05). In particular, the LUP group showed a lower BW at T3 and T4 than the CTRL group (p < 0.001; Table 3). Accordingly, ADG showed a higher value in CTRL compared to the LUP group during the entire trial period (p < 0.001). Lupin inclusion was associated with a lower ADFI in the LUP group during the first part of the experimental period compared with the CTRL group. However, feed intake in the LUP group progressively increased over time, reaching higher numerical values than the CTRL group during the final experimental interval. Similarly, the gain:feed ratio (G:F) was numerically lower in the LUP group compared with the CTRL group throughout the experimental period.
Zootechnical performances of control (CTRL) and lupin (LUP) groups during the trial

Table 3. Long description
A table comparing zootechnical performances of control (CTRL) and lupin (LUP) groups during a trial. The table has 12 rows and 7 columns. Column headers are Performance index, CTRL, LUP, Trt, Time, Trt * Time. Row labels include BW (kg), ADG (g/d), ADFI (g/d), and G:F. P-values are provided for Trt, Time, and Trt * Time. Data points include BW measurements at different time points (T0, T1, T2, T3, T4), ADG values for different intervals (T0-T1, T1-T2, T2-T3, T3-T4), ADFI values for the same intervals, and G:F ratios for the same intervals. Notable trends include significant differences in BW and ADG between CTRL and LUP groups, with the LUP group showing lower BW at T3 and T4 and lower ADG throughout the trial. ADFI and G:F ratios also show variations between the groups.
BW: body weight; ADG: average daily gain; ADFI: average daily feed intake; G:F: gain-feed ratio; T0, T1, T2, T3 and T4 indicate sampling times corresponding to days 0, 7, 14, 21 and 28 of the trial, respectively; Trt: Treatment. Data are shown as means ± standard error. Asterisks indicates significant differences: **P-value < 0.01; ***P-value < 0.001. Means with different lowercase letters (a, b) differ significantly.
Faecal score and faecal dry matter
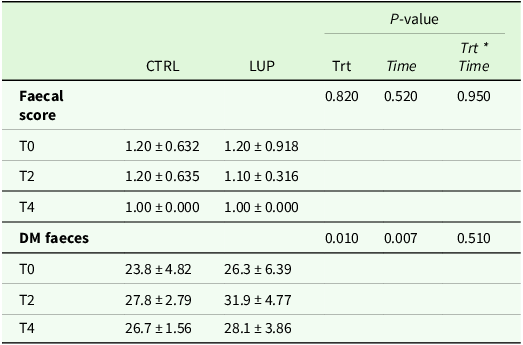
Considering the evaluation of the average faecal score between the two groups, no differences were observed during the entire trial, indicating a faecal consistency profile that falls within the physiological range in both CTRL and LUP groups. In accordance with the faecal score assessment, faecal dry matter was not affected by dietary treatment throughout the experimental period (Table 4).
Faecal score and faeces dry matter of control (CTRL) and lupin (LUP) groups during the trial

Table 4. Long description
Panel A: The table shows faecal scores for control (CTRL) and lupin (LUP) groups at three time points (T0, T2, T4). The P-values for treatment (Trt), time (Time), and their interaction (Trt * Time) are provided. Panel B: The table displays dry matter (DM) in faeces for CTRL and LUP groups at the same time points, with corresponding P-values for Trt, Time, and Trt * Time.
T0, T2 and T4 indicate sampling times corresponding to days 0, 14 and 28 of the trial, respectively; Trt: Treatment. Data are shown as means ± standard error.
Protein digestibility, faecal nitrogen and mineral content
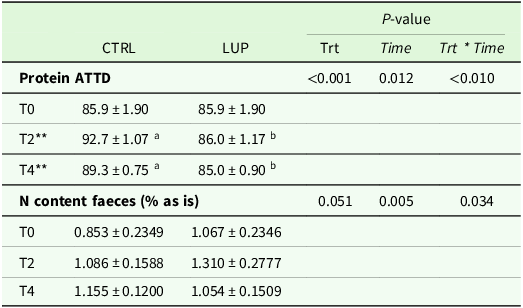
No differences in protein ATTD were observed between the CTRL and LUP groups at baseline (T0). However, from T2 onward, protein digestibility increased in the CTRL group, while it remained relatively unchanged in the LUP group, resulting in significantly higher ATTD values in CTRL at both T2 and T4 (P < 0.01). Faecal nitrogen content was not significantly affected by dietary treatment throughout the experimental period (Table 5).
Protein digestibility and nitrogen content during the trial in control (CTRL) and lupin (LUP) groups

Table 5. Long description
The table presents data on protein ATTD and nitrogen content in faeces for control (CTRL) and lupin (LUP) groups at different time points (T0, T2, T4). It includes P-values for different comparisons: CTRL vs. LUP, treatment (Trt), time, and the interaction between treatment and time (Trt * Time). For protein ATTD, values are provided for T0, T2, and T4, with notable increases in the CTRL group from T2 onwards. For nitrogen content in faeces, values are given for T0, T2, and T4, showing no significant changes due to dietary treatment. The table has 8 rows and 6 columns, with column headers including CTRL, LUP, Trt, Time, and Trt * Time, and row labels including Protein ATTD and N content faeces (% as is).
ATTD: Apparent total tract digestibility; N: Nitrogen; T0, T2 and T4 indicate sampling times corresponding to days 0, 14 and 28 of the trial, respectively; Trt: Treatment.
Data are shown as means ± standard error. Asterisks indicates significant differences: **p-value < 0.01. Means with different lowercase letters (a, b) differ significantly.
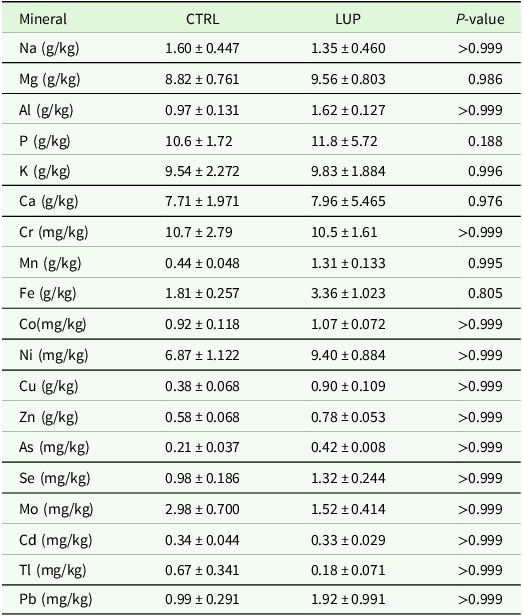
Quantitative analysis of the mineral content in faecal samples, performed after 28 days of intervention, showed no statistically significant differences between experimental groups (P > 0.05), as detailed in Table 6.
The mineral content of faecal samples of control (CTRL) and lupin (LUP) groups at T4 (28 days) expressed as g/kg of dry matter

Table 6. Long description
A table comparing the mineral content of faecal samples between control (CTRL) and lupin (LUP) groups after 28 days. The table has 21 rows and 4 columns. Column headers are Mineral, CTRL, LUP, and P-value. Row labels list different minerals and their units. Row 1: Mineral, Na (g/kg), CTRL 1.60 ± 0.447, LUP 1.35 ± 0.460, P-value >0.999. Row 2: Mineral, Mg (g/kg), CTRL 8.82 ± 0.761, LUP 9.56 ± 0.803, P-value 0.986. Row 3: Mineral, Al (g/kg), CTRL 0.97 ± 0.131, LUP 1.62 ± 0.127, P-value >0.999. Row 4: Mineral, P (g/kg), CTRL 10.6 ± 1.72, LUP 11.8 ± 5.72, P-value 0.188. Row 5: Mineral, K (g/kg), CTRL 9.54 ± 2.272, LUP 9.83 ± 1.884, P-value 0.996. Row 6: Mineral, Ca (g/kg), CTRL 7.71 ± 1.971, LUP 7.96 ± 5.465, P-value 0.976. Row 7: Mineral, Cr (mg/kg), CTRL 10.7 ± 2.79, LUP 10.5 ± 1.61, P-value >0.999. Row 8: Mineral, Mn (g/kg), CTRL 0.44 ± 0.048, LUP 1.31 ± 0.133, P-value 0.995. Row 9: Mineral, Fe (g/kg), CTRL 1.81 ± 0.257, LUP 3.36 ± 1.023, P-value 0.805. Row 10: Mineral, Co (mg/kg), CTRL 0.92 ± 0.118, LUP 1.07 ± 0.072, P-value >0.999. Row 11: Mineral, Ni (mg/kg), CTRL 6.87 ± 1.122, LUP 9.40 ± 0.884, P-value >0.999. Row 12: Mineral, Cu (g/kg), CTRL 0.38 ± 0.068, LUP 0.90 ± 0.109, P-value >0.999. Row 13: Mineral, Zn (g/kg), CTRL 0.58 ± 0.068, LUP 0.78 ± 0.053, P-value >0.999. Row 14: Mineral, As (mg/kg), CTRL 0.21 ± 0.037, LUP 0.42 ± 0.008, P-value >0.999. Row 15: Mineral, Se (mg/kg), CTRL 0.98 ± 0.186, LUP 1.32 ± 0.244, P-value >0.999. Row 16: Mineral, Mo (mg/kg), CTRL 2.98 ± 0.700, LUP 1.52 ± 0.414, P-value >0.999. Row 17: Mineral, Cd (mg/kg), CTRL 0.34 ± 0.044, LUP 0.33 ± 0.029, P-value >0.999. Row 18: Mineral, Tl (mg/kg), CTRL 0.67 ± 0.341, LUP 0.18 ± 0.071, P-value >0.999. Row 19: Mineral, Pb (mg/kg), CTRL 0.99 ± 0.291, LUP 1.92 ± 0.991, P-value >0.999.
Data are shown as means ± standard error.
Gut microbiota analysis
The alpha diversity analysis revealed no differences in the gut microbiota of the two experimental groups during the trial (Figure S1). Beta diversity analysis showed significant effects of both treatment and sampling time (PERMANOVA). An overall separation between CTRL and LUP groups was observed (P < 0.01; Figure 1). A difference between groups was already detectable at baseline (T0; P = 0.020), reflecting initial inter-individual microbiota variability rather than a treatment effect. Over time, microbial community structure significantly diverged between groups at T2 (P = 0.019) and T4 (P = 0.001), indicating a diet-associated modulation of microbiota trajectories. Regarding the taxonomic analyses, at the phylum level, in both groups, most of the reads belonged to Firmicutes, accounting for 59.7 % of the average microbial composition, followed by Bacteroidota and Proteobacteria (Figure 2). Moreover, taxonomic analysis revealed a shift in the composition of the microbial population over the course of the trial. Specifically, several genera belonging to the families Prevotellaceae, Lachnospiraceae, Lactobacillaceae, Ruminococcaceae, Veillonellaceae, Erysipelotrichaceae, Methanobacteriaceae, Clostridiaceae, Porphyromonadaceae, Enterobacteriaceae, Spirochaetaceae and Bacteroidaceae showed statistically significant differences between the LUP group and the CTRL group at both T2 and T4 (P < 0.05).
Principal coordinate analysis (PCoA) based on Bray-Curtis dissimilarity distances of microbiota data for the CTRL and LUP groups at T0 (0 days) (a), T2 (14 days) (b) and T4 (28 days) (c). Each point represents one animal (n = 10 pigs per group at each time point). PERMANOVA analysis interaction time × treatment. a: P = 0.0300, R 2 = 0.1031; b: P = 0.0020, R 2 = 0.1425; c: P = 0.0010, R 2 = 0.1348.

Relative abundance (%) of bacterial phyla detected in the gut microbiota of piglets belonging to the CTRL and LUP groups at T0 (0 days), T2 (14 days) and T4 (28 days). Data are presented as mean relative abundances for each experimental group (n = 10 pigs per group at each time point). This figure provides a qualitative and descriptive overview of the phylum-level microbial composition over time. Phyla are colour-coded according to the legend.

Figure 2. Long description
Panel A: At T0, the pie charts for CTRL and LUP groups show the relative abundance of bacterial phyla. The largest segment is purple, representing Firmicutes, followed by a blue segment for Bacteroidetes. Other phyla include Actinobacteria, Candidatus Saccharibacteria, Chlamydiae, Cyanobacteria/Chloroplast, Deferribacteres, Elusimicrobia, Euryarchaeota, Fibrobacteres, Fusobacteria, Lentisphaerae, Planctomycetes, Proteobacteria, Spirochaetes, Synergistetes, Tenericutes, and Verrucomicrobia. Panel B: At T2, the distribution remains similar with Firmicutes being the most abundant. Panel C: At T4, the pattern is consistent with previous time points, with Firmicutes still dominating.
Among these, some genera were significantly different at both time points. In particular, Veillonella, Turicibacter, Romboutsia, Methanobrevibacter, Cloacibacillus and Aerococcus showed an increased relative abundance at T2 and T4, whereas Clostridium XVIII and Bifidobacterium decreased over time (P < 0.05).
Other genera displayed significant differences at only one time point: Succinivibrio, Streptococcus, Salmonella, Pasteurella, Fusobacterium, Clostridium sensu stricto, Butyrivibrio, Butyricicoccus and Bacteroides differed only at T2 (P < 0.05); while Escherichia/Shigella, Dorea,Anaerovibrio and Allobaculum showed a significant difference only at the end of the trial (T4) (P < 0.05) (Figure 3 ).
Bacterial genera showing statistically significant differences in relative abundance between the CTRL and LUP groups at T0 (0 days), T2 (14 days) and T4 (28 days). Analyses were performed on normalized amplicon sequence variant (ASV) counts using a within-timepoint linear model, with treatment as fixed effect. Each comparison was conducted independently at each sampling time point. Piglets were considered the experimental unit (n = 10 pigs per group at each time point). Red colour indicates genera with significant differences between groups (P ≤ 0.05), whereas white colour indicates non-significant differences (P > 0.05).

Figure 3. Long description
Panel: A bar graph compares the relative abundance of bacterial genera between the CTRL and LUP groups at three time points: T0 (0 days), T2 (14 days), and T4 (28 days). The horizontal axis lists the bacterial genera, while the vertical axis indicates the relative abundance. The graph features horizontal bars, with each bar representing a different genus. The color scheme uses red to indicate genera with significant differences between groups (P ≤ 0.05) and white for non-significant differences (P > 0.05). The data shows variations in the abundance of different bacterial genera at each time point, highlighting significant changes in specific genera over time.
Serum metabolites and mineral
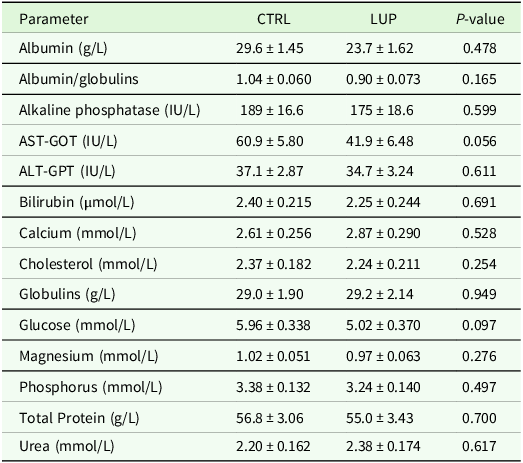
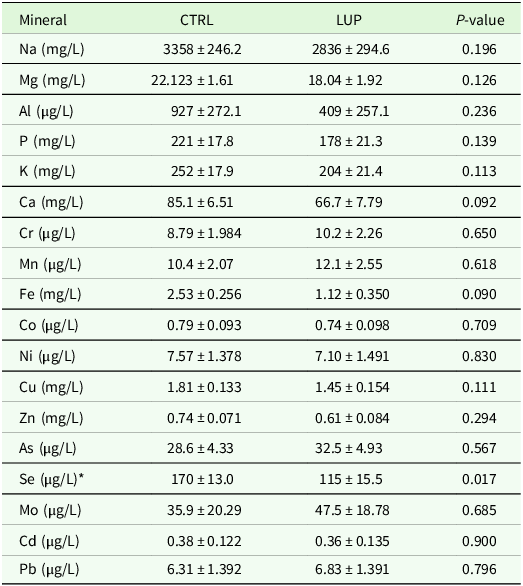
The substitution of soybean meal with lupin meal did not elicit any statistically significant alterations in the assessed blood serum biochemical parameters at the end of the trial (Table 7). Nevertheless, analysis of the mineral profile in blood revealed that animals in the LUP group exhibited significantly lower selenium concentrations (P = 0.017) (Table 8).
Blood serum parameters in control (CTRL) and lupin (LUP) groups at T4 (28 days)

Table 7. Long description
A table comparing blood serum parameters between control (CTRL) and lupin (LUP) groups at 28 days. The table has 15 rows and 4 columns. Column headers are Parameter, CTRL, LUP, and P-value. Row labels include Albumin, Albumin/globulins, Alkaline phosphatase, AST-GOT, ALT-GPT, Bilirubin, Calcium, Cholesterol, Globulins, Glucose, Magnesium, Phosphorus, Total Protein, and Urea. Each row provides values for CTRL and LUP groups along with their respective P-values. Notable parameters include Albumin with CTRL at 29.6 ± 1.45 g/L and LUP at 23.7 ± 1.62 g/L, and AST-GOT with CTRL at 60.9 ± 5.80 IU/L and LUP at 41.9 ± 6.48 IU/L.
Data are shown as means ± standard error.
Blood serum mineral content in control (CTRL) and lupin (LUP) at T4 (28 days)

Table 8. Long description
A table comparing blood serum mineral content between control (CTRL) and lupin (LUP) groups at 28 days. The table has 19 rows and 4 columns. The columns are labeled Mineral, CTRL, LUP, and P-value. The minerals listed include Na, Mg, Al, P, K, Ca, Cr, Mn, Fe, Co, Ni, Cu, Zn, As, Se, Mo, Cd, and Pb. Each row provides the concentration of the mineral in the CTRL and LUP groups along with the P-value indicating statistical significance. Notable trends include significantly lower selenium concentrations in the LUP group with a P-value of 0.017.
Data are shown as means ± standard error. Asterisk indicates significant differences: *P-value < 0.05.
Discussion
Although lupin represents a promising locally produced alternative to soybean meal, its sustainability benefits need to be considered alongside its nutritional effectiveness and potential effects on animal performance and health (Rauw et al., Reference Rauw, Gómez Izquierdo, Torres, García Gil, De Miguel Beascoechea, Rey Benayas and Gomez-Raya2023). In pig production, the post-weaning period represents one of the most critical phases, during which animals are particularly vulnerable to nutritional and environmental stressors (Tang et al., Reference Tang, Xiong, Fang and Li2022). Therefore, this stage serves as a key testing ground to evaluate the true zootechnical benefits and potential limitations of alternative feeds. For this reason, the investigation was deliberately conducted during the weaning phase, allowing us to observe how dietary treatments such as lupin inclusion perform when the animals are most at risk.
Chemical composition of L. albus
The results of the chemical analysis of L. albus confirm, in agreement with previous literature, its high protein content, comparable to that of soybean (Martínez-Villaluenga et al., Reference Martínez-Villaluenga, Frías and Vidal-Valverde2006; Sujak et al., Reference Sujak, Kotlarz and Strobel2006). Compared to other legumes such as peas, soybeans and beans, white lupin proteins are notable for their lower levels of anti-nutritional factors (ANFs) and higher concentrations of key AAs, including arginine, lysine, leucine and phenylalanine (Pereira et al., Reference Pereira, Ramos and Sanches Silva2022). This composition makes white lupin particularly valuable in meeting the nutritional requirements of monogastric animals. Furthermore, its total AA profile, especially EAAs, is superior to that of other lupin species commonly cultivated in Europe (Sujak et al., Reference Sujak, Kotlarz and Strobel2006). This AA composition highlights the potential of white lupin as a high-quality alternative protein source in animal nutrition.
In addition to its protein content, white lupin distinguishes itself from other legumes by its very low starch content. The limited starch present consists mainly of resistant starch, which offers recognized health benefits (Arnoldi and Greco, Reference Arnoldi and Greco2011). Resistant starch is fermented in the lower intestine, producing short-chain fatty acids (SCFAs). These SCFAs contribute to intestinal health by serving as an energy source for epithelial cells, reinforcing the gut barrier against pathogens and modulating the gut microbiota by inhibiting harmful bacteria and promoting beneficial species (Tan et al., Reference Tan, Beltranena and Zijlstra2021).
Regarding fat composition, L. albus is also a valuable ingredient for animal feed. Its lipid fraction is predominantly composed of unsaturated fatty acids, particularly oleic acid (ω-9, 18:1) and linoleic acid (ω-6, 18:2), followed by alpha-linolenic acid (ω-3, 18:3) (Boschin et al., Reference Boschin, D’agostina, Annicchiarico and Arnoldi2008). These unsaturated fatty acids are especially beneficial in monogastric diets due to their higher digestibility compared to saturated fats (Chiofalo et al., Reference Chiofalo, Presti, Chiofalo and Gresta2012; Calabrò et al., Reference Calabrò, Cutrignelli, Lo Presti, Tudisco, Chiofalo, Grossi, Infascelli and Chiofalo2015; Fanalli et al., Reference Fanalli, da Silva, Petry, Santana, Polizel, Antunes, de Almeida, Moreira, Luchiari Filho, Coutinho, Balieiro, Reecy, Koltes, Koltes and Cesar2022).
Zootechnical performance
The present study disclosed that the inclusion of 10 % of lupin meal in the feed formulation, in substitution of soybean meal, supported regular growth patterns in piglets throughout the experimental period. The selected inclusion rate was chosen to allow the complete replacement of soybean meal and to test the feasibility of lupin flour as an alternative protein source under practical feeding conditions. This level falls within the range of dietary inclusion (5–20 % of the diet formula) previously investigated in pigs (Ciurescu et al., Reference Ciurescu, Dumitru, Lefter and Râmbu2025). Similar findings, in terms of growth, were reported by Kasprowicz-Potocka et al. (Reference Kasprowicz-Potocka, Zaworska, Kaczmarek, Hejdysz, Mikuła and Rutkowski2017) in pigs with a higher initial BW (approximately 20 kg), where the complete replacement of soybean meal with white lupin meal resulted in reduced growth performance. In the same study, a partial replacement (50 % of the soybean inclusion level) did not negatively affect growth parameters. However, it should be noted that these results were obtained in heavier pigs, whereas information on the use of lupin-based diets in younger, post-weaning piglets is still limited. Young piglets may have a reduced ability to efficiently utilize lupin due to physiological immaturity, highlighting the need for studies specifically focused on the post-weaning phase. On the contrary, Hanczakowska et al. (Reference Hanczakowska, Księżak and Świątkiewicz2017) observed a positive effect on BW gain, including 6 % and 10 % of blue and yellow lupin with low alkaloid content, respectively, partially substituting soybean in piglets’ diets (Hanczakowska et al., Reference Hanczakowska, Księżak and Świątkiewicz2017). This could be due to the lower content of alkaloids compared to L. albus variety used in the present study and the different age of animals that in the study of Hanczakowska et al. (Reference Hanczakowska, Księżak and Świątkiewicz2017) were weaned at 35 days. In fact, it has been demonstrated that piglets with a delayed weaning age exhibit advanced development of the gastrointestinal tract, resulting in a higher capacity to exploit dietary nutrients and tolerate alkaloid content (Pluske et al., Reference Pluske, Kerton, Cranwell, Campbell, Mullan, King, Power, Pierzynowski, Westrom, Rippe, Peulen and Dunshea2003; Wellock et al., Reference Wellock, Fortomaris, Houdijk and Kyriazakis2008). The lower growth observed in the LUP group was consistent with the numerically lower ADFI recorded during most of the experimental period. Although statistical inference was not performed for feed intake and feed efficiency, these numerical trends suggest that lupin inclusion may have influenced palatability and nutrient utilization in young piglets. Reduced digestibility of lupin-based diets, particularly due to their high non-starch polysaccharide content and residual antinutritional compounds, may have limited nutrient availability to the host (Kasprowicz-Potocka et al., Reference Kasprowicz-Potocka, Zaworska, Kaczmarek, Hejdysz, Mikuła and Rutkowski2017; King et al., Reference King, Dunshea, Morrish, Eason, Van Barneveld, Mullan and Campbell2000; Mierliță, Reference Mierliță2018; Parrini et al., Reference Parrini, Aquilani, Pugliese, Bozzi and Sirtori2023; Prandini et al., Reference Prandini, Morlacchini, Moschini, Fusconi, Masoero and Piva2005; Vishnyakova et al., Reference Vishnyakova, Sinjushin, Ćupina, Rubiales, Ellis, Patto, Medović, Zorić and Smýkal2022). Importantly, reduced nutrient digestibility may also have indirect consequences on gut microbial ecology. Undigested protein and fermentable carbohydrates reaching the distal gut can provide substrates for opportunistic and potentially pathogenic bacteria, thereby contributing to microbial imbalance and intestinal inflammation (Pluske et al., Reference Pluske, Turpin and Kim2018). This mechanism is consistent with the microbiota alterations observed in the present study, including increased abundance of facultative anaerobes and reduced levels of beneficial fibre-degrading and short-chain fatty acid–producing bacteria. Such microbial shifts may further impair intestinal function, creating a feedback loop that negatively affects nutrient absorption and growth performance during the post-weaning period (Gresse et al., Reference Gresse, Chaucheyras-Durand, Fleury, Van De Wiele, Forano and Blanquet-Diot2017; Guevarra et al., Reference Guevarra, Lee, Lee, Seok, Kim, Kang, Johnson, Isaacson and Kim2019).
Further investigations should be performed with a broader experimental design, involving animals at more advanced growth stages, and evaluating also the effects of mechanical or thermal processing in order to reduce lupin’s content in antinutritional factors. Furthermore, lower doses of lupin seed meal inclusion, or combinations with other plant-source protein should be evaluated as a strategy for the inclusion of this legume grain in piglets’ diet.
A methodological consideration of the present study is the absence of replicate pens within each dietary treatment, which precluded an appropriate statistical evaluation of feed intake and feed efficiency. Consequently, these parameters should be considered descriptive and interpreted with caution. Future studies using multiple independent pens per treatment could further clarify the relationship between lupin-induced microbial changes and performance responses.
Faecal score and faecal dry matter
Including lupin meal in the diet did not significantly affect the faecal score of the experimental groups, as well as the faecal dry matter, throughout the trial. These data are in line with those of Kim et al. (Reference Kim, Heo, Mullan and Pluske2012) disclosed that the inclusion of L. angustifolius in weaned pigs’ diet in replacement of milk whey and skim milk did not register differences in faecal consistency over 21 days of trial. In addition, the saponin content of L. albus seeds has been shown to potentially decrease the diarrhoea frequency (Wang et al., Reference Wang, Yu, He, Yu, Luo, Luo, Mao and Chen2023).
The lack of differences in diarrhoea occurrence, supported by the comparable dry matter content, indicates that the inclusion of lupin did not result in gastroenteric disorders that could cause diarrhoea. This is particularly important because post-weaning diarrhoea represents a major challenge in swine production, as it can severely compromise animal health, growth performance and overall economic returns (Tang et al., Reference Tang, Lan, Zhou, Gao, Wu, Wei, Li, Tang, Tang, Diao, Xu, Peng, Pang, Zhao and Sun2024). This condition is known to have a multifactorial aetiology, involving dietary, microbial, environmental and physiological factors (Dell’Anno et al., Reference Dell’Anno, Frazzini, Reggi, Ferri, Scaglia, Schiasselloni, Inglesi, Riva, Verdile, Pasquariello and Rossi2024). Among these, the composition and quality of dietary protein sources play a critical role in influencing gut health during the vulnerable post-weaning period (Frazzini et al., Reference Frazzini, Reggi, Dell’Anno, Fifi, Scaglia, Ferri and Rossi2024). In this context, the use of alternative protein sources, such as lupin, that do not exacerbate the incidence of diarrhoea is particularly advantageous.
Protein digestibility and faecal mineral content
Although the faecal nitrogen content did not differ significantly between treatments, confirming the isonitrogenous formulation of the diets and indicating that the total nitrogen intake was comparable, the observed reduction in protein digestibility in the LUP group highlights a lower efficiency in the utilization of lupin protein compared to soybean meal. This suggests that a higher proportion of the ingested lupin protein bypassed enzymatic digestion and absorption in the gastrointestinal tract, likely leading to increased nitrogen losses via faeces (Choct et al., Reference Choct, Dersjant-Li, Mcleish and Peisker2010).
Several factors may account for this reduced digestibility. First, lupin seeds naturally contain various ANFs, such as alkaloids, protease inhibitors and non-starch polysaccharides (NSPs), which can interfere with the activity of digestive enzymes or impair nutrient absorption by increasing intestinal viscosity and reducing transit efficiency (Dunshea et al., Reference Dunshea, Gannon, Van Barneveld, Mullan, Campbell and King2001; Pieper et al., Reference Pieper, Taciak, Pieper, Święch, Tuśnio, Barszcz, Vahjen, Skomiał and Zentek2016a). Although modern sweet lupin cultivars have lower alkaloid contents, residual levels may still exert subclinical effects on gut function (Schrenk et al., Reference Schrenk, Bodin, Chipman, Del Mazo, Grasl-Kraupp, Hogstrand, Hoogenboom, Leblanc, Nebbia, Nielsen, Ntzani, Petersen, Sand, Schwerdtle, Vleminckx, Wallace, Alexander, Cottrill, Dusemund, Mulder, Arcella, Baert, Cascio, Steinkellner and Bignami2019). Moreover, the protein matrix of lupin may be less soluble or structurally more resistant to proteolysis compared to that of soybean, particularly due to differences in protein composition and folding patterns (Duranti et al., Reference Duranti, Consonni, Magni, Sessa and Scarafoni2008). Additionally, the AA profile of lupin proteins, which is typically lower in sulphur-containing AAs (e.g., methionine and cysteine), may affect the efficiency of protein synthesis and overall nitrogen retention in the animal (Tabe and Droux, Reference Tabe and Droux2002). According to this, Froidmont et al. (Reference Froidmont, Wathelet, Beckers, Romnée, Dehareng and Wavreille2005) observed a significant decrease in nitrogen digestibility after feeding different varieties of white lupin and blue lupins to pigs, in partial substitution of soybean content of the diet. Kasprowicz-Potocka et al. (Reference Kasprowicz-Potocka, Zaworska, Kaczmarek, Hejdysz, Mikuła and Rutkowski2017) registered a high content of NSP in lupins, along with a decrease in the digestibility of crude fibre after their inclusion in pig’s diet. Kim et al. (Reference Kim, Heo, Mullan and Pluske2012), reported that whole lupin inclusion in weaning pigs should be limited because of their high fibre content, which negatively influences the piglets’ performance (Kim et al., Reference Kim, Heo, Mullan and Pluske2012). These combined factors contribute to the lower apparent digestibility of lupin-derived protein and may necessitate dietary adjustments or processing treatments (e.g., enzyme supplementation, thermal processing) to improve its nutritional value in monogastric diets such as those of weaned piglets.
Regarding the mineral content of faecal samples, although specific studies on the mineral content in pig faeces receiving a lupin-based diet as an alternative protein source are lacking in literature, the results obtained in the present study did not disclose any significant difference between the two experimental groups, demonstrating that the inclusion of L. albus in the diet did not affect the bioavailability of mineral content. The absence of statistically significant differences in faecal mineral content between the experimental groups does not rule out potential nutritional effects attributable to differences in diet composition. In particular, the higher fibre and phytate content in lupin meal may have influenced the bioavailability of certain minerals, such as iron, copper, manganese and zinc, which tended to show higher faecal concentrations in the LUP group (Písaříková and Zralý, Reference Písaříková and Zralý2009). In post-weaning pigs, whose digestive systems are still developing and who exhibit limited endogenous phytase activity, the presence of these components can reduce intestinal mineral absorption and promote their excretion (Valente Junior et al., Reference Valente Junior, Genova, Kim, Saraiva and Rocha2024). Therefore, these findings suggest that the inclusion of lupin in the diet requires careful nutritional balancing and, if necessary, the use of strategies such as enzyme supplementation to optimize micronutrient utilization (Philippi et al., Reference Philippi, Sommerfeld, Windisch, Olukosi, Monteiro and Rodehutscord2023).
Gut microbiota
Due to various stressful events that animals face, the weaning period in piglets is often associated with a dysbiosis of the gut microbiota (Guevarra et al., Reference Guevarra, Hong, Cho, Kim, Shin, Lee, Kang, Kim, Wattanaphansak, Isaacson, Song and Kim2018). Together with the integrity of the intestinal epithelium barrier, microbiota composition plays a pivotal role in the prevention of gastrointestinal disorders typical of the most critical stages of swine farming (Tang et al., Reference Tang, Xiong, Fang and Li2022). Thus, its modulation through dietary strategies, aiming to maintain its eubiosis, represents one of the major strategies to reduce the incidence of pathologies in swine farming (Gresse et al., Reference Gresse, Chaucheyras-Durand, Fleury, Van De Wiele, Forano and Blanquet-Diot2017). In our trial, we observed differences in the quantity of different bacteria strains among the two experimental groups. Lupin seed meal was not able to modulate the intestine microbiota increasing its richness. However, increased richness does not necessarily reflect improved functional stability, particularly during the post-weaning phase, when the gut ecosystem is highly sensitive to dietary perturbations (Guevarra et al., Reference Guevarra, Lee, Lee, Seok, Kim, Kang, Johnson, Isaacson and Kim2019; Pluske et al., Reference Pluske, Turpin and Kim2018). In detail, we observed an increase in the amount of Methanobrevibacter in the group receiving the diet containing lupin meal, a bacterium related to fibre degradation in the intestine (Niu et al., Reference Niu, Li, Hao, Zhang, Kim, Li, Ma, Gao, He, Wu, Huang, Hua, Zhou and Huang2015). Kasprowicz-Potocka et al. (Reference Kasprowicz-Potocka, Zaworska, Kaczmarek, Hejdysz, Mikuła and Rutkowski2017) observed low levels of crude fibre digestibility related to the high non-starch polysaccharide (NSP) content of lupin seed. The reduced digestibility of NSP-rich fractions may increase substrate availability in the hindgut, promoting the proliferation of hydrogenotrophic and fibrolytic microorganisms and favouring hydrogenotrophic microorganisms such as Methanobrevibacter, which utilize H2 generated during microbial polysaccharide degradation (Mi et al., Reference Mi, Peng, Wu, Wang and Liao2019). While this shift may enhance fermentative activity, it can also alter energy partitioning and reduce nutrient availability for the host, potentially contributing to lower growth performance (Pluske et al., Reference Pluske, Turpin and Kim2018). An increase in Allobaculum and Romboutsia was also observed in piglets receiving the lupin seed meal. These bacteria play a role in the digestion of complex carbohydrates, thus producing short-chain fatty acids that help protect the mucosal barrier of the intestine (Gao et al., Reference Gao, Tian, Wang and Zhu2021; Yang et al., Reference Yang, Shi, Zhang, Liu, Li, Gao, Cui, Yan and Li2020; Zhang et al., Reference Zhang, Zhang, Zhang, Wang, Shi, Li, Gao, Cui, Li and Yang2023). Nevertheless, excessive fermentation driven by high NSP availability may also increase intestinal osmolarity and transit time, potentially exacerbating digestive inefficiency in young piglets (Montagne et al., Reference Montagne, Pluske and Hampson2003). Conversely, we observed a marked increase in Escherichia coli/Shigella abundance in the LUP group. The dysbiosis that generally occurs during weaning leads to a decrease in the amount of obligate anaerobic bacteria, such as Clostridia and Bacteroides, and an increase in the facultative anaerobic species, such as E. coli and Shigella (Gresse et al., Reference Gresse, Chaucheyras-Durand, Fleury, Van De Wiele, Forano and Blanquet-Diot2017; Kim et al., Reference Kim, Heo, Mullan and Pluske2012). The lower protein digestibility observed in piglets fed the lupin-based diet may have increased the availability of undigested nitrogen substrates in the distal gut, favouring the proliferation of opportunistic and potentially pathogenic bacteria (Pieper et al., Reference Pieper, Villodre Tudela, Taciak, Bindelle, Pérez and Zentek2016b). Although inflammatory markers were not directly assessed in this study, previous evidence suggests that altered gut conditions and microbial imbalance may create an intestinal environment that favours the proliferation of opportunistic and potentially pathogenic bacteria, including E. coli/Shigella and members of the Clostridium and Bacteroidota taxa (Grosu et al., Reference Grosu, Pistol, Marin, Cişmileanu, Palade and Ţăranu2020). Accordingly, the increased abundance of Clostridium XI and E. coli/Shigella observed in piglets receiving the lupin-based diet should be interpreted as indicative of a microbial imbalance potentially associated with intestinal stress, rather than as direct evidence of an inflammatory state. The concurrent increase in Aerococcus, a genus frequently associated with infectious processes in pigs (Cui et al., Reference Cui, Zhang, Liu, Dong, Zhao, Chen, Chen, Sun and Guo2022; Hong et al., Reference Hong, Park, Jeong and Kim2021), further supports the hypothesis that lupin inclusion may have influenced gut microbial stability during the post-weaning period. In our study, we observed a statistically different reduction in Prevotella in the intestine of the animals receiving the lupin meal. Previous studies observed a negative correlation between the incidence of bowel disease and this genus (Grosu et al., Reference Grosu, Pistol, Marin, Cişmileanu, Palade and Ţăranu2020). Dell’Anno et al. (Reference Dell’Anno, Reggi, Caprarulo, Hejna, Sgoifo Rossi, Callegari, Baldi and Rossi2021) reported that Prevotella is related to fibre degradation in the intestine, producing short-chain fatty acids that soothe the gut environment. Therefore, the reduction of this genus may have impaired SCFA-mediated gut protection, contributing to microbial instability and potentially affecting nutrient absorption and growth performance (Flint et al., Reference Flint, Scott, Duncan, Louis and Forano2012). We also observed a decrease in the relative abundance of Anaerovibrio in LUP. Although this genus has been associated with gastrointestinal conditions, including diarrhoea, in some studies, its biological role remains incompletely understood and may vary depending on host, diet and microbial ecosystem (Karasova et al., Reference Karasova, Crhanova, Babak, Jerabek, Brzobohaty, Matesova and Rychlik2021). In the present study, no increased incidence of diarrhoea or other clinical signs was observed, suggesting that the reduction of Anaerovibrio was not associated with adverse clinical outcomes. Overall, the observed microbiota shifts suggest that the high NSP content of lupin seed meal challenged the adaptive capacity of the immature gut microbiota during weaning, leading to a microbial configuration that was less favourable for optimal growth performance. Taken together, these findings indicate that while lupin inclusion modulated gut microbial composition, the resulting microbial profile may not have fully supported intestinal homeostasis and efficient nutrient utilization in very young piglets. This highlights the importance of carefully balancing NSP levels and considering digestive maturity when introducing lupin-based ingredients in post-weaning diets.
Serum metabolites and minerals
Blood metabolites can be influenced by nutritional strategies, making them a topic of significant importance in livestock production (Etim, Reference Etim2014). In our study, no significant differences were found between the two groups in terms of the blood parameters analysed. Moreover, the registered values were within the established physiological ranges for the species thus suggesting a good health status of piglets (Sotira et al., Reference Sotira, Dell’Anno, Caprarulo, Hejna, Pirrone, Callegari, Tucci and Rossi2020). Among liver-related enzymes, AST-GOT values were numerically lower in the LUP group compared with the CTRL group, although this difference did not reach statistical significance. AST-GOT is a non-specific enzyme involved in AA metabolism and is commonly used as an indicator of hepatic and muscular integrity (Čobanović et al., Reference Čobanović, Stanković, Dimitrijević, Suvajdžić, Grković, Vasilev and Karabasil2020; Bau-Gaudreault et al., Reference Bau-Gaudreault, Arndt, Provencher and Brayton2021). The lower AST-GOT values observed in piglets fed the lupin-based diet may reflect reduced hepatic or muscular metabolic load rather than impaired liver function, as all values remained within physiological ranges and were not accompanied by alterations in other liver enzymes or serum metabolites (Kaneko et al., Reference Kaneko, Harvey and Bruss2008; Sotira et al., Reference Sotira, Dell’Anno, Caprarulo, Hejna, Pirrone, Callegari, Tucci and Rossi2020). This numerical reduction should therefore be interpreted with caution and considered as a descriptive trend rather than evidence of a biologically relevant effect. Albumin could be considered an important parameter of the nutritional status and inflammatory status of the host (Keller, Reference Keller2019).
Accordingly, the absence of differences in serum albumin concentration between groups suggests that the inclusion of lupin did not result in detectable alterations of systemic nutritional status. Although nitrogen digestibility was reduced, no alterations were observed in the blood parameters measured, which remained within physiological ranges for the species (Sotira et al., Reference Sotira, Dell’Anno, Caprarulo, Hejna, Pirrone, Callegari, Tucci and Rossi2020).
Urea represents another interesting parameter for consideration, being a waste product generated by the liver during the catabolism of protein (Berghaus et al., Reference Berghaus, Haese, Weishaar, Sarpong, Kurz, Seifert, Camarinha-Silva, Bennewitz, Chillon, Stefanski and Rodehutscord2023). Urea production should reflect not only alterations in dietary protein intake but also the ability of animals to retain dietary nitrogen in the body, indicating the effective utilization of protein (Pedersen and Boisen, Reference Pedersen and Boisen2001). Therefore, lupin inclusion did not alter the serum urea content compared to soybean, even though a significantly lower nitrogen digestibility was observed after 28 days.
In our trial, the blood serum mineral content was similar among the two groups of animals, except for the iron and selenium, which resulted lower in LUP compared to CTRL after 28 days. As reported by Kim et al. (Reference Kim, Pluske and Mullan2007), lupin seed contains phytate. Phytates are recognized for their ability to decrease the bioavailability of essential microelements like iron, zinc and calcium by forming insoluble complexes with these minerals (Lautrou et al., Reference Lautrou, Narcy, Dourmad, Pomar, Schmidely and Létourneau Montminy2021). These complexes cannot be dissociated in the gut, thereby inhibiting their absorption (Marie Minihane and Rimbach, Reference Marie Minihane and Rimbach2002; Zhang et al., Reference Zhang, Stockmann, Ng and Ajlouni2022). Selenium is another element susceptible to chelation in the presence of phytic acid (Frank et al., Reference Frank, Meuleye, Miller, Shu and Engel2007). The chelating action of phytates on selenium can also explain the lower levels of selenium registered in LUP compared to CTRL. Due to this factor, it may be reasonable to explore testing other lupin varieties or considering a lower percentage of lupin inclusion in piglet diets.
Conclusion
In the present study, the replacement of soybean meal with 10 % L. albus seed meal in diets for weaned piglets did not result in detectable alterations of systemic health status, as indicated by blood parameters remaining within physiological ranges. However, lupin inclusion was associated with reduced growth performance and feed efficiency compared with the soybean-based CTRL diet, highlighting the limitations of using this ingredient at the tested inclusion level in very young animals. At the same time, the study provided novel insights into the effects of L. albus on gut microbiota composition during the post-weaning period. The observed microbial shifts suggest that the high fibre and bioactive compound content of lupin can significantly modulate the intestinal ecosystem, although not always in a direction fully supportive of optimal growth under the present conditions. Overall, these findings indicate that in order for L. albus to represent a promising local protein source from a sustainability perspective, its use in weaned piglet diets requires careful consideration of inclusion level, processing strategies and animal developmental stage. Further studies are needed to optimize its nutritional utilization and productive efficiency in pig production systems. It should be noted that the lack of pen replicates in the present study limited the possibility of performing statistical analysis for feed intake and feed efficiency parameters. Therefore, further studies with larger experimental designs are required to confirm these findings and to better define the productive implications of lupin inclusion in weaned piglet diets.
Supplementary material
The supplementary material for this article can be found at https://doi.org/10.1017/S0021859626100896.
Acknowledgements
The authors would like to thank Ferraroni S.p.A. for providing the feed, and in particular Giancarlo Selmini for his contribution in the diet formulation. Additionally, the authors extend their gratitude to Angelo Caglioni for gently providing the animals and facilities, and Giovanni Urì for his support during the in vivo trial.
Author contributions
Conceptualization, L.R.; methodology, M.D.A, S.R.P, A.S., B.C., P.C., F.B. and L.R.; software, M.S., S.F. and F.B.; validation, L.P. and L.R.; formal analysis, M.S., S.F. and F.B.; investigation, M.S., M.D.A., B.C., M.G. and P.C.; resources, L.R.; data curation, M.S., S.F., M.D.A., F.B. and P.C.; writing – original draft preparation, M.S., S.F. and M.D.A.; writing—review and editing, M.S., S.F., M.D.A., S.R.P., A.S., P.C., L.P. and L.R.; visualization, M.S., S.F. and F.B.; supervision, L.P. and L.R.; project administration, L.R.; funding acquisition, L.R. All authors have read and agreed to the published version of the manuscript.
Funding statement
This study was conducted in the frame of LEGUPLUS project funded by the Italian Ministry of Agricultural, Food and Forestry Policies (D.M. n. 28920 of 18/07/2019, D.M. n. 9358195 of 03/12/2020).
Competing interests
The authors declare no conflicts of interest.
Ethical standards
This study was conducted following the guidelines of the Declaration of Helsinki. The experimental trial was approved by the Animal Welfare Organization of University of Milan (OPBA authorization number 4_2023).




 Open access

