Implications
In response to adrenaline challenge, lambs from high muscling sires had lower muscle response and increased adipose tissue response. These results highlight the importance of careful nutritional management of highly muscled animals to maintain sufficient glucose levels for maintenance, growth and glycogen deposition. They suggest that selection for muscling leads to more glycogen deposition and favours glycogen sparing rather than catabolism, with preference for energy sourced from adipose tissue. This metabolic shift in muscle glycogen metabolism has flow on effects for muscle glycogen reserves and subsequent meat and carcase quality.
Introduction
Within many Australian Merino production systems the primary focus is no longer solely on wool production. More recently, sheep meat production has been integrated into traditional wool enterprises due to a rise in world demand for protein sources and a relative decrease in demand for wool (Nossal et al., Reference Nossal, Sheng and Zhao2008). The Sheep Genetics Australia, generates Australian sheep breeding values (ASBVs) for a number of economically important wool and carcase traits. Many sheep producers now use these breeding values to select sires with the genetic potential for increased yearling eye muscle depth (YEMD), leanness at the grade rule site (YFAT) and growth based on liveweight (YWT), with the ultimate goal of maximising carcase size and lean meat yield. These carcase ASBVs have been successfully used in terminal sires, with substantial gains in yield achieved (Banks, Reference Banks1994). However, the question remains as to how this selection pressure for these traits will impact upon muscle and adipose tissue metabolism within the animal.
Both selection for muscling and leanness have been shown to increase the proportion of glycolytic type IIX muscle fibres, with a reduction in intermediate type IIA fibre types (Ashmore et al., Reference Ashmore, Tompkins and Doerr1972; Kadim et al., Reference Kadim, Purchas, Davies, Rae and Barton1993; Greenwood et al., Reference Greenwood, Gardner and Hegarty2006; Gardner et al., Reference Gardner, Daly, Thompson and Pethick2006a). This will result in a metabolic shift towards a more glycolytic metabolism in the muscle. Higher proportions of type IIX muscle fibres and glycolytic metabolism are also associated with a greater expression of glycogen phosphorylase (Briand et al., Reference Briand, Talmant, Briand, Monin and Durand1981; Saltin and Gollnick, Reference Saltin and Gollnick1983; Greenwood et al., Reference Greenwood, Gardner and Hegarty2006; Gardner et al., Reference Gardner, Daly, Thompson and Pethick2006a), the key enzyme in glycogen breakdown. A metabolic shift of these muscle types are likely to make the animal more susceptible to adrenaline-induced glycogen depletion during stress (Gardner et al., Reference Gardner, Kennedy, Milton and Pethick1999), reflected by the elevation of plasma lactate concentration. Pre-slaughter levels of muscle glycogen >60 mmol/g ensures that an ultimate pH of 5.5 is reached in meat. If levels are below this amount, ultimate pH is elevated, and dark, firm and dry meat may result (Ashmore et al., Reference Ashmore, Carroll, Doerr, Tompkins, Stokes and Parker1973). Therefore, it is possible that selection for muscling may result in reduced muscle glycogen at slaughter, and dark, firm and dry meat.
As animals mature, muscle fibres may differentiate or change in size and metabolic activity. Studies in maturing sheep report an increase muscle fibre area in both glycolytic and oxidative muscle fibres (Whipple and Koohmaraie, Reference Whipple and Koohmaraie1992). Brandstetter et al. (Reference Brandstetter, Picard and Geay1998) found young growing bulls expressed proportionally more slow type 1 myofibres as they matured. Therefore, we anticipate that similar changes will occur within the Australian Merino and Poll Dorset cross breeds, with a tendency towards more oxidative muscle types as animals mature, which produce less lactate in response to adrenaline. It remains to be seen whether this maturity effect will interact with the impact of selection for muscling.
Selection for muscling, leanness and growth using carcase ASBVs has been found to promote the growth of lean tissue, resulting in carcases with proportionally more muscle and less fat at heavier carcase weight (Gardner et al., Reference Gardner, Pethick, Greenwood and Hegarty2006b; Hegarty et al., Reference Hegarty, Hopkins, Farrell, Banks and Harden2006b). Hegarty et al. (Reference Hegarty, Shands, Marchant, Hopkins, Ball and Harden2006a and Reference Hegarty, Hopkins, Farrell, Banks and Harden2006b) found that the selection of sires with increasing eye muscle depth ASBV resulted in lamb carcases with reduced C-site fat depth, less intramuscular fat within the loin muscle and less total carcase fat, a similar trend to that observed by Hocquette et al. (Reference Hocquette, Bas, Bauchart, Vermorel and Geay1999) in double-muscled Belgian Blue cattle. In times of psychological or physical stress (such as mustering, transportation or starvation), animals have the ability to mobilise their adipose tissue to form non-esterified fatty acids (NEFA), which then has to be oxidised to form energy in other tissues (Chilliard et al., Reference Chilliard, Ferlay, Faulconnier, Bonnet, Rouel and Bocquier2000). Therefore, we can expect that selection for leanness and muscling will reduce the proportional size of the adipose tissue depots and therefore reduce the size of the response to adrenaline as indicated by blood NEFA concentrations.
It is well documented within a number of species including sheep that the proportion of muscle, fat and bone changes with maturity. In sheep, the fat growth impetus is high, meaning fat increases as a proportion of liveweight (LW) as the animals mature (Butterfield et al., Reference Butterfield, Griffiths, Thompson, Zamora and James1983). More recently, Ponnampalam et al. (Reference Ponnampalam, Butler, Hopkins, Kerr, Dunshea and Warner2008) found that as a proportion of carcase weight older animals had more fat and less muscle. Therefore, we anticipate that the older animals, which are proportionately fatter will show increased NEFA response to adrenaline.
The synthesis or mobilisation of glucose through hepatic glycogenolysis and gluconeogenesis and renal gluconeogenesis is an important component of the response to adrenaline; however, at this time there is no evidence to suggest that selection for muscling will have any effect on these key metabolic pathways in ruminants. However, due to the importance of gluconeogenesis for the ruminant animal, changes in release of glucose from the liver in response to adrenaline as a result of selection for muscling is of interest.
Intermediary metabolites such as glucose and NEFA are important precursors for glycogen and fat deposition. Therefore, it is imperative to understand the effects that selection for muscling, leanness and growth have on intermediary metabolism in growing Poll Dorset cross and Merino lambs to determine possible ramifications that this strategy has on meat quality, including the potential for dark cutting and carcase composition.
This study tested the hypotheses that (i) selection for muscling will result in increased muscle responsiveness and reduced adipose response to adrenaline; (ii) selection for muscling will not alter the liver glucose output in response to adrenaline and (iii) older animals will have a decreased muscle response and greater adipose tissue response to adrenaline.
Material and methods
Experimental design
A total of 20 crossbred and purebred lambs from Merino ewes mated to Poll Dorset and Merino sires selected for extremes in muscling, growth and leanness ASBVs were studied for dose-response to adrenaline infusion at 4 months of age and again at 16 months of age. Plasma lactate, NEFA and glucose were measured, indicating muscle, adipose and liver response to adrenaline. These animals previously had muscle biopsies collected from the Longissimus dorsi, Semimembranosus and Semitendinosus muscles 3 weeks prior to the procedures described within this study at both ages.
Animals
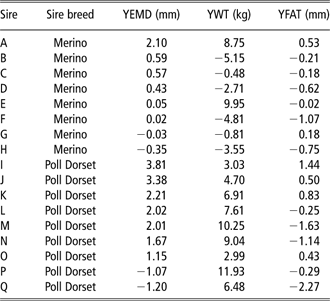
On day 1, 160 Merino ewes were artificially inseminated to 17 Merino and Poll Dorset sires selected for a range of YEMD and YWT. The sires were selected to represent high and low muscling (YEMD) and/or growth (YWT) yearling production traits within the Merino and Poll Dorset breeds (Table 1). The fatness trait (YFAT) was also included in the sire information due to the close relationship between muscling, growth and fat on carcase composition. A subset of the resulting progeny was used in this study. Five mixed sex lambs were randomly selected from each of the high and low muscling groups within both sire breeds, with 20 lambs in total. Within the sire groups, each sire was represented by no more than two progeny, selected to represent the average weight of animals from each sire group. All Poll Dorset progeny were genotyped for the presence of the Carwell gene (Nicoll et al., Reference Nicoll, Burkin, Broad, Jopson, Greer, Bain, Wright, Dodds, Fennessy and McEwan1998; Jopson et al., Reference Jopson, Nicoll, Stevenson-Barry, Duncan, Greer, Bain, Gerard, Glass, Broad and McEwan2001), known to cause hypertrophy in the loin muscle, and two were identified as heterozygous carriers, both from the same sire. All lambs were weaned on day 214, at approximately 10 weeks of age.
Sire breed and ASBVs (sourced from the Sheep Genetics Australia, 2006) for YEMD, YWT and YFAT for the individual sires in this experiment
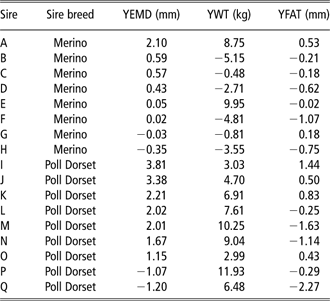
ASBVs = Australian sheep breeding values; YEMD = yearling muscle; YWT = yearling weight; YFAT = yearling fat.
Commencing on days 271 and 593 (∼4 and 16 months of age, respectively), the animals were placed in metabolism crates for 14 days prior to allow time for acclimation to their new environments. Sheep were individually fed a commercial pelleted ration (protein 11.6% DM (dry matter), fibre 3.7% DM, metabolisable energy 12.81 MJ/kg DM) at 1.5 times maintenance for each of the two occasions they were in the animal house, with maintenance requirements calculated using Grazfeed® (Horizon Technologies Ltd, Armidale, NSW, Australia) to allow for growth and development according to LW, which was measured weekly. On the days of the adrenaline challenges, the daily allocated feed ration was divided into four portions and each portion was fed at 0700 h, 1000 h, 1300 h and 1600 h to maintain steady blood metabolites.
On the day prior to the start of the infusions, animals were fitted with a polyvinyl catheter into the external jugular vein. Catheters were kept patent by filling with heparinised (10 IU/ml) sterile saline solution (Heparin sodium, Pharmacia, Rydalmere NSW, Australia) when not in use. During infusions and sample collection the catheters were flushed with EDTA (12.5 g/l, Sigma-Aldrich Pty. Ltd, Sydney NSW, Australia) in sterile saline.
Animal phenotype measurement
The animals were weighed weekly using commercial sheep scales. Loin fat depth and eye muscle area (EMA) were measured the week prior to each study at 4 and 16 months of age using CT-scan images (Hitachi CTW-430 Computed Tomography system, Armidale NSW, Australia) taken at the 12th rib with muscle area and fat depth calculated using a calibrated grid (Alston et al., Reference Alston, Mengersen, Robert, Thompson, Littlefield, Perry and Ball2007). The purpose of these measurements was for analysis of phenotype effects on adrenaline response variables measured; too few animals were measured for analysis of effects of ASBVs on phenotype.
Adrenaline challenge design
In total, 10 challenges were assigned in a randomised design with two per day over 5 days, including seven adrenaline challenges, two insulin and one dextrose challenges. The insulin and dextrose challenges were part of a separate study with a broader focus, and their results are reported elsewhere. It was noted in similar cattle experiments that animals became less responsive to adrenaline as they matured (Gardner et al., Reference Gardner, Martin, McGilchrist and Thompson2005). Pre-trials with similar sheep to determine maximum dose-response rates were conducted, which confirmed that higher adrenaline concentrations were required in the older sheep. Therefore, the adrenaline challenge range was increased for the 16 months of age study. The range of adrenaline challenges used was 0.1, 0.2, 0.4, 0.6, 0.9, 1.2, and 1.6 μg/kg LW at 4 months of age and 0.1, 0.2, 0.6, 1.2, 1.8, 2.4 and 3.0 μg/kg LW at 16 months of age.
Blood samples were collected via the jugular catheter at −30, −15, −10, −5, 0, 2.5, 5, 10, 15, 20, 30, 45, 60, 120, 125 and 130 min relative to the administration of the adrenaline challenge. Time zero indicates when the adrenaline challenge was administered. This procedure was repeated twice daily starting at 1000 h and 1400 h. The samples were collected from the catheter using Vacutainer® vacuum-filled blood collection tubes containing the anti-clotting factor EDTA, after which the catheter was flushed with 3 ml EDTA saline and the sample was mixed gently and placed on ice. The samples were then centrifuged at 3000 r.p.m. for 10 min and the plasma frozen at −20°C for analysis of lactate and glucose plasma concentrations and −80°C for the determination of NEFA concentration.
Chemical analysis
Laboratory determination of blood plasma was carried out in duplicate using enzymatic methods for glucose and lactate (Marbach and Weil, Reference Marbach and Weil1967; Kunst et al., Reference Kunst, Draeger and Ziegenhorn1983) automated within the Dupont Dimension® XL Clinical Chemistry system Auto-analyser (Dade Behring Diagnostics, QLD, Australia) measured at 340 nm. The NEFA concentration was measured in duplicate using a Wako NEFA C Kit (Wako Pure Chemical Ind., Osaka, Japan) modified for use as a microplate assay using a Titertech Multiscan Plus version 2.01 microplate reader (Flow Laboratories, Inc., McLean, VA, USA) measured at 570 nm.
Calculation of the response to adrenaline
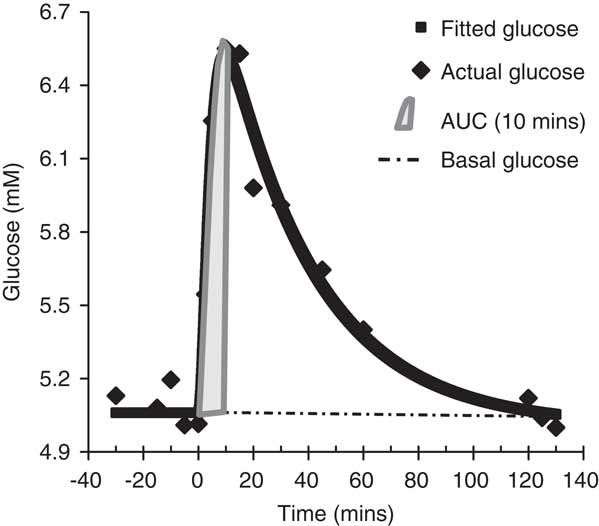
Basal concentrations of glucose, lactate and NEFA were calculated as the mean of samples collected at −30, −15, −10, −5 and 0 min relative to the adrenaline challenge. The concentrations of each substrate were then plotted against time for each challenge administered to each animal and a derived function with multiple exponential components was fitted to the raw data (Figure 1). This showed a classic increase and then tapering off in response, which was modelled using the following function:
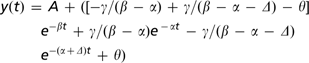
where y(t) is glucose concentration at time t, t is time (min), A is basal metabolite concentration, β, γ, α and Δ are exponential constants, θ is the adjustment from the basal metabolite concentration and ε is the error.
Example of fitted curve and actual data for plasma glucose concentration over time following an adrenaline challenge at time = 0. It shows basal glucose and area under curve (AUC). Maximum concentration measured at peak fitted concentration and corresponding time determined.
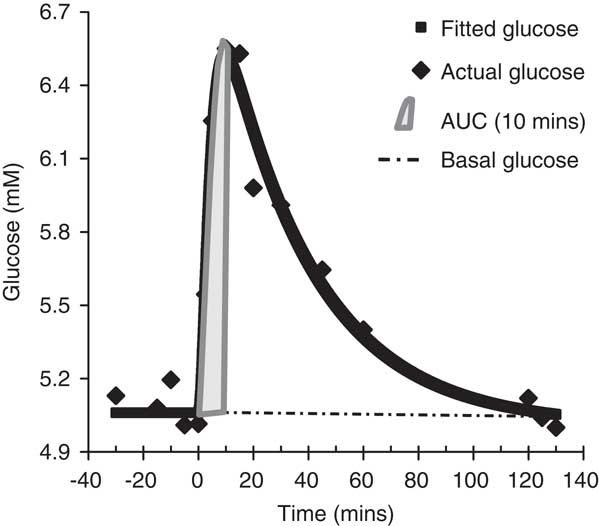
The function was then used to determine the time to maximum substrate concentration, the maximum substrate concentration and the area under the response curve (AUC) between 0 and 10 min (AUC 10) relative to administering the adrenaline challenge. The cut-off of 10 min for AUC calculations was chosen because it best reflected the time to maximum concentration of the three substrates studied. It is important to only assess the response up to approximately the time of maximum concentration as the change in plasma concentration up to that point is predominantly a result of substrate release in response to exogenous adrenaline. Incorporating time, later than when the substrate concentrations reached a maximum, will expose differences in the capability of the animals to clear substrate from circulation to return to homeostasis rather than the direct effect of adrenaline stimulation.
Statistical analysis
Basal substrate concentration, time to reach maximum concentration, maximum concentration and AUC 10 for glucose, lactate and NEFA were analysed using a linear mixed effects model in SAS (SAS version 9.0, SAS Institute Inc., Cary, NC, USA). The fixed effects were sire breed, sex and age, and the covariates included sire muscling, weight and fatness yearling ASBVs (YEMD, YWT and YFAT) and challenge level. First and second-order interactions were tested with non-significant (P ⩾0.1) terms sequentially removed. Animal within sire was used as the random term to account for some sires having multiple progeny and repeated samples taken from these progeny at the two ages and across the range of adrenaline challenges administered.
Experiments were approved and monitored by the University of New England Animal Ethics Committee.
Results
Animal phenotype
LW increased by about 70% with age (P < 0.0001) from 22.9 ± 0.6 at 4 months of age to 39.2 ± 0.6 kg at 16 months of age. Poll Dorset sired lambs were heavier (P < 0.01) than Merino sired lambs by about 10% at 4 months of age (21.47 ± 0.9 v. 24.26 ± 0.9 kg) and by about 25% at 16 months of age (34.56 ± 0.9 v. 43.81 ± 0.9 kg). At 4 months of age, increasing YEMD ASBV decreased LW (P < 0.05) by about 20% or 5 kg across the range of YEMD in this study.
The average EMA differed between age groups (P < 0.05) and sire breeds (P < 0.01), with the Merino sired lambs having an EMA of 957.9 ± 42.65 mm2, around 25% smaller than the Poll Dorset sired lambs with 1208.51 ± 42.29 mm2. EMA increased by around 15% from the average at 4 months of 1011.11 ± 41.07 mm2 to 1155.3 ± 41.09 mm2 at 16 months of age. C-site fat depth in Merinos did not change with age (1.12 ± 0.18 mm and 1.16 ± 0.19 mm at 4 and 16 months, respectively). In contrast, it almost doubled (P < 0.01) in Poll Dorset sired lambs between age groups with values of 1.37 ± 0.19 mm and 2.46 ± 0.18 mm at 4 and 16 months, respectively.
Basal lactate
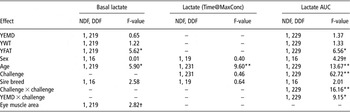
The final models derived for basal lactate and lactate AUC 0 to 10 min are described in Table 2.
F-values for the effect of YEMD, YWT and YFAT ASBVs, age, challenge and sire breed on basal, time to maximum concentration (Time@MaxConc) and AUC (mM/10 min) blood lactate parameters

YEMD = yearling muscle; YWT = yearling weight; YFAT = yearling fat; ASBVs = Australian sheep breeding values; AUC = area under curve; NDF = numerator d.f.; DDF = denominator d.f. †P < 0.10; *P < 0.05; **P < 0.01.
Basal lactate increased (P < 0.01; Table 2) by about 15% from 4 to 16 months of age (0.68 ± 0.06 v. 0.78 ± 0.06 mM). Selection for leanness decreased (P < 0.05) basal lactate by about 30% or 0.3 mM across the range of YFAT.
Lambs with larger EMA had lower basal lactate levels (P < 0.1, Table 2), decreasing by about 0.04 ± 0.02 mM for every 1 cm2 increase in EMA, or a decrease of around one-third basal lactate concentration from the lambs with the smallest EMA of 700 mm2 (0.897 ± 0.11 mM) to the greatest EMA of 1500 mm2 (0.565 ± 0.12 mM). Correcting for EMA within the model did not diminish the age or sire breed effects on lactate. LW and C-site fat had no effects.
Lactate time to maximum concentration
No ASBV driven responses impacting on lactate time to maximum concentration were significant (P < 0.1). At 16 months of age, the lambs took around 70% longer to reach maximum lactate concentration (P < 0.01; Table 2) than at 4 months of age (11.28 ± 1.12 v. 6.47 ± 1.14 min). Animals with high levels of C-site fat depth took almost twice as long to reach maximum lactate concentration than leaner counterparts, with the time to maximum lactate concentration increasing by around 2.37 ± 1.19 min for every 1 mm increase in C-site fat depth (P < 0.05; Table 2).
Lactate AUC
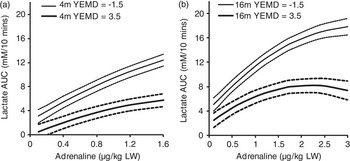
Following adrenaline challenges, the lactate AUC was about 30% greater (P < 0.001; Table 2) for the 16-month-old lambs compared with their response at 4 months of age. Selection for muscling reduced (P < 0.01; Table 2) lactate AUC by at least 50% across the range of YEMD (Figure 2). This effect was apparent at both ages and across all levels of adrenaline challenge. Selection for leanness also decreased (P < 0.05; Table 2) the amount of lactate produced by about 1.38 ± 0.54 mM/10 min for each unit decrease in YFAT, which was equivalent to a reduction of around 30% across the range of YFAT.
The effect of adrenaline challenge and sire muscling Australian sheep breeding value of yearling eye muscle depth at −1.5 (low muscling) and 3.5 (high muscling) on lactate area under curve (AUC) to 10 min (AUC mM/10 min) within (a) 4 and (b) 16-month-old Merino and Poll Dorset cross sheep. Lines represent least square means (- - - represent ± s.e.).

Sheep EMA increased (P < 0.05) the lactate AUC response to adrenaline by around 20% across the EMA range, with an increase of 0.38 mM/10 min per EMA increase of 1 cm2. The inclusion of this term in the final model (model not shown) did not change the magnitude of lactate AUC (mM/10 min) response shown above for YFAT and YEMD ASBV, age or challenge.
Basal NEFA
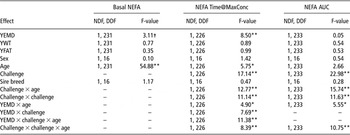
The final models derived for basal NEFA, time to maximum NEFA concentration and NEFA AUC 0 to 10 min are described in Table 3.
F-values for the effect of YEMD, YWT and YFAT ASBVs, age, challenge and sire breed on basal, time to maximum concentration (Time@MaxConc) and AUC (mM/10 min) blood NEFA parameters

YEMD = yearling muscle; YWT = yearling weight; YFAT = yearling fat; ASBVs = Australian sheep breeding values; AUC = area under curve; NEFA = non-esterified fatty acids; NDF = numerator d.f.; DDF = denominator d.f.
†P < 0.10; *P < 0.05; **P < 0.01.
Basal NEFA levels were about 0.025 mM lower (P < 0.0001; Table 3) at 16 months compared with 4 months. Selection for muscling decreased (P < 0.1) the levels of basal NEFA across the YEMD range by about 0.015 mM at both ages (Table 3).
NEFA time to maximum concentration
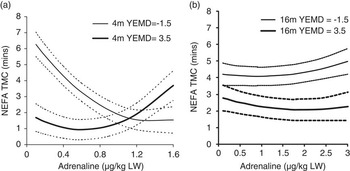
Lower time to maximum NEFA concentration was seen in lambs from high YEMD ASBV sires for all challenges in the 16-month-old animals, but only in adrenaline challenges below 1.0 μg/kg LW for the younger 4-month-old animals (P < 0.01; Figure 3).
The effect of adrenaline challenge and sire muscling Australian sheep breeding value of yearling eye muscle depth at −1.5 (low muscling) and 3.5 (high muscling) on non-esterified fatty acids time to maximum concentration (NEFA TMC) within (a) 4 and (b) 16-month-old Merino and Poll Dorset cross sheep. Lines represent least square means (- - - represent ± s.e.).

NEFA AUC
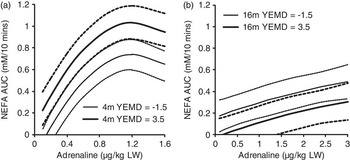
The level of adrenaline challenge, sire YEMD and age affected the NEFA AUC (Table 3; P < 0.05) as shown in Figure 4. NEFA AUC increased five-fold (P < 0.01; Table 3) across the range of adrenaline challenges used in this study. In 4-month-old lambs, NEFA AUC was greater in lambs with the highest sire YEMD, with a difference of about 0.3 mM/10 min across the entire range of adrenaline challenges. The NEFA AUC generally decreased with age with a much larger reduction in lambs from the highest YEMD sire group such that at 16 months of age there was no difference due to sire YEMD.
The effect of adrenaline challenge and sire muscling Australian sheep breeding value of yearling eye muscle depth at −1.5 (low muscling) and 3.5 (high muscling) on non-esterified fatty acids area under curve (NEFA AUC mM/10 min) within (a) 4 and (b) 16-month-old Merino and Poll Dorset cross sheep. Lines represent least square means (- - - represent ± s.e.).

Basal NEFA increased the NEFA AUC response to adrenaline (P < 0.01) by about 0.33 ± 0.076 mM/10 min for each 0.1 mM increase in basal NEFA. When basal NEFA was included in the final model it had no impact on any of the other NEFA AUC responses effects described.
Basal glucose
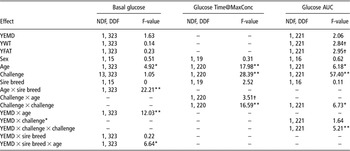
The final models derived for basal glucose and glucose AUC 10 min are described in Table 4.
F-values for the effect of YEMD, YWT and YFAT ASBVs, age, challenge and sire breed on basal, time to maximum concentration (Time@MaxConc) and AUC (mM/10 min) blood glucose parameters

YEMD = yearling muscle; YWT = yearling weight; YFAT = yearling fat; ASBVs = Australian sheep breeding values; AUC = area under curve; NEFA = non-esterified fatty acids; NDF = numerator d.f.; DDF = denominator d.f. †P < 0.10; *P < 0.05; **P < 0.01.
Basal glucose concentrations decreased (P < 0.05; Table 4) with increasing YEMD ASBV, but only in the 4-month-old lambs. This effect was more pronounced (P < 0.05) in the 4-month-old Merino sired lambs, which decreased by about 16% from around 4.9 to 3.9 mM across the range of YEMD in this group, as opposed to the 4 month Poll Dorset sired lambs, which only decreased by about 9% and had a reduced range (4.4 v. 4.1 mM).
The effect of YEMD on basal glucose concentration appeared to be accounted for by the EMA of the animal, as YEMD became insignificant when EMA was included in the model. As with YEMD, there was little effect of EMA in Poll Dorset sired lambs; however, for the Merinos the impact of EMA varied with age (P < 0.01). At 4 months of age, EMA correlated with a decrease in basal glucose concentration of 0.1 mM per 100 mm2 of EMA, and at 16 months of age correlated with an increase of 0.12 mM per 100 mm2 of EMA.
C-site fat depth correlated with an increase (P < 0.0001) in basal glucose concentration, but only in 4-month-old lambs, with an increase of about 1.2 mM across the 2 mm range of fat depth seen in this study (model not shown).
Glucose time to maximum concentration
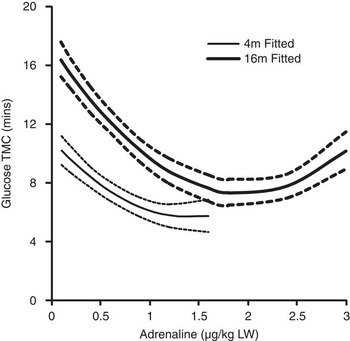
The time to maximum glucose concentration decreased (P < 0.01) with increasing adrenaline challenge, reaching a plateau at adrenaline challenges of about 1.2 and 1.8 μg/kg LW for 4- and 16-month-old lambs, respectively (Figure 5). For both ages, this time to maximum concentration was between 6 and 8 min.
The effect of adrenaline challenge on glucose time to maximum concentration (Glucose TMC (min)) within 4 and 16-month-old Merino and Poll Dorset cross sheep. Lines represent least square means (- - - represent ± s.e.).

Live weight and C-site fat depth had no effect on time to maximum glucose concentration. Increasing EMA was associated with an increase in time to maximum glucose concentration (P < 0.05) with a 0.55 ± 0.27 mM increase per 1 cm2 increase or by about 70% at both ages across the EMA range. The inclusion of EMA had no effect on the significance of other terms in the model.
Glucose AUC
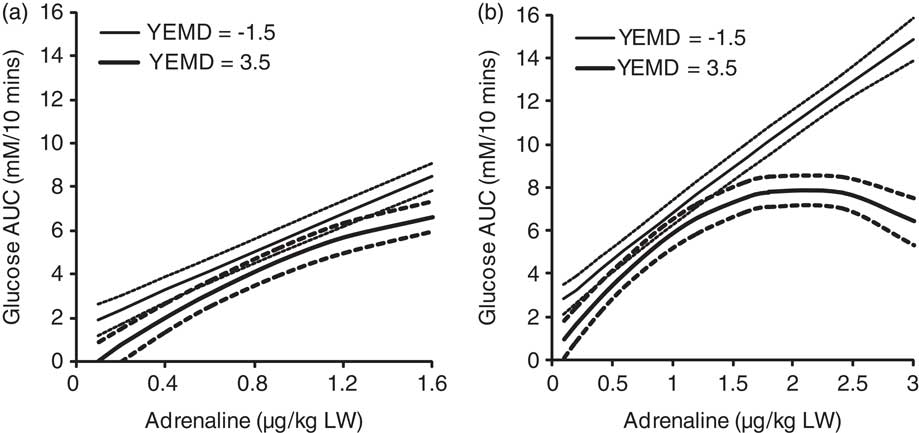
Glucose AUC increased (P < 0.01; Table 4) across the range of adrenaline challenges used in this study. At 4 months of age, the lambs were only challenged up to a maximum of 1.6 μg/kg LW, and across this range of challenge showed a response that was about 0.9 mM/10 min lower (P < 0.05) than the 16-month-old age group.
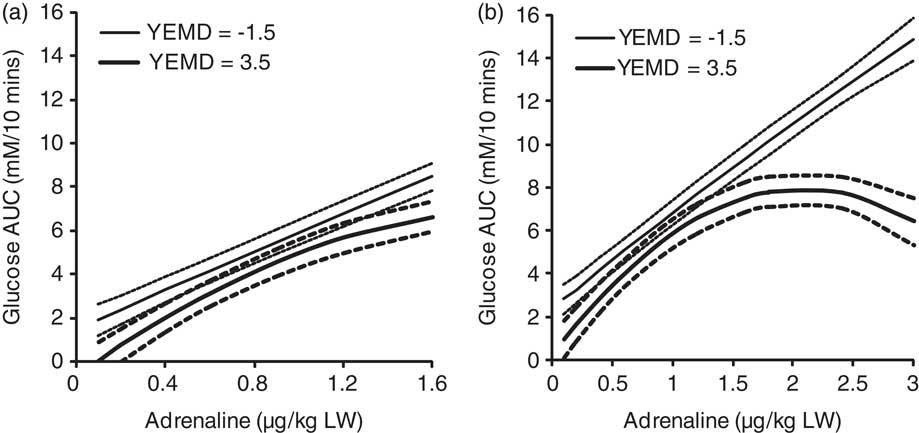
Progeny sired by rams with a higher YEMD ASBV showed a reduced glucose AUC response (P < 0.05; Table 4) to adrenaline (Figure 6). This effect was relatively subtle up to a challenge of 1.2 μg/kg LW, with differences of between 1.2 mM/10 min when comparing the high and low extremes of YEMD. However, at the higher challenges (1.8 to 3.0 μg/kg LW) the lambs from sires with high YEMD reached a plateau, whereas the low YEMD sires continued to respond linearly. Thus, at the 3 μg/kg LW challenge the low YEMD sires showed double the response compared with the high YEMD sires. Given that only the 16-month-old lambs were administered adrenaline challenges >1.6 μg/kg LW, it is unclear whether the marked effect of YEMD ASBV seen at the higher levels of challenge would have also been present in the 4-month-old lambs.
The effect of challenge and sire muscling Australian sheep breeding value of yearling eye muscle depth at −1.5 (low muscling) and 3.5 (high muscling) on glucose area under curve (glucose AUC mM/10 min) in Merino and Poll Dorset cross sheep at (a) 4 and (b) 16 months of age. Lines represent least square means (- - - represent ± s.e.).
YWT and YFAT ASBVs both had a small impact (P < 0.1; Table 4) on glucose AUC, increasing it by 0.078 ± 0.046 mM/10 min per unit of YWT, and by 0.516 ± 0.300 mM/10 min per unit of YFAT, with these effects consistent across the range of challenges in this study.
Basal glucose impacted on glucose AUC (P < 0.01), decreasing total responses by 0.995 ± 0.36 mM/10 min per unit increase in basal glucose concentration. Basal glucose had no effect on any of the other terms in the model.
Discussion
The effect of selection for muscling, leanness and growth on muscle metabolism
The lactate response to adrenaline indicated that selection for muscling in sheep reduced the muscle response to adrenaline at both 4 and 16 months of age. This was contrary to our initial hypothesis in which we assumed that the greater muscling potential of high YEMD sires would increase the proportion of fast glycolytic type IIX myofibres, resulting in a greater glycogenolytic capacity to respond to adrenaline (Saltin and Gollnick, Reference Saltin and Gollnick1983). Rather our results suggested that as hypothesised, the intrinsic enzymatic capacity of the muscle due to variations in myofibre proportions was not a key determinant of adrenaline responsiveness.
An alternative hypothesis may be associated with the density of adrenergic β-receptors. Research conducted in rats (Martin et al., Reference Martin, Murphree and Saffitz1989) showed an increased density of β-receptors in oxidative muscle types. Given that sheep selected for muscling have decreased proportions of oxidative myofibres (Greenwood et al., Reference Greenwood, Gardner and Hegarty2006), it is likely that this would have decreased the β-receptor density. In rats, the receptor affinity was similar between muscle fibre types (Jensen et al., Reference Jensen, Alvardado, Pirkusny and Geary1995), and therefore the size of the response would primarily depend on receptor density. Thus, selection for muscling may have reduced the muscle response to adrenaline as oxidative muscle types were reduced and therefore there may be a decreased density of β-receptors. This mechanism appears to be more important than the intrinsic metabolic capacity, and in particular greater glycogenolytic capacity of muscle, which has greater proportions of Type IIX myofibres. Complimentary to our findings, Gardner et al. (Reference Gardner, Martin, McGilchrist and Thompson2005) found that young growing steers with high muscling potential were less responsive to adrenaline within their muscle tissue.
In parallel with this result, the use of low YFAT sires resulted in lambs that took less time to reach maximum lactate levels, and were associated with lower maximum concentrations in response to adrenaline challenge. Similar to selection for muscling effects, selection for leanness has also been shown to increase the relative proportion of muscle to fat in sheep carcases (Kadim et al. Reference Kadim, Purchas, Rae and Barton1989; Hegarty et al., Reference Hegarty, Hopkins, Farrell, Banks and Harden2006b), as well as decreasing the proportion of oxidative to glycolytic muscle fibres in sheep (Greenwood et al., Reference Greenwood, Gardner and Hegarty2006). Thus, it appears likely that a similar mechanism to that described above, where a change in muscle metabolism associated with β-receptor density, may have caused this difference.
These findings have implications for maximising muscle glycogen pre-slaughter and thus meat quality. Selection for muscling may result in lambs that have a reduced propensity to mobilise glycogen in the event of stress and therefore will be less likely to result in dark cutting meat.
Selection for muscling on adipose tissue
Our results showed that lambs from high YEMD sires were faster at reaching maximum NEFA concentrations at both 4 and 16 months of age. The NEFA AUC results also showed that selection for muscling increased the adipose response to adrenaline, a result only evident in the younger animals. Again this rejected our initial hypothesis, which proposed that NEFA response to adrenaline would simply reflect whole body fatness (Murray et al., Reference Murray, Granner, Mayes and Rodwell2000), which had been shown to be lower in high muscled lambs (Hegarty et al., Reference Hegarty, Hopkins, Farrell, Banks and Harden2006b). Across the relatively small flock used in this study, the use of high YEMD sires had no discernable impact on fatness, thus the expected response was not likely to occur.
Alternatively, the adipose tissue of lean sheep has been shown to have greater levels of vascularisation, which may potentiate the rate of activation of adrenaline-induced lipolysis and thus the extent of the response (Gregory et al., Reference Gregory, Christopherson and Lister1986). Our results provide some support for this theory, evidenced by the faster time to maximum concentration in response to adrenaline seen in the lambs with larger EMA. This was particularly apparent in the 4-month-old lambs at the lower adrenaline challenges, where they are more likely to underpin a chronic tissue partitioning effect resulting in reduced fat deposition. Furthermore, the adipose tissue of obese humans (Jocken and Blaak, Reference Jocken and Blaak2008) have shown a reduced adrenaline responsiveness, which reduces lipolysis and thus potentiates obesity. If the reverse were to apply in young lean animals, then this combined with greater vascularisation may have elicited the responses reported here.
In a more applied sense, the heightened adipose tissue responsiveness of the young highly muscled sheep is likely to result in greater rates of lipolysis and increased turnover of triacylglycerol. It is possible that this mechanism contributes to the well documented phenotypic observation that animals selected for muscling have less whole body fat, as reviewed by Warner et al. (Reference Warner, Pethick, Greenwood, Ponnampalam, Banks and Hopkins2007). Although not evident within the present group of experimental animals, the sample size of this flock can be considered too small for a crude phenotypic measure such as fat depth to be significant.
Selection for muscling on liver
Our results showed that progeny from high YEMD sires had reduced glucose release in response to adrenaline challenge, especially at the higher levels of challenge in the older animals. This is in contrast to our initial hypothesis that there would be no effect of selection for muscling on the liver glycogen metabolism. This hypothesis was derived largely due to a lack of information with regard to the ruminant liver gluconeogenesis and genetic variation in its response to adrenaline.
In ruminants, liver gluconeogenesis is the only source of glucose to dependent tissues such as the brain, type IIX muscle myofibres, uterus and mammary gland (Leng, Reference Leng1970; Church, Reference Church1979; Weekes, Reference Weekes1979). Although glucose is used as an indicator of the liver's response to adrenaline, the methodology used in this study does not differentiate between glucose delivered into the blood from gluconeogenesis in the liver or kidney or from glycogenolysis in the liver. Thus, the reduced glucose output due to selection for muscling may be linked to any one or a combination of these glucose sources; however, reduced liver gluconeogenesis as a result of lower circulating growth hormone is a possible cause of this effect. Progeny from high muscling sires have shown reduced growth rates to weaning, reduced bone growth and increased muscle-to-bone ratio (Cake et al., Reference Cake, Gardner, Hegarty, Boyce and Pethick2006; Hegarty et al., Reference Hegarty, Shands, Marchant, Hopkins, Ball and Harden2006a), all suggestive of reduced growth hormone. Furthermore, studies using growth hormone transgenic sheep reported a decrease in eye muscle depth due to increased growth hormone (Adams et al., Reference Adams, Briegel and Ward2002). These findings suggested a link between lower growth hormone levels in high muscling sheep genotypes. Growth hormone is an important driver of nutrient partitioning between storage tissues such as the liver, muscle and adipose, and when administered exogenously causes increased rates of gluconeogenesis in dairy cows (Knapp et al., Reference Knapp, Freetly, Reis, Calvert and Baldwin1992). Thus, reduced levels of growth hormone in high muscling genotype sheep may underpin the reduced glucose output evidenced in response to adrenaline challenge in this study.
In the Australian sheep meat industry, the suspected decreased gluconeogenic capacity will have impacts on the management of highly muscled animals. A reduced ability to synthesise glucose in the liver, the only source of this obligatory carbohydrate would impact on the tissues that are dependent on it for survival plus other compounds that use the carbon in glucose as a building block, such as glucogenic amino acids. Therefore, the broader metabolic and production influence of this finding may impact on production efficiency of animals of this type.
Effects of age and sire breed
Basal plasma lactate concentrations and muscle response to adrenaline as indicated by lactate production increased as the animals aged. We originally proposed that lactate production would decrease with age due to more oxidative muscle types. Our current results could be due to simply an increase in muscle mass and proportion of liveweight producing more lactate; however, when both these factors were corrected for, the age difference was still observed. This also may be due to older animals tending to mobilise muscle glycogen as a maintenance energy source rather than adipose tissue, which is reserved, as reflected by the increased muscle response due to adrenaline challenge in the older animals. It is difficult to discern and further research may be warranted.
However, it is important to note that the NEFA response increased in size with age as well, as was expected from our original hypothesis. These findings may suggest a complexity in which older animals’ maintenance energy supplies are met, and tissue sources targeted by adrenaline for ‘flight or fight’ responses. There was no difference between breeds at 14 months of age, therefore the mechanism causing the difference between breeds at weaning was reduced or eliminated with maturity. The lack of difference between the crossbred and purebred animals at 14 months of age may also be due to the similarity in C-site fatness.
As would be expected, the lambs LW and EMA increased with age, with Poll Dorset sired lambs being heavier and with larger EMA than Merinos at both ages. Merino lambs did not become fatter with age, whereas Poll Dorset cross lambs doubled their fat cover. This has important meat quality implications as fat contains the species flavour components and is important for managing carcase temperatures during pH decline to optimise ultimate pH and meat tenderness. Although a lack of fat can result in cold shortening, too much fat leads to poor carcase yields and is aesthetically unappealing for customers. The levels of fat found in this study are lower than those seen in the majority of carcases (Hopkins and Fogarty, Reference Hopkins and Fogarty1998), which may be a reflection of the intensive handling of the animals.
Basal substrates
Basal substrate levels had varied impacts on subsequent responses to adrenaline challenge. In the case of NEFA and glucose, higher basal levels resulted in reduced AUC response of the same substrate to adrenaline challenge. This may be due to upregulated homeostatic controls such as increased circulating insulin in response to higher substrate levels depressing responses to the exogenous adrenaline challenge. They may also indicate a higher level of background stress associated with the challenge technique causing increased endogenous adrenaline prior to the challenges taking place. This would have reduced the scope for further responses to an exogenous dose of adrenaline.
Lower basal lactate levels were associated with less time taken to reach maximum lactate concentration. This may be due to the muscle tissue being less responsive to adrenaline in general, and is supported by the reduced lactate response due to adrenaline challenge.
The use of high YEMD sires led to progeny with lower basal glucose and NEFA concentrations. Phenotypically high muscled and leaner lambs also had lower basal lactate and glucose levels. This could indicate that the higher muscled, leaner lambs were depositing circulating glucose within the muscle and liver tissue as glycogen, which was supported by the substitution of EMA for YEMD in the model, with both terms correlating with a similar effect. When circulating adrenaline increases, these phenotypes appeared to use adipose as the preferred energy source in preference to muscle glycogen, as seen in the increased NEFA response and reduced lactate response.
Lower basal glucose concentrations can be caused by a number of facts including dietary absorption of glucose, rates of endogenous glucose production, as well as the glucagon to insulin ratios and tissue sensitivity to these hormones (Brockman and Laarveld, Reference Brockman and Laarveld1986). This study was not focused on determining drivers of basal levels of these substrates; however, the area warrants further investigation. It is important to note that the inclusion of basal glucose in the models for glucose response to adrenaline challenge did not impact on the effects seen by other drivers such as selection for muscling and age.
Our results showed that fatter animals and those from high YFAT sires had higher basal glucose. A theory may be that these animals are more inclined to mobilise liver glycogen as a maintenance energy source than adipose tissue, as indicated by the increased glucose response. This supports the findings for selection for muscling, which is associated with leanness resulting in lower basal glucose.
Acknowledgements
The authors thank the Australian Sheep CRC and Meat & Livestock Australia for project support and funding, as well as the assistance of the UNE Animal Science Department technical staff, particularly Sheridon Moll and Andrew Slacksmith during sample collection and analysis. Taron Brearley assisted in the development of the modelling equations, and is thanked for his contribution.