Introduction
Land use and land cover perform a vital role in regulating global biodiversity. Current evidences demonstrate that land-use change has impaired most ecosystem functions, including nutrition provisioning for wild animals and plants, maintenance and regulation of water flow, and pollination services. Nevertheless, the predation rates and predator-prey interactions in changing landscapes are relatively less understood (Brock et al., Reference Brock, Cini and Sumner2021; Haan et al., Reference Haan, Zhang and Landis2020). A recent meta-analysis illustrates that pest suppression often remains heterogeneous across studies, showing inconsistent trends to land-use change, despite some positive associations between semi-natural landscapes and predatory populations have been evidenced, with a reduced level of phytophagous arthropod populations (Haan et al., Reference Haan, Zhang and Landis2020; Karp et al., Reference Karp, Chaplin-Kramer, Meehan, Martin, DeClerck, Grab, Gratton, Hunt, Larsen and Martínez-Salinas2018; Lemessa et al., Reference Lemessa, Hambäck and Hylander2015). It is still largely under-evaluated about the effect of land-use change on predation of insects.
While the yellow-legged hornet Vespa velutina var. nigrithorax Lepeletier, 1836 is considered an invasive species in European and East Asian countries due to its detrimental impacts on honey bees and other pollinators (Perrard et al., Reference Perrard, Haxaire, Rortais and Villemant2009; Verdasca et al., Reference Verdasca, Godinho, Rocha, Portocarrero, Carvalheiro, Rebelo and Rebelo2022), it is nowadays successfully reared as edible insects in Southeast Asia, particularly in China (Van Itterbeeck et al., Reference Van Itterbeeck, Feng, Zhao, Wang, Tan, Saga, Nonaka and Jung2021). Hornet farmers often maintain large population sizes (e.g. over 60 colonies) to maximise the production of pupae and larvae, without considering their ecological consequences on ecosystems. This practice increases the number of predators in ecosystems, potentially exerting environmental pressure on insect diversity and disrupting ecosystem functioning. Thus, it is important to understand the diets of reared yellow-legged hornets in changing landscapes.
The dietary diversity of hornets varies greatly depending on the hornet species (Brock et al., Reference Brock, Cini and Sumner2021; Lefort et al., Reference Lefort, Beggs, Glare, Saunders, Doyle and Boyer2020; Schmack et al., Reference Schmack, Lear, Astudillo‐Garcia, Boyer, Ward and Beggs2021), the season (Sackmann et al., Reference Sackmann, D’Adamo, Rabinovich and Corley2000; Schmack et al., Reference Schmack, Lear, Astudillo‐Garcia, Boyer, Ward and Beggs2021; Stainton et al., Reference Stainton, McGreig, Conyers, Ponting, Butler, Brown and Jones2023), and local habitats (Rome et al., Reference Rome, Perrard, Muller, Fontaine, Quilès, Zuccon and Villemant2021; Stainton et al., Reference Stainton, McGreig, Conyers, Ponting, Butler, Brown and Jones2023; Villemant et al., Reference Villemant, Muller, Haubois, Perrard, Darrouzet and Rome2011; Ward and Ramón-Laca, Reference Ward and Ramón-Laca2013). Since hornets are centre place foragers, their diets are likely influenced by the abundance and diversity of arthropods within their foraging ranges at the landscape scale (e.g. Rome et al., Reference Rome, Perrard, Muller, Fontaine, Quilès, Zuccon and Villemant2021). Nevertheless, most studies on hornet diets were conducted at local small scales, such as patch scale and site scale (Ward and Ramón-Laca, Reference Ward and Ramón-Laca2013; Wilson et al., Reference Wilson, Looney, Tembrock, Dickerson, Orr, Gilligan and Wildung2023), and the effect of landscape composition on dietary diversity of hornets remains largely unexplored. Indeed, current evidences have demonstrated higher arthropod diversity and biomass in forests and grasslands compared to agricultural and urbanised lands (Outhwaite et al., Reference Outhwaite, McCann and Newbold2022; Uhler et al., Reference Uhler, Redlich, Zhang, Hothorn, Tobisch, Ewald, Thorn, Seibold, Mitesser and Morinière2021). Therefore, the dietary diversity of reared hornets is likely to be higher in landscapes with a high proportion of green land covers (e.g. forests, grasslands and shrublands) than those landscapes with a low proportion of green land covers (e.g. agricultural or urbanisation landscapes).
To date, the impact of landscape composition on dietary diversity of reared yellow-legged hornets remains poorly understood. Metabarcoding, coupled with high-throughput DNA sequencing, is a highly efficient and cost-effective method for elucidating prey contents and dietary diversity of predators (King et al., Reference King, Read, Traugott and Symondson2008; Pompanon et al., Reference Pompanon, Deagle, Symondson, Brown, Jarman and Taberlet2012). The larvae of yellow-legged hornets expel their gut contents (meconia) during the prepupal stage (Matsuura and Yamane, Reference Matsuura and Yamane1990; Rome et al., Reference Rome, Perrard, Muller, Fontaine, Quilès, Zuccon and Villemant2021), which can be used to reveal the hornet’s prey contents (Liu et al., Reference Liu, Clarke, Baker, Jordan and Burridge2020; Symondson, Reference Symondson2002). Therefore, this study investigated the effect of landscape composition on dietary diversity of reared yellow-legged hornets. Two questions were addressed: 1. did the landscape composition (e.g. the percentage of green lands) influence the dietary diversity of reared yellow-legged hornets along a gradient of green land covers? We hypothesised that higher green land coverage would enhance both alpha and beta diversity in the hornets’ diet. 2. Which factors, landscape composition and local distance, influence the dissimilarity of the prey community of yellow-legged hornets? We measured the distances from the hornet-rearing sites to the nearest green lands and buildings. We hypothesised that the percentage of green lands at the landscape scale, rather than the distances to green lands and buildings, regulated the dissimilarity of prey components of yellow-legged hornets.
Methods
Study sites
In 2023, we selected a total of 12 landscapes from Kunming (102o45’E, 25o06’N), Yunnan Province, China, to study the effect of landscape composition on the dietary diversity of reared yellow-legged hornets (fig. 1). The study region was composed of a mosaic of broad-leaved forests, coniferous forests, grasslands, shrublands, farmlands, human-modified structures (e.g. buildings, roads and factories) and water bodies. The 12 study sites were surrounded by a gradient of green lands ranging from 0.057 (e.g. urbanisation landscapes) to 0.909 (e.g. forest landscapes). The average distances between study sites were 20.81 km, with a minimum distance of 7.81 km, ensuring spatial independence among the sites.
The 12 landscapes in Kunming, Yunnan Province, China. A. study region in Yunnan Province, China; B. the 12 landscapes in Kunming, Yunnan Province; C. nests of reared yellow-legged hornets in a forest landscape; D. nests of reared yellow-legged hornets in a remnant green land (grass and wood mixture) in an urban landscape; E. the land covers of the 12 landscapes, characterised by a gradient of green lands. Green: green lands, including forests, grasses and shrubs; white: other land covers, including buildings, arable lands, roads and water.

For each of the 12 sites, an average of 86 nests (range: 40–120 nests) of yellow-legged hornets V. velutina var. auraria were placed at the centre of the landscapes. Wild populations of these hornets existed in the ecosystems, but they were quite low due to intensive anthropogenic hunting in recent years (personal observations). The larvae and pupae of hornets were popular edible insect resources on farmer markets for sale. The number of reared colonies was positively correlated with the percentage of green lands (r = 0.669, p = 0.02) and negatively correlated with the percentage of buildings (r = −0.657, p = 0.02), suggesting that the hornet farmers and keepers intentionally maintained their colonies based on landscape quality. All the hornets in our study were from reared colonies. Insecticides were never applied toward the colonies, but were used within nearby farmlands, which had a far distance (>500 m) away from the hornet-hanging sites.
Faecal samples, DNA extraction, amplification, and sequencing
At each site, we selected three nests of reared yellow-legged hornets to collect faeces deposited at the base of brood cells. We chose the 5 th-7th layers of the nest combs, which contained faeces excreted by larvae fed in July and August, representing the peak of their hunting activity (e.g. Rome et al., Reference Rome, Perrard, Muller, Fontaine, Quilès, Zuccon and Villemant2021). Three faecal pellets were randomly removed from the round sides of combs (avoiding reused cells) using flame-sterilised forceps and then deposited in a 5 ml sterilised tube (Lefort et al., Reference Lefort, Beggs, Glare, Saunders, Doyle and Boyer2020). For each landscape, a total of 6 tubes containing 18 faecal pellets were sampled, resulting in 216 faecal pellets across the 12 landscapes.
DNA was extracted using the E.Z.N.A™ Mag-Bind Soil DNA Kit (Omega, USA) following the manufacturer’s instructions and procedures. DNA concentrations were measured by the Qubit 4.0 (Thermo, USA), and all samples were satisfied for amplification. We used the two universal primers (m1COIintF: 5’-GGWACWGGWTGAACWGTWTAYCCYCC-3’; HCO2198: 5’-TAAACTTCAGGGTGACCAAAAAATCA-3’) to amplify a short gene region (313 bp) on the mitochondria COI gene (Brandon-Mong et al., Reference Brandon-Mong, Gan, Sing, Lee, Lim and Wilson2015; Leray et al., Reference Leray, Yang, Meyer, Mills, Agudelo, Ranwez, Boehm and Machida2013; Schmack et al., Reference Schmack, Lear, Astudillo‐Garcia, Boyer, Ward and Beggs2021). The PCR reaction mixture contained 2 μl faecal DNA extraction (10 ng/μl), 1 μl forward primer (10 μM), 1 μl reverse primer (10 μM), 15 μl 2 × Hieff® Robust PCR Master Mix (Yeasen, China) and 11 μl distilled water to fill the extract up to total 30 μl. The PCR reaction began with 1 cycle of denaturing at 95°C for 3 min, followed by 5 cycles of denaturing at 95°C for 30 s, annealing at 45°C for 30 s, elongation at 72°C for 30 s, then 20 cycles of denaturing at 95°C for 30 s, annealing at 55°C for 30 s, elongation at 72°C for 30 s and a final extension at 72°C for 5 min. The PCR products were electrophoresed in 2 % (w/v) agarose gels stained with ethidium bromide and visualised under UV light. The Hieff NGS™ DNA Selection Beads (Yeasen, China) were used to purify the PCR products. About 20–30 ng purified products were used as template for the second amplification reactions. Library constructions were conducted by the Sangon BioTech (Shanghai) using universal Illumina adaptor and index. High-throughput sequencing was performed using the Illumina Nextseq 2000 (Illumina, USA) according to the manufacturer’s instructions.
Bioinformatics
Raw reads were demultiplexed, and primers and barcodes were stripped using the software CUTADAPT (version 0.9.8). The two short paired-reads were assembled by the software PEAR (version 0.9.8) based on their overlaps. Using the software USEARCH (version v11.0.667), we filtered the sequences by a maximum expected error threshold of 0.50 and a minimum length of 310 to reduce potentially sequencing errors and amplification errors (e.g. chimeras) (Jin et al., Reference Jin, Liu and Shiroguchi2024). The sequences were then reduced by dereplicating and discarding low abundance sequences (<8 total counts across the 72 samples) (e.g. Schmack et al., Reference Schmack, Lear, Astudillo‐Garcia, Boyer, Ward and Beggs2021; Zhang et al., Reference Zhang, Grube and Wei2023). The unique sequences were clustered to Operational Taxonomic Units (OTUs) based on sequence identity threshold of 97% (Edgar, Reference Edgar2013, Reference Edgar2018), which were then mapped to the merged reads to achieve the OTU table. All samples were rarefied to the minimum sample size. The OTUs were blasted against the Barcode of Life Data (Ratnasingham and Hebert, Reference Ratnasingham and Hebert2007), with sequence identity greater than 98% typically assigned to the genus level and greater than 80% identity typically assigned to the phylum level (Jin et al., Reference Jin, Liu and Shiroguchi2024; Schmack et al., Reference Schmack, Lear, Astudillo‐Garcia, Boyer, Ward and Beggs2021). Only the OTUs identified as metazoan were retained for further analysis after removing fungi, genus Vespa and Polistes. The influence of landscape composition on dietary diversity was analysed at the kingdom level (e.g. Arthropoda, Chordata, Nematoda et al.), the phylum level (e.g. Insecta, Arachnida, Copepoda et al.) and the class level (e.g. Diptera, Coleoptera, Lepidoptera et al.) respectively, avoiding more lower taxonomic levels due to the potential of inaccurate annotation.
Land usage and spatial analysis
Land use and land cover were derived from the ETM+ satellite image token on May 9, 2024. The lands were simply classified into water, urban, farmlands, forests and grasses using the software ENVI 5.3 (Exelis Visual Information Solutions, Inc., Boulder, CO, USA) using the maximum likelihood classification method, which achieved an overall accuracy of 93.23%. The forests included second-generation evergreen broadleaved trees, coniferous trees, and wood patches (e.g. permanent tree patches and temporary tree guards). The grasslands mainly contained wild grass lands, also including grass-shrub mixtures due to their similarly spectral reflectance and ecological functions in providing food resources for hornets. We calculated the percentage of green lands by measuring the area of forests and grasses relative to the total land area using the software ArcGIS 10.0 (Environmental Systems Research Institute, Redlands, CA, USA). Meanwhile, we also measured the percentage of buildings accounting for the overall land areas of landscapes, as well as the distances from the nests to the nearest semi-natural habitats and nearest buildings.
The scale of effect of different prey items was determined by calculating the correlation efficient between the diversity indicator and the percentage of green lands within buffer circles in radius of 100 m, 250 m, 500 m, 750 m, 1000 m, 1500 m, 1750 m, 2000 m, 2250 m, 2500 m, 2750 m, 3000 m, 3250 m, 3750 m and 4000 m. The cor.test() function in the stats packages (R Core Team, 2024) was used to test whether the diversity indicator was significantly correlated with the percentage of semi-natural habitats. We selected the buffer circle with the highest correlation coefficient as the scale of effect.
Statistical analysis
The rarefaction curve was used to detect the adequacy and completeness of sequencing, inferred by the shape of curves along the escalating in sample size (e.g. a flatted pattern). Since insects were the principle prey of reared yellow-legged hornets, we measured the alpha diversity, number of prey (OTUs), Chao1 and Shannon index at the class Insecta level, as well as the numbers of prey items (OTUs) within the Coleoptera, Lepidoptera, Hemiptera, Hymenoptera, Orthoptera and Diptera orders. The general linear model was conducted to examine the effect of percentage of green lands on alpha diversity at the spatial scale of effect.
The Bray-Curtis distance was selected to compute the dissimilarity matrix of prey communities (Faith et al., Reference Faith, Minchin and Belbin1987). We used the non-metric multidimensional scaling to reduce the multiple dimensions of prey communities into two dimensions, which achieved a stress of 0.196. The scores of samples on the first axis (MDS1) and the second axis (MDS2) were visualised using the ggplot2 package (Wickham, Reference Wickham2016). Analysis of similarities (ANOSIM) was conducted to test whether there were significant differences in prey community dissimilarity among the landscapes. Finally, we conducted the permutational multivariate analysis of variance using distance matrices (adonis2) to assess the effect of environmental factors (e.g. percentage of green lands, percentage of buildings, distance to the nearest green lands, and distance to the nearest building) on the prey community dissimilarity, using the vegan packages in R 4.4.1 (R Core Team, 2024).
Results
DNA sequencing and prey component
DNA was successfully amplified and sequenced for the 72 samples. We analysed a total of 6,946,645 reads (average 96,481 reads/sample, minimum 57,336 reads/sample), with 2,091 OTUs identified after filtering out 167 OTUs due to their low quality scores in annotations (less than 80% identity). Rarefaction curves almost reached their asymptotes (fig. 2), suggesting sufficient sampling for each landscape.
Rarefaction curve showing the number of OTUs along the number of reads.

The prey of yellow-legged hornets were overwhelmingly dominated by the phylum Arthropoda (95.26%) (fig. 3A); of those, 99.94% of OTUs were assigned to the class Insecta (fig. 3B). Dipterans, coleopterans, lepidopterans, hemipterans, hymenopterans and orthopterans collectively accounted for 95.05% of the OTUs, while mantodeans, blattodeans and odonatans, together with other insects, just accounted for only 4.95% of the prey (fig. 3C).
Number of prey (OTUs) identified from faecal samples of yellow-legged hornets at the kingdom (A), phylum (B) and class (C) taxonomic levels.

The 216 hornet colonies overall fed on honey bees, irrespective of their surrounding landscapes. Moreover, honey bees accounted for 13.34% of relative abundance, outweighing any other prey. The hornets also predated upon bumble bees (Bombus) and long-horned bees (Eucera), but their counts (read abundance) were relatively lower compared to honey bees.
Scale of effect
At the class Insecta level, the number of prey (OTUs), Chao1, Shannon index, as well as the number of coleopteran prey, lepidopteran prey, hemipteran prey, hymenopteran prey and orthopteran prey, all responded positively to the green lands at the spatial scale of 1,500 m, except for the number of dipteran prey, which responded positively at the spatial scale of 4,000 m (fig. 4). Moreover, the significant effects were detected for the number of prey and Chao1, as well as the number of coleopteran prey and lepidoptera prey, but neither for the Shannon index nor for the number of dipteran prey, hemipteran prey, hymenopteran prey and orthopteran prey (fig. 4).
Correlation coefficients between prey diversity and percentage of green lands measured at different spatial scales. Bubble size indicates the magnitude of correlation coefficient, with no significant effects showed in red and significant effects showed in blue. The scale of effect of different prey taxa (largest correlation coefficient) is showed by triangle.

Landscape effect on alpha diversity of prey
At the class Insecta level, the percentage of green lands had significant effects on the numbers of prey measured by OTUs (fig. 5A) and Chao1 (fig. 5B), but no effect on the Shannon index (fig. 5C). At the order level, the green lands had significant effects on the number of coleopteran prey (fig. 5D) and lepidopteran prey (fig. 5E), but no significant effect on the number of dipteran prey (fig. 5F), hemipteran prey (fig. 5G), hymenopteran prey (fig. 5H) or orthopteran prey (fig. 5I, table 1).
The number of prey (OTUs) (A–B and D–I) and Shannon index (C) measured at the class Insecta level (A–C) and order level (B–F) at the spatial scale of effect along the percentage of green lands.

Summary of results for general linear models assessing the impact of green lands on prey richness and diversity of yellow-legged hornets at different taxonomic levels

* Significant effects (p < 0.05) are marked in bold.
Landscape effect on beta diversity of prey
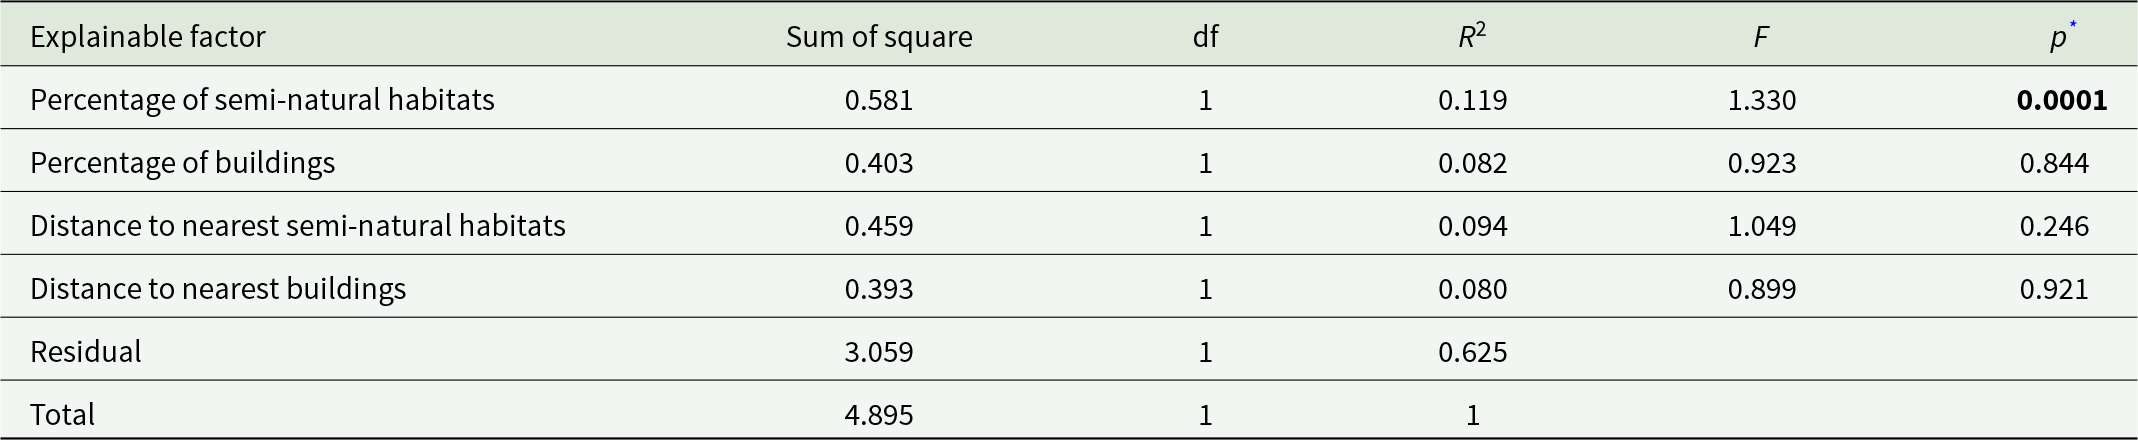
The nonmetric multidimensional scaling revealed a dissimilarity of the prey communities of reared yellow-legged hornets, despite some overlap in contents among landscapes (fig. 4A). ANOSIM indicated that the dietary components significantly differed among landscapes (R 2 = 0.801, p = 0.01), which was further supported by a higher value of compositional rank of dissimilarity between the groups than those within the groups (fig. 6B). Moreover, the permutational multivariate analysis of variance demonstrated that the percentage of semi-natural habitats was the only factor explaining the dissimilarity of dietary components, whereas the percentage of buildings, the distance to the nearest semi-natural habitats and the distance to the nearest buildings did not explain it (table 2).
Dissimilarity of dietary component of the yellow-legged hornet in the 12 landscapes measured by the nonmetric multidimensional scaling (NMDS) (A) and the rank of dissimilarity by comparing the between groups and within groups (B).

Local and landscape factors explaining the dissimilarity of dietary component using permutational multivariate analysis of variance

* The significant effect is marked in bold.
Discussion
Prey diversity in changing land use
As prediction, the prey richness of V. velutina increased along the percentage of green lands (fig. 5A,B). The dietary component reflected the insect species typically found in the surrounding landscapes (e.g. Sackmann et al., Reference Sackmann, D’Adamo, Rabinovich and Corley2000). It was well known that the hornets were opportunistic predators, being capable of adjusting their hunting tactics to target prey according to spatial distribution of prey in the field (Barrows, Reference Barrows2021; Richter, Reference Richter2000). Since the green lands had a high diversity of arthropods (Outhwaite et al., Reference Outhwaite, McCann and Newbold2022; Uhler et al., Reference Uhler, Redlich, Zhang, Hothorn, Tobisch, Ewald, Thorn, Seibold, Mitesser and Morinière2021), there was more opportunity for the hornets to prey upon arthropods in landscapes with abundant green lands. However, contrary to our prediction, we did not find a significant effect of green lands on Shannon index of prey community (fig. 5C). The Shannon index was mathematically calculated based on species composition and their relative abundance (Shannon, Reference Shannon1948; Shannon and Weaver, Reference Shannon and Weaver1949). Metabarcoding data, derived from high-throughput sequencing, provided semi-quantitative read counts that might not accurately represent the absolute abundance of prey consumed by the predators (e.g. Deagle et al., Reference Deagle, Thomas, McInnes, Clarke, Vesterinen, Clare, Kartzinel and Eveson2019; Lamb et al., Reference Lamb, Hunter, Pinnegar, Creer, Davies and Taylor2019; Pompanon et al., Reference Pompanon, Deagle, Symondson, Brown, Jarman and Taberlet2012). Therefore, this could introduce biases when using relative abundance data.
Diptera, Coleoptera, Lepidoptera, Hemiptera, Hymenoptera and Orthoptera were the most consumed orders by the yellow-legged hornets. We found that those prey responded differently to the green lands in terms of spatial scale of effect (fig. 4) and species richness (fig. 5). The richness of coleopteran prey and lepidopteran prey significantly increased along the percentage of green lands, while other orders did not show a significant change. The different response could be attributed to differences in their life traits. For instance, most coleopteran insects and lepidopteran insects were phytophagous, mainly feeding on plants, making them more accessible to yellow-legged hornets in landscapes with abundant green lands. Despite hemipteran insects, hymenopteran insects and orthopteran insects also responded positively to the seminatural habitats (Montagnana et al., Reference Montagnana, Alves, Garófalo and Ribeiro2021; Steffan-Dewenter, Reference Steffan-Dewenter2002), the richness of those prey was relatively low (often less than 20 OTUs per site) (fig. 5). Notably, the low number of those preys likely did not indicate low diversity or abundance of those preys in habitats, but potentially suggested a dietary preference, with a low selection for these orders.
Our study indicated that the dipteran prey accounted for the highest species richness (OTUs) of the prey community (fig. 3C). Moreover, their species richness slightly increased along the percentage of green lands (fig. 5F). This trend was consistent with the findings of other studies which highlighted the positive influences of green lands on the richness of dipteran insects (Haslett, Reference Haslett2001; Madureira et al., Reference Madureira, Rodrigues, Villa and Pereira2023; Schirmel et al., Reference Schirmel, Albrecht, Bauer, Sutter, Pfister and Entling2018). However, our linear model failed to identify a statistically significant effect (table 1; fig. 5F). This might be attributed to the unique biological characteristics of Diptera, such as their capacity for long-distance migration (Doyle et al., Reference Doyle, Hawkes, Massy, Powney, Menz and Wotton2020; Wotton et al., Reference Wotton, Gao, Menz, Morris, Ball, Lim, Reynolds, Hu and Chapman2019), wide nest range (Persson et al., Reference Persson, Ekroos, Olsson and Smith2020), diverse food selection (Courtney et al., Reference Courtney, Pape, Skevington, Sinclair, Foottit and Adler2017; Villa et al., Reference Villa, Santos, López-Sáez, Pinheiro, Marrão, Aguiar and Pereira2021) and random spatial distribution in landscapes (Courtney et al., Reference Courtney, Pape, Skevington, Sinclair, Foottit and Adler2017). All of those factors affected the response of dipteran prey to land-use change.
The differences in migration distance, food selection, nesting habitation, and foraging behaviour could also explain the variations in spatial scale of effect between the dipteran prey (4,000 m) and other insect prey (1,500 m) (fig. 4). Since the dipterans were more randomly distributed in landscapes, the hornets needed to forage over long distances to capture them, which likely resulted in an expanded spatial scale of effect (Jackson and Fahrig, Reference Jackson and Fahrig2012; Miguet et al., Reference Miguet, Jackson and Jackson2016). However, the recorded richness of dipteran prey and other insect orders did not reflect their true richness in environment. Instead, they represented the prey richness consumed by the hornets, therefore the spatial scales just indirectly suggested distribution and diversity of insects in nature (c.f., Arroyo–Rodríguez et al., Reference Arroyo–Rodríguez, Martínez-Ruiz, Bezerra, Galán-Acedo, San-José and Fahrig2023).
The dissimilarity of beta diversity demonstrated that the yellow-legged hornets fed on different insects across various landscapes (fig. 6A), likely suggesting a shift in prey composition when the food resources changed along the gradient of the surrounding landscape. The adaptability in prey composition was also evidenced when comparing to the foraging behaviours of the hornets in France, where the hymenopteran prey partly replaced the dipteran prey when the forests lands were converted to agricultural and urban landscapes (Bunker, Reference Bunker2019; Rome et al., Reference Rome, Perrard, Muller, Fontaine, Quilès, Zuccon and Villemant2021; Villemant et al., Reference Villemant, Muller, Haubois, Perrard, Darrouzet and Rome2011). In addition, we found that only the percentage of green lands explained the dietary dissimilarity, regardless of the percentage of buildings or the distances to the nearest semi-natural habitats and farmlands. This occurred partly because the yellow-legged hornets were highly mobile and foraged for long distances for food in landscapes (Bunker, Reference Bunker2019; Matsuura and Yamane, Reference Matsuura and Yamane1990).
Prey composition of V. velutina between natural habitats and invading habitats
In line with the research by (Perrard et al., Reference Perrard, Haxaire, Rortais and Villemant2009), Bunker (2021), (Rome et al., Reference Rome, Perrard, Muller, Fontaine, Quilès, Zuccon and Villemant2021) conducted in France, we discovered that V. velutina mainly predated upon honey bees. In France, approximately 38.1% to 84.8% of flesh pellets carried back by returning foragers were honey bees (Perrard et al., Reference Perrard, Haxaire, Rortais and Villemant2009; Rome et al., Reference Rome, Perrard, Muller, Fontaine, Quilès, Zuccon and Villemant2021). In Kunming, the relative abundance of honey bees accounted for 13.34 % read counts, suggesting that the yellow-legged hornets primarily attacked on honey bees in the native range. Hence, the yellow-legged hornets predated upon honey bees both in the native and the invading areas.
However, unlike the dietary compositions in the invading areas where the yellow-legged hornets preferred for social hymenoptera (e.g. honey bees) (Lioy et al., Reference Lioy, Bergamino and Porporato2022; Rome et al., Reference Rome, Perrard, Muller, Fontaine, Quilès, Zuccon and Villemant2021; Villemant et al., Reference Villemant, Muller, Haubois, Perrard, Darrouzet and Rome2011), we observed that this species mostly predated upon dipteran species in its native areas (fig. 3C). The difference in dietary species between the two regions could be attributed to variations in local species pools. For example, in the native areas, the Asian honey bees Apis cerana Fabricius mainly constituted the composition of honey bees, whereas in the invasive areas, the honey bees were primarily made up of Apis mellifera. Moreover, the difference in dietary species also suggested that the yellow-legged hornets had plastic feeding behaviours, adjusting their food choices in the new habitats.
Although the yellow-legged hornet was posited as a threat to pollinator diversity and pollination services in the invading areas (O’Shea-Wheller et al., Reference O’Shea-Wheller, Curtis, Kennedy, Groom, Poidatz, Raffle, Rojas-Nossa, Bartolomé, Dasilva-Martins and Maside2023; Rome et al., Reference Rome, Perrard, Muller, Fontaine, Quilès, Zuccon and Villemant2021), this species seemed not to cause catastrophic consequences on populations of wild bees and honey bees in the native area (personal field observations). The Asian honey bees were able to perform defence actions against predators, such as shimmering and forming killing balls (Bunker, Reference Bunker2019), which prevented the predators from hunting too much individuals in colony. Meanwhile, hornet farmers and keepers intentionally raised honey bees near the hornet rearing sites to afford foods for the reared hornets, which potentially reduced predation pressures from the reared hornets. More effects were needed to explore the consequences of reared hornets on pollinator diversity and pollination services of ecosystems (e.g. Rome et al., Reference Rome, Perrard, Muller, Fontaine, Quilès, Zuccon and Villemant2021).
Acknowledgements
We thank all the hornet farmers and keepers for providing the faecal samples. Zhi Li and Shuai Wu collected the faeces from the combs. This study was financially supported by the Yunnan Young and Middle-aged Academic and Technical Leaders Reserve Talent Project (grant no. 202405AC350077), the Yunnan Fundamental Research Projects (grant nos. 202401AS070015 and 202301AT070432) and the Special project of Guangxi key laboratory of special non-wood forests cultivation and utilisation (grant no. JB-24-04-01).
Competing interests
None.