Introduction
Studies have shown that birth weights of mothers are related to those of their own children and even their children’s children (Hackman et al., Reference Hackman, Emanuel, Belle and Daling1983; Klebanoff et al., Reference Klebanoff, Graubard, Kessel and Berendes1984). Women who were themselves small-for-gestational age (SGA) are twice at risk of having an SGA baby themselves (Klebanoff et al., Reference Klebanoff, Meirik and Berendes1989; Skjaerven et al., Reference Skjaerven, Wilcox, Oyen and Magnus1997) as well as being at a greater risk of developing adulthood diseases such as non-insulin-dependent diabetes mellitus (NIDDM) and hypertension (Phillips, Reference Phillips1996 and Reference Phillips1998). Moreover, women who had parents with NIDDM had children with higher birth weights than women with non-diabetic parents. In addition, grandchildren of grandparents with NIDDM are usually in the top percentiles in growth charts (i.e. 90th centile and above) compared with non-diabetic grandparents (McCarron et al., Reference McCarron, Smith and Hattersley2004).
Over 50 years ago it was noted that the diet of a given generation may affect the offspring of several generations hence (Mussey, Reference Mussey1949). Rats that were maintained on low-protein diets for 10 to 12 generations and subsequently rehabilitated in utero overgrew by 18.6% compared to those whose diet was normalised at birth (Stewart et al., Reference Stewart, Sheppard, Preece and Waterlow1980). In contrast, when the rat’s diet was returned to meet the protein requirements at 4 weeks of age, they failed to demonstrate any recovery from effective refeeding, further highlighting the importance of a balanced maternal diet. Intergenerational studies to date have predominantly been conducted using small animal models but in order to gain a better understanding of how this equates to the human it is necessary to repeat such studies in translational models, such as the pig. The physiological similarities of the metabolic system in humans and pigs make it a good model to study the intergenerational effects of body weight at birth and subsequent consequences on glucose metabolism in later life.
Low birth weight piglets, particularly those that are long and thin, have impaired glucose metabolism at 1 year of age compared to their normal birth weight littermates (Poore and Fowden, Reference Poore and Fowden2002), suggesting intrauterine origins of abnormalities in adult glucose metabolism (Barker, Reference Barker1994 and Reference Barker1998). However, it is not known whether glucose intolerance in such animals is further exacerbated by pregnancy. Given that glucose is the main energy substrate for foetal metabolism (Battaglia and Meschia, Reference Battaglia and Meschia1978), it seems feasible that mothers who themselves were SGA would exhibit poor glucose homoeostasis in pregnancy, leading to a reduction in reproductive performance. Indeed, it has been demonstrated that glucose curve characteristics following a glucose tolerance test (GTT) in late pregnancy can, to some extent, be used to predict total litter performance of sows (Kemp et al., Reference Kemp, Soede, Vesseur, Helmond, Spoorenberg and Frankena1996; Corson et al., Reference Corson, Laws, Laws, Litten, Lean and Clarke2008). It remains to be established whether glucose tolerance in the pre-pregnant state can also be used as a reliable indicator of reproductive performance, thus supporting the intrauterine programming hypothesis. The aims of the present study are two-fold: firstly to examine whether birth weight influences subsequent reproductive performance; and secondly to establish whether intergeneration effects are observed in the pig.
Material and methods
Animals and diet
Eleven animals entering the study were selected from Imperial College London Research Unit based at Wye, and treated in accordance with the practices for a standard commercial unit. Experimental procedures were carried out according to the regulations of the Animals (Scientific Procedures) Act, 1986, and were licensed by the Home Office (UK). At all stages of life animals were kept within the guidelines set out by the Department for Environment Food and Rural Affairs (DEFRA, 2003).
Four commercial sows (50% large white × Landrace : 50% Meshian) were artificially inseminated with pooled 2006 large white boar semen (P17, 2006; JSR Genetics, Driffield, UK). Throughout gestation they were housed in straw yards and offered 3 kg/day of a commercially available sow diet (Deltabreed dry sow pellets, ABN: 13.1 MJ/kg, 17.8% protein, 4.5% fat). All sows gave birth naturally at term and during lactation they were offered up to 6 kg of a standard lactation diet (Deltabreed high-lac pellets, ABN: 14.1 MJ/kg, 17% protein, 7.2% fat).
Piglets were weighed within 24 h of birth and the lightest (i.e. <10th percentile: generation 1 (G1) L; n = 4) and the heaviest (G1 N; n = 4) female piglets from each litter were selected to enter the generation study. It should be noted that although the heaviest female pigs in each litter were selected, their birth weight did not exceed the 90th percentile for weight for our normal population of pigs (Corson et al., Reference Corson, Laws, Laws, Litten, Lean and Clarke2008) and so they were classified as normal birth weight pigs (i.e. >20th < 80th percentile for body weight). All piglets were reared with their mother until weaning at 24–28 days of age, provided they were >6.5 kg at this time. Creep feed (0.3 kg per litter per day; Primary Supreme Maxus G200, ABN, UK) was fed to the piglets from day 14 onwards; the standard post-weaning feeding regime, which varied with age and weight (energy 13–17.35 MJ/kg : protein 17.8–23.5% : fat 4.8–9%), was offered on an ad libitum basis.
G1 L and G1 N gilts were artificially inseminated with pooled boar semen 2006 at around 10 months of age when their body weight reached approximately 140 kg. They gave birth normally at term to second-generation (G2) offspring, and again the lightest (l) and heaviest (n) female piglets born to G1 L (G2 Ll, n = 4; G2 Ln, n = 4) and G1 N (G2 Nl, n = 4; G2 Nn, n = 4) animals were selected from each litter. One of the G1 L mothers savaged her litter and so data from this animal, with the exception of birth weight data, have been excluded from the study. In addition, one of the heavier piglets born to a G1 N mother died whereas its lighter sibling survived.
Physical assessment and glucose tolerance tests
Piglet body weight and crown-to-rump length (CRL) were recorded to enable their ponderal index (PI: kg/m3), and their fat-free mass (FFM) estimated using a total body electrical conductivity (TOBEC) analysing system at 7, 14, and 21 days of neonatal life (Litten et al., Reference Litten, Mostyn, Perkins, Corson, Symonds and Clarke2005). For G1 pigs, a GTT was performed at 185 ± 1.7 days of age and again at approximately 111 days of gestation. For G2 pigs, the GTT was conducted at a younger age (132 ± 10.9 days) as these animals had to be humanely slaughtered for meat purposes.
Animals were fed their usual dietary regime at 2 h prior to catheterisation. Throughout the test period the pigs had unlimited access to water. A catheter (Optiva 2; Johnson and Johnson Medical Ltd, Ascot, Berkshire, UK) was placed into either the central ear vein or the lateral ear vein of both ears (Kingsbury, 1992), one of which was used for repeated blood sampling and the other for the infusion of glucose. The catheter was filled with sterile saline containing 0.2 mg/ml crystapen (Benzylpenicillin, NVS UK Ltd, Luton, UK) and 250 i.u./ml heparin, which was reduced to 50 i.u./ml during the sampling period. Care was taken not to inject heparinised saline into the animal. Once the catheter was inserted, the animal was rested for a minimum period of 2 h.
A basal blood sample (−10 min) was obtained from the catheter and a drop of blood was placed on a test sensor for blood glucose evaluation using a portable glucometer Esprit (Bayer, Newbury, UK). The remainder of the sample was transferred into an EDTA tube and placed on ice. Samples were centrifuged at 1600 × g for 15 min at 4°C and the plasma fraction removed and stored at −20°C until subsequent analyses. A further basal sample was taken 5 min later (i.e. −5 min). Glucose was only administered if both the samples were within the reference range (3–6 mM); this ensured that the animal’s blood glucose was stable prior to the procedure. Once basal glucose concentrations were established a bolus injection of 0.5 g/kg body weight glucose (40% Dextrose; Arnolds, Shrewsbury, Shropshire, UK) was slowly administered to each sow via the second catheter within a 5 min period (Guan et al., Reference Guan, Matte, Ku, Snow and Burton2000). Further samples were collected at 5, 10, 15, 20, 25, 30, 40, 50, 60, 75 and 90 min post glucose administration and processed as previously described. Again a sub-sample of plasma was stored at −20°C for subsequent determination of plasma insulin. It was not possible to conduct a GTT on one of the G2 Nn piglets and so with the exception of birth weight data, this animal has been excluded from the study.
Laboratory analysis
Plasma insulin concentrations were analysed using a radioimmunoassy (ICN 07-260102 from MP Biomedicals, UK) as previously described by Mostyn et al. (Reference Mostyn, Litten, Perkins, Euden, Corson, Symonds and Clarke2005). The standard curve was linear within the range of standards provided (0–310 mM), and the inter- and intra-assay coefficients of variation were 4.3% and 5.8%, respectively.
Statistical analysis
All data are presented as mean ± s.e. The trapezoidal method was used to calculate the area under the glucose curve (AUC) (EasyPlot for Windows, Version 4.0.4, Spiral Software). ‘Glucose curve’ characteristics were defined by the following parameters. Peak glucose was described as the highest concentration of blood glucose recorded. Maximum increase in blood glucose was calculated by subtracting basal blood glucose concentration from peak glucose. The adjusted AUC (AAUC) was calculated after pretest blood glucose concentrations were subtracted from the subsequent blood glucose concentrations. Glucose clearance rate (K) was determined using the following equation:

where SG1 and SG2 represent peak blood glucose concentration at time2 and basal blood glucose concentration at time1, respectively.
Statistical differences were assessed using a general linear model, analysis of variance (ANOVA) in Minitab version 13.3. The model included the main effects of birth weight (i.e. low v. normal) and pregnant state (i.e. non-pregnant v. pregnant); animals were also blocked by their identification. Tests were undertaken for main effects and first-order interactions. Tukey simultaneous tests were used to make pairwise comparisons between birth weight groups and pregnancy status.
Relationships between body weight and shape at birth, neonatal growth and development, and glucose tolerance characteristics in later life and reproductive performance were assessed using a three-step model building strategy described by Kemp et al. (Reference Kemp, Soede, Vesseur, Helmond, Spoorenberg and Frankena1996). Initially, a one-way regression was used to evaluate the relationship between glucose curve characteristics and litter performance. Predictors with a P-value of <0.15 were chosen. This P-value was chosen to decrease the likelihood of excluding variables that are each weakly associated with the outcome but may become an important predictor of the outcome when taken together in one model. In step two, a multivariate ANOVA (i.e. MANOVA) was applied using all the predictors remaining from step 1 (i.e. P < 0.15). The final model was constructed using multiple regression analyses with the independent variables chosen from the predictors for steps 1 and 2, where P < 0.15 were used in the final stage. Numerous relationships were considered for use in the final equation but only those correlations where P < 0.05 will be discussed below.
Results
Reproductive performance
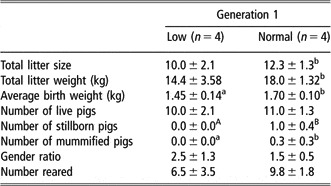
Total litter size and litter weight tended to be higher (P = 0.079) in the G1 N compared to the G1 L pigs, and G1 N gilts tended to give birth to larger (P < 0.05) piglets (Table 1). The number of piglets born alive was similar, which was partly due to the increased incidence of dead (P < 0.01) and mummified piglets (P < 0.05) observed in the G1 N group. Furthermore, G1 L gilts appeared to give birth to more female than male piglets and tended to rear less offspring than G1 N mothers, although these differences were not statistically significant.
Reproductive performance of low (<10th percentile) and normal (>20th < 80th percentile) birth weight pigs

Values are presented as least-squares means ± s.e. Gender ratio = female : male piglets. Within each row, values with different superscripts differ: abP < 0.05, ABP < 0.01.
Body conformation and growth performance of generation 1 pigs
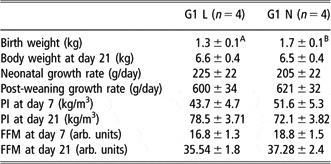
As expected, birth weight was different (P < 0.01) between the G1 L and G1 N groups as this was part of the selection criteria (Table 2). However, by day 21 of age this difference was no longer apparent due to the elevated neonatal growth rate exhibited by the G1 L pigs. Post-weaning growth rate was also similar between the two groups. There was a trend (P = 0.065) for PI at day 7 to be reduced in the G1 L group but by 21 days of age there was no difference in PI, primarily as a result of the greater change in PI exhibited by G1 L pigs. These data suggest that initially the G1 L pigs were long and thin but by day 21 they were fatter and their body shape more in proportion. FFM per se also increased over the neonatal period and remained similar between the two groups.
Body weight, ponderal index (PI: kg/m3), fat-free mass (FFM), and neonatal and post-weaning growth rate of low (L: < 10th percentile) and normal (N: >20 < 80th) percentile pigs from generation 1 (G1)

arb = arbitrary.
Values are presented as least-square means ± s.e.
Neonatal growth rate is for the period from birth to weaning (i.e. 24–28 days of age). Post-weaning growth rate is the period from weaning to the first glucose tolerance test (i.e. 6 months of age). With each row, values with different superscripts differ. Statistical differences between low and normal groups: ABP < 0.01.
Body conformation and growth performance of generation 1 pigs
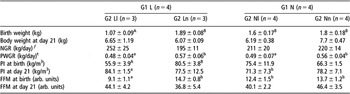
G2 Ln piglets born to G1 L mothers were heavier (P < 0.01) at birth than the G2 Ll pigs as this was part of the selection criteria (Table 3). This difference in body weight was no longer apparent by day 21 of age, which is partly due to the reduced number of pigs reared by the G1 L mothers (see Table 1), in conjunction with the increased (P < 0.01) neonatal growth rate observed in the G2 Ll pigs. After weaning, this situation was reversed, with G2 Ll animals exhibiting a reduced (P < 0.05) growth performance compared to the G2 Ln group. In contrast, birth weight was similar between the G2 Nl and Nn pigs born to G1 N mothers, thus these G2 Nl offspring did not fall into the <10th percentile classification group for body weight (Table 3). Consequently, G2 Ll pigs were smaller (P < 0.05) than both G2 Nl and Nn animals. Neonatal growth rates were similar between offspring born to G1 N mothers but after weaning differences in growth rates became apparent, with G2 Nl pigs growing more slowly (P < 0.05) than their Nn siblings. PI at birth was lower (P < 0.01) in G2 Ll compared to Ln pigs and this difference was still apparent (P = 0.061) at day 21 of age (Table 3). Conversely, PI was similar between the G2 Nl and Ll groups throughout the neonatal period. FFM was also lower (P < 0.05) in G2 Ll offspring compared to all the other groups but this difference was no longer present by day 21 of age.
Body weight, ponderal index (PI: kg/m3), fat-free mass (FFM) and neonatal (NGR) and post-weaning (PWGR) growth rate of low (L: <10th percentile) and normal (N: >20th < 80th percentile) generation 2 (G2) pigs born to generation 1 (G1) mothers

arb. = arbitrary.
Values are presented as least-squares means ± s.e.
ƒNeonatal growth rate (NGR) is for the period from birth to weaning (i.e. 24–28 days of age).
tPost-weaning growth rate (PWGR) is the period from weaning to the first glucose tolerance test (i.e. 4–5 months of age). Within each row, values with different superscripts differ: abP < 0.05, ABP < 0.01.
Glucose tolerance of the mother and her offspring
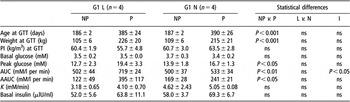
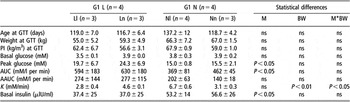
Age, body weight and PI at the time a GTT was conducted (i.e. the non-pregnant and pregnant state) were similar between the two birth weight groups in G1 (Table 4). There was no difference in basal concentrations of blood glucose, irrespective of birth weight group or pregnant/non-pregnant state. Peak glucose was greater (P < 0.05) during pregnancy in both groups, particularly in the G1 L animals. The AUC (P < 0.01) and AAUC (P < 0.05) were greater in pregnancy for the G1 L pigs only. Consequently, there was a trend (P = 0.076) for the glucose clearance rate to be slower during pregnancy in the G1 L animals. Irrespective of birth weight group, basal concentrations of plasma insulin and hence glucose : insulin ratios were similar in both the non-pregnant and pregnant states.
Glucose metabolism in low (L: < 10th percentile) and normal (>20 < 80th percentile) birth weight generation 1 (G1) pigs following a glucose tolerance test (GTT) conducted in the non-pregnant (NP) and pregnant state (P)

Values are least-squares means ± s.e.
AUC = area under the 60 min curve.
AAUC = adjusted area under the 60 min curve were calculated after pretest values were subtracted.
K = glucose clearance rate, which can be determined using the following equation where SG1 and SG2 = peak blood glucose at time2 and basal blood glucose at time1, respectively: .
For G2 pigs, age, body weight and PI at the time of GTT were similar between the four groups (Table 5). Again, there was no difference in basal concentrations of blood glucose, irrespective of their maternal or their own birth weight group. Peak glucose and AUC were lower (P < 0.05) in the G2 Ll and Nl groups compared to that observed in offspring born to G1 L gilts, whilst AAUC was similar. Glucose clearance (K) was reduced (P < 0.01) in G2 Ll and G2 Nn compared to their siblings. In contrast, basal insulin was higher (P < 0.05) in pigs born to G1 N than in pigs born to G1 L mothers, irrespective of pregnancy state. However, a similar scenario was only observed in the non-pregnant state for the glucose : insulin (P < 0.05).
The effect of low (L) or normal (N) birth weight on glucose metabolism following a glucose tolerance test (GTT) conducted in the non-pregnant state in generation 2 (G2) pigs born to generation 1 (G1) low (< 10th percentile) or normal (> 20 < 80th percentile) birth weight mothers

PI=ponderal index; l=lightest; n=heaviest.
Values are least-squares means ± s.e.
M = maternal birth weight group and BW = own birth weight group.
AUC = area under the 60 min curve.
AAUC = adjusted area under the 60 min curve was calculated after pretest values were subtracted.
K = glucose clearance rate, which can be determined using the following equation where SG1 and SG2 = peak blood glucose at time2 and basal blood glucose at time1, respectively:
Correlations between body weight and conformation during the neonatal period as a predictor of glucose curve characteristics in later life
Generation 1: non-pregnant
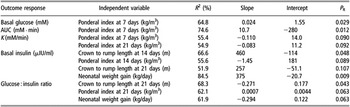
There were very few relationships observed between morphology at birth and throughout the neonatal period, and glucose curve characteristics in later life when G1 L and G1 N groups were considered individually. It was of interest to note that when data for G1 L and G1 N animals were combined, birth weight was not a good predictor for glucose curve characteristic whereas there were numerous relationships observed between CRL and hence PI, and glucose metabolism (Table 6). There was a positive association between CRL at birth and glucose clearance (P = 0.081) and a negative relationship between CRL at birth and basal insulin (P = 0.082). In contrast, PI at birth was positively correlated with basal insulin (P < 0.05). Many of these relationships persisted throughout the neonatal period, although correlations with body weight rather than PI played more of a feature. Body weight at 7 (P < 0.05) and 14 (P < 0.05) days of age, and FFM (P < 0.01) at 7 days of age were all positively related to glucose clearance. PI at 21 days of age was negatively associated with glucose clearance (P = 0.091). There was also a negative relationship between basal insulin and body weight (P < 0.05), CRL (P = 0.093) and FFM (P < 0.05) at 7 days as well as body weight at 14 days of age (P < 0.01). Glucose : insulin was positively correlated to FFM at 7 days of age (P < 0.01), body weight (P = 0.079) and CRL (P = 0.064) at 14 days, and CRL at 21 days (P < 0.05) but negatively linked to PI (P < 0.05).
The relationship between body weight and shape of generation 1 animals at birth and during the neonatal period, and glucose curve characteristics following an i.v. glucose tolerance test (GTT) in the non-pregnant state

P R = P value from regression analyses.
Glucose clearance rate (K) can be determined using the following equation where SG1 and SG2 = peak blood glucose at time2 and basal blood glucose at time1, respectively:
Generation 1: pregnant state
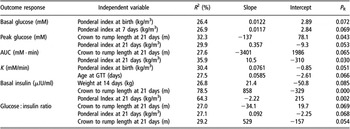
As observed in the non-pregnant state, none of the morphological (i.e. body weight and shape) parameters measured at birth in the G1 group were related to glucose curve characteristics in late pregnancy (Table 7). PI on day 7 was positively correlated with basal glucose (P < 0.05) and AUC (P < 0.05) but negatively associated with glucose clearance (P = 0.090) and this latter relationship was still apparent at 21 days of age. Basal insulin was positively linked with CRL on day 14 and 21 of neonatal life as well as neonatal growth rate. Similar observations were also apparent for glucose : insulin.
The relationship between neonatal body weight and shape of generation 1 animals on glucose curve characteristics following an i.v. glucose tolerance test (GTT) in the pregnant state

P R = P-value from regression analyses.
AUC = area under the 60 min curve.
K = glucose clearance rate, which can be determined using the following equation, where SG1 and SG2 = peak blood glucose at time2 and basal blood glucose at time1, respectively:
Generation 2
As with G1 when all of the G2 data are combined, the most prominent relationships are between body shape during the neonatal period and glucose curve characteristics (Table 8). Indeed many of the correlations observed in G1 are still observed in G2. At birth PI was positively related to basal glucose (P = 0.072) and glucose clearance (P = 0.51). By 7 days of age PI remained linked to basal glucose (P = 0.069) but not glucose clearance. Basal insulin was positively associated with body weight at 14 days (P = 0.085). CRL (P < 0.05) and PI (P < 0.053) at 21 days of age were negatively correlated with AUC (P = 0.065) and glucose : insulin (P = 0.069) but positively related to basal insulin (P < 0.001), whereas the reverse relationships were observed with PI. When these associations between neonatal morphology and glucose curve characteristics are considered within the individual G2 groups, many more relationships were observed for the G2 Ll and G2 Ln pigs compared to those seen in the G2 Nl and G2 Nn animals (data not shown).
The relationship between neonatal body weight and shape of generation 2 animals in the LLFootnote a, LNFootnote b, NLFootnote c and NNFootnote d groups on glucose curve characteristics following an i.v. glucose tolerance test (GTT)

P R = P-value from regression analyses.
a Lightest piglet born to low centile mother (<10th percentile).
b Heaviest piglet born to low (<10th percentile) centile mother.
c Lightest piglet born to a normal (>20th < 80th percentile) mother.
d Heaviest piglet born to a normal (>20th < 80th percentile) mother.
AUC = area under the 60 min curve.
K = glucose clearance rate, which can be determined using the following equation, where SG1 and SG2 = peak blood glucose at time2 and basal blood glucose at time1, respectively:
Correlations between glucose curve characteristics and reproductive performance
Generation 1: non-pregnant
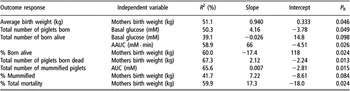
Basal glucose in the non-pregnant state was shown to be positively related to the total number of piglets born (P < 0.05) but negatively correlated with the number of piglets born alive (P = 0.098; Table 9). There was also a positive relationship between AAUC and the total number of piglets born alive (P < 0.15), whereas AUC was associated with the number of mummified piglets (P < 0.05). Further findings were that the gilts’ own birth weight was related to average piglet birth weight (P < 0.05), % of piglets born alive (P < 0.05), the number of piglets born dead (P < 0.05), the % mummified (P = 0.084) and the % piglet mortality (P < 0.01). Predictor equations for future reproductive performance from GTT characteristics in the non-pregnant state are as follows:
Correlations between glucose curve characteristics following an i.v. glucose tolerance test (GTT) in the non-pregnant state and the future reproductive performance of generation 1 mothers

P R = P-value from regression analyses.
AUC = area under the 60 min curve.
AAUC = adjusted area under the 60 min curve was calculated after pretest values were subtracted.
(i) born alive = −2.77 + (2.82 × basal glucose) − (0.0223 × AAUC) + (26.9 × neonatal weight gain), where R 2 = 94.7% (P < 0.01); and
(ii) mummified = −3.17 + (0.00804 × AUC) − (0.0390 × maximum increase in glucose), where R 2 = 67% (P < 0.05).
Generation 1: Pregnant
It is of interest to note that the total number of piglets born alive remained correlated with the AAUC following a GTT in the pregnant state (P = 0.073), but it was also negatively related (P = 0.089) to glucose clearance (Table 10). Similarly, there was still an association between the number of mummified piglets and AUC as previously seen as well as correlations with basal (P = 0.091) and peak (P = 0.052) glucose. The equations for litter performance predicted from glucose curve characteristics in late pregnancy are as follows:
The correlations between glucose curve characteristics following an i.v. glucose tolerance test (GTT) in late pregnancy and the subsequent reproductive performance of generation 1 mothers

P R = P-value from regression analyses.
AUC = area under the 60 min curve.
AAUC = adjusted area under the 60 min curve was calculated after pretest values were subtracted.
K = glucose clearance rate, which can be determined using the following equation, where SG1 and SG2 = peak blood glucose at time2 and basal blood glucose at time1, respectively:
Total litter weight = 12.0 − (2.30 × glucose clearance when gilt was pregnant) + (11.6 × maternal birth weight), where R 2 = 97.4% (P < 0.05).
Discussion
The underlying biological mechanisms by which the birth weight of the human mother affects the birth weight of her baby remain to be fully elucidated. Potential explanations for intergeneration effects include:
(i) genetic factors – i.e. genetic attributes may manifest themselves similarly in the mother and offspring. It has been suggested that foetal genes have a role in the correlation between birth weight of the father and his baby (Little, Reference Little1987).
(ii) adverse extrinsic environmental influences (e.g. diet and smoking) may persist across generations (Hypponen et al., Reference Hypponen, Smith and Power2003a and Reference Hypponen, Smith and Power2003b); and
(iii) that adverse in utero experience may permanently influence maternal growth and development, altering her metabolism in such a manner so as to provide an unfavourable environment for her foetus (Hales and Barker, Reference Hales and Barker2001).
It is this last hypothesis that suggests a mechanism by which programming could be self-perpetuating across several generations (Drake and Walker, Reference Drake and Walker2004). However, it should also be stressed that birth weight is the result of interaction between genetic and environmental factors and such relationships remain poorly understood (Emanuel et al., Reference Emanuel, Albertman and Evans1992). The present study examined whether an adverse environment in utero resulted in altered glucose metabolism in adulthood, and whether these affects persisted into the next generation. These results partially indicate that there are intergenerational effects in pigs as, like their mothers, Ll exhibited greater glucose intolerance but it remains to be established whether they would go on to have similar reproductive performance.
Birth weight and growth performance of G1 pigs
Nutrition during early life is an important factor influencing the physical and behavioural development of animals. The birth weight of the piglet has an important impact on many aspects of later performance. For example, relationships between birth weight and growth rate as well as between birth weight and litter traits at farrowing (Rydhmer et al., Reference Rydhmer, Eliasson, Stern, Anderson and Einarsson1989). Perturbations in nutritional supply in utero result in low birth weight piglets that often fail to thrive. Over the first few week of life, birth weight is one of the principal factors affecting piglet survival, with heavier piglets having a reduced risk of morbidity and mortality over the neonatal period. In the present study, like the N group, all L pigs survived but this was not unexpected because their average birth weight was >1.2 kg and it has been established from our previous work that female pigs below the 10th centile weight <1.05 kg. Moreover, others have demonstrated that pigs weighing <1 kg are more at risk from mortality (Pond and Mersmann, Reference Pond and Mersmann2001).
The coefficient of variation for birth weight within the litters was also small as demonstrated by the absence of high (i.e. >90th centile) birth weight offspring in the present study. During the first few days of life the piglets compete for access to the teat and it is usually the heavier, more dominant piglets that gain access to the more productive anterior teats (Rosillon-Warnier and Paquay, Reference Rosillon-Warnier and Paquay1984; Basak and Pan, Reference Basak and Pan1994). Therefore with less variation in body weight between siblings, the L pigs are more likely to gain quicker possession of one teat; this may explain why neonatal growth rate was similar between L and N piglets. However, when relative growth rate is taken into consideration, L animals exhibit catch-up growth (L: 405 ± 30; N: 282 ± 34%), which can have significant effects on glucose metabolism in later life as discussed later.
Maternal birth weight and subsequent reproductive performance
It has long been recognised that factors relating to the mother’s childhood, i.e. her period of growth and development, may influence her later reproductive performance (Hackman et al., Reference Hackman, Emanuel, Belle and Daling1983; Emanuel, Reference Emanuel1986). Indeed, one British study demonstrated that a mother’s own birth weight (which is an indicator of her own intrauterine growth and development) may be of paramount importance in determining her own babies’ development in utero (Ounsted and Ounsted, Reference Ounsted and Ounsted1966). It is has been proposed that reduced birth weight disrupts the growth and development of key organ systems, including the reproductive and endocrine systems, which can subsequently affect the growth and development of the next generation. The relationship between maternal stature and birth weight to infant’s birth weight has been demonstrated in numerous populations (Emanuel et al., Reference Emanuel, Albertman and Evans1992; Collins et al., Reference Collins, Wu and David2002; Drake et al., Reference Drake, Smith, Betts, Crowne and Shield2002).
Generally women who were themselves small-for-gestation-age (SGA) at birth have an approximately doubled risk of giving birth to an SGA infant (Klebanoff et al., Reference Klebanoff, Meirik and Berendes1989). A young mother is more likely to prioritise nutrition for her own anabolism and growth rather than that of her foetus, and therefore give birth to smaller offspring (Wallace et al., Reference Wallace, Bourke, Da Silva and Aitken2001). Also physiological limitations of foetal growth are greater in primiparous pregnancies; a primiparous uterus has a more limited ability for vasodilation and this may be one of the mechanisms that lead to a smaller birth size (Naeye, Reference Naeye1983). Although the pig is a litter-bearing species, a similar scenario has been observed in the current study. G1 L sows produced piglets that were lighter and shorter at birth despite having a similar PI to the G1 N mothers in late pregnancy, thereby suggesting that they are partitioning their nutritional intake for their own growth (Wallace et al., Reference Wallace, Bourke, Da Silva and Aitken2001). Interestingly, the PI of piglets born to G1 L and G1 N mothers were similar, suggesting that although G2 N piglets were heavier and longer than piglets born to their L siblings, their body shapes were the same as those born to G1 L gilts.
The unique ‘Dutch famine birth cohort study’, which followed the reproductive data of mothers, who had experienced severe famine throughout part of their pregnancies, and the subsequent reproductive data obtained from their offspring (Lumey, Reference Lumey1998), demonstrated that intrauterine nutrition could have long-term effects on their offspring. In the present study, the L pigs have analogies to the low birth weight babies exposed to famine in the third trimester. Total litter size and total litter weight in the G1 L mothers were lower than those of the G1 N group, and likewise birth weight in the Ll animals was lower than that of the Nl pig. These data demonstrate that low birth weight has intergenerational repercussion, supporting the hypothesis that the mother’s own intrauterine experience influences her later reproductive outcome (Emanuel, Reference Emanuel1986). Furthermore, there was higher incidence of stillborn and mummified piglets seen in the G1 N group; this group has some similarities to the higher birth weight babies born to diabetic mothers, which demonstrate a greater mortality rate (Girling and Dornhorst, Reference Girling and Dornhorst2003).
The mechanism by which SGA mothers are at increased risk of giving birth to SGA infants remains to be fully elucidated. The predictive adaptive response, which states that the size of that risk depends on the size of the mismatch between the predicted and actual environment, could be one possible explanation for these observations (Gluckman et al., Reference Gluckman, Hanson and Pinal2005). This model not only explains how the transition from a poor environment during prenatal life to a plentiful plane of nutrition in post-natal life can lead to a predisposition to the metabolic syndrome but also takes into account the reverse situation where exposure to an enriched in utero environment followed by adverse post-natal one can also increase the risk of adulthood diseases. These affects are exacerbated: (i) in the adolescent pregnant animal (Wallace et al., Reference Wallace, Bourke, Da Silva and Aitken2001); (ii) in primiparous mothers due to the limited capacity of the uterus; and (iii) in mothers with shorter stature as discussed above. Considering that all G1 mothers were adolescent, it was surprising that total litter weight and size were higher, particularly in the N group, compared to their own mothers. This may, in part, be due to the fact that the grandmothers (G0) were themselves still young (i.e. only parity two or less), and therefore may not have regained body condition from their previous pregnancy. Unfortunately, as backfat thickness and maternal weight were not recorded in G0 sows, it is not possible to say whether they were in fact in poorer body condition than G1 mothers.
Maternal birth weight and subsequent growth and development of her offspring
In the present study, there was very little variation in birth weight in N mothers, thereby suggesting that they received an even distribution of nutrient supplies in utero (Adams, Reference Adams1971). Conversely, there was a significant degree of variation in piglet birth weight in L mothers, indicating that there were perturbations in foetal nutrient supply. One explanation for this may be reduced development of her reproductive system as she was still adolescent when pregnant. Alternatively, L mothers may be partitioning nutrient towards herself rather than to her developing foetus(es).
Birth weight and the number of piglets reared have been demonstrated to be a contributory factor to post-natal growth and development. Previous studies have demonstrated that larger piglets usually grow faster than their lighter littermates (Powell and Aberle, Reference Powell and Aberle1980; Dwyer et al., Reference Dwyer, Fletcher and Stickland1993), but the findings of the present study do not support this. Despite litter size being similar between L and N groups, there was a tendency for L mothers to rear fewer offspring compared to their N counterparts, but this was in part due to the occurrence of cross-fostering (decision made by the Pig Unit Management). Consequently, neonatal growth rate was similar between all groups, although it should be mentioned that there were differences in relative growth rates (RGR) (Ll: 521 ± 138; Ln: 268 ± 75; Nl: 294 ± 115; Nn: 266 ± 92%). One thing that is apparent is that RGR of the Nn and Nl was similar to their mothers’ RGR. With respect to the piglets born to the L mothers, then interestingly Ll piglets exhibited a similar RGR to their own mother whilst the RGR of Ln offspring was akin to their mothers’ N siblings. This suggests that Ll piglets are achieving their maximal milk intake and that milk intake was similar to LN siblings despite their smaller size. As piglets born to G1 L and G1 N mothers grew at approximately the same rate, it is likely that milk production may have been greater in the G1 N animals as they reared more young. There is a strong litter correlation between milk yield and litter size and it has been proposed that sows are capable of producing higher yields in early lactation if more milk is removed (Elsley et al., Reference Elsley, Bathurst, Bracewell, Cunningham, Dent, Dodsworth, MacPherson and Walker1971; Auldist et al., Reference Auldist, Morrish, Eason and King1998; King, Reference King2000).
After weaning, however, there was a completely different scenario, despite body weight being similar at the time of weaning. Irrespective of whether the pigs were born to L or N mother both Ll and Nl offspring exhibited significantly reduced growth rates. Post weaning, a new social hierarchy order has to be established due to the mixing of different social groups and it is likely that lighter piglets will be ranked lower. Therefore, one possible explanation for the reduced growth rates could be that Ll or Nl pigs had less opportunity for access to food.
PI at birth was lower in the Ll piglets compared to their Ln littermate; this indicates that they are long and thin with reduced body reserves as demonstrated by their FFM. Over the neonatal period the PI of these piglets dramatically increased, suggesting that they were putting on weight without the proportionate increase in CRL. In contrast, PI of piglets in the Ln, Nl and Nn groups remained similar at birth and at 21 days of life. A similar scenario has been observed in low birth weight human infants; the children of small mothers who are themselves small at birth often move to a higher centile on the growth curve (Walton and Hammond, Reference Walton and Hammond1938). The findings of the present study support this as body weight at weaning was similar between all the groups. It would also appear that Ll piglets are depositing fat at a greater rate rather than promoting lean tissue growth. Moreover, those children who exhibited catch-up growth between birth and 2 years of age by the age of 5 years were fatter (Ong et al., Reference Ong, Ahmed, Emmett, Preece and Dunger2000).
Birth weight and glucose metabolism
It is well established that decreased foetal growth is related to the occurrence of type 2 non-insulin-dependent diabetes in later life. In numerous populations throughout the world, decreased glucose tolerance in adulthood has been associated with low birth weight and thinness at birth (Hales et al., Reference Hales, Barker, Clark, Cox, Fall, Osmond and Winter1991; Phipps et al., Reference Phipps, Barker, Hales, Fall, Osmond and Clark1993; McCance, Reference McCance1994; Lithell et al., Reference Lithell, McKeigue, Berglund, Mohsen, Litthell and Leon1996; Fall, Reference Fall2001a and Reference Fall2001b). A similar observation has been made in pigs by other authors (Poore and Fowden, Reference Poore and Fowden2002) but this did not appear to be the case for G1 pigs in the present study during the non-pregnant state. This was not totally unsurprising since Poore and Fowden (Reference Poore and Fowden2002) found that birth weight only influenced glucose tolerance at 12 months of age, whereas the pigs used in this study were tested at 6 months of age. By the time they were 12 months old they were pregnant and differences in glucose tolerance became apparent. Age-dependent changes in glucose tolerance have demonstrated in other species (Ozanne and Hales, Reference Ozanne and Hales1999). Likewise, a study of mismatched birth weight showed glucose intolerance in LBW lambs (Clarke et al., Reference Clarke, Firth, Heasman, Stephenson and Symonds2000), although these differences were only apparent in juvenile life.
As with the human data G1 L pigs exhibited decreased glucose tolerance but it is not known whether this affect was exacerbated due to pregnancy or whether this alteration in glucose metabolism would have occurred anyway. There was very little difference in glucose curve characteristics between the non-pregnant and pregnant state in G1 N female pigs. In contrast to glucose metabolism in the non-pregnant state in G1, differences were apparent in glucose tolerance in G2 animals at approximately 4 months of age. Peak glucose, AUC and AAUC were much higher in the G1 L offspring compared to pigs born to G1 N mothers. This pattern reflects that which was observed in G1 mothers when pregnant. It is, therefore, proposed that there is an intergenerational association for glucose intolerance, supporting findings seen in humans (McCarron et al., Reference McCarron, Smith and Hattersley2004).
Glucose clearance in G2 animals appeared to be influenced more by their own birth weight than by the birth weight of their mothers. As expected from other data in the literature (Stein and Lumey, Reference Stein and Lumey2000; Poore and Fowden, Reference Poore and Fowden2002), Ll pigs had a slower glucose clearance rate than their Ln siblings. Surprisingly the opposite situation occurred in pigs born to G1 N mothers and one explanation for this could be differences in the time taken to infuse the glucose (Nl: 66 ± 12 s; Nn: 104 ± 13.8 s).
Despite numerous investigations, the underlying mechanisms whereby poor intrauterine growth programmes the subsequent development of impaired glucose metabolism remains to be fully understood. It is thought that a deficiency in insulin secretion coupled with insulin resistance is involved in the aetiology of glucose intolerance and NIDDM (Leahy, Reference Leahy1990). Basal insulin was similar in both the non-pregnant and pregnant state in the present study, and there were no differences observed in glucose clearance, suggesting that insulin secretion was adequate. Poore and Fowden (Reference Poore and Fowden2002) showed that basal insulin was reduced in low birth weight pigs but they exhibited a greater insulin response to administration of glucose. It has been postulated that the effects of low birth weight on adult glucose tolerance in humans are due to insulin resistance rather than to insulin deficiency, but a similar situation has not been observed in pigs (Poore and Fowden, Reference Poore and Fowden2003). Taken together, these data provide further evidence for the role of developmental programming in utero and genetically determined glucose intolerance (as indicated by the intergenerational effects) but the mechanisms remain to be established fully.
Maternal birth weight and glucose metabolism in pregnancy
Pregnancy has often been thought of as having a diabetogenic effect in normal carbohydrate metabolism, as shown by hyperglycaemia and hyperinsulineamia in response to maternal feeding (Kyle, Reference Kyle1963; George et al., Reference George, England, Siers and Stanton1978). The gestational onset of diabetogenesis allows higher circulating glucose levels, ensuring sufficient transplacental, gradient-dependent glucose transfer to the foetus. Mothers who have had poor good control of their blood glucose were more likely to have offsprings who were large for gestational age (LGA) at birth, macrosomia (defined by a birth weight of 4 kg or greater) (Girling and Dornhorst, Reference Girling and Dornhorst2003). The data obtained in the present study are somewhat confounded because the pig is a litter-bearing species; however, there are some parallels with results obtained from humans. It should be remembered at this stage that no macrosomal pigs were present in the grandmother litters, and so it was not possible to follow macrosomal animals through pregnancy. G1 N mothers appeared to have better control of their glucose metabolism in pregnancy and mean piglet birth weight was heavier and they gave birth to more piglets with similar body weights, which is comparable with a normal human pregnancy. In contrast, the G1 L mothers who had poorer control of their glucose metabolism gave birth to fewer piglets with a wider variation in birth weights. Moreover, some of the piglets born in the Ln group were above the 90th centile for birth weight, suggesting that nutrient supply in utero was extremely variable. The underlying biological mechanisms as to why the natural variation in G1 L animals was much more variable remain to be established.
Relationships between birth weight and glucose tolerance
There are numerous relationships between growth and development in early life that can be used to predict glucose curve characteristics in later life; however, such correlations are further modified by mothers’ birth weight, their own developmental characteristics and whether the GTT was conducted in the pregnant or non-pregnant state. Of particular interest was that there were many more associations between morphological characteristics of G1 animals and their glucose curve characteristics in the non-pregnant compared to the pregnant state. Moreover, the multifactorial predictor equations are more complex in the non-pregnant state, although some of the variables used are similar. This suggests that pregnancy may have the ability to override some aspects of developmental programming but whether these relationships remain permanently altered requires further investigation. Generally, in humans gestational diabetes mellitus (GDM) tends to disappear following parturition, although such individuals are more likely to exhibit GDM in any subsequent pregnancy (Catalano et al., Reference Catalano, Kirwan, Haugel-De Mouzon and King2003).
Irrespective of whether the G1 L animal is in the non-pregnant or pregnant state, there are a limited number of associations apparent between morphological and GTT characteristics. Whilst a similar situation is apparent for the G1 N pigs in the non-pregnant state, it is not true when the animal becomes pregnant as many more correlations can be observed. This suggests that many of the relationships observed in pregnancy when the whole population data are considered are primarily due to the G1 N animals. What is consistently being demonstrated is that body shape (i.e. PI) at birth tends to be a better indicator of glucose curve characteristics than birth weight alone. Similar correlations have been observed between low birth weight and low PI in humans (Phillips et al., Reference Phillips, Barker, Hales, Hirst and Osmond1994) and pigs (Poore and Fowden, Reference Poore and Fowden2003). As expected, basal insulin appears to be linked to post-weaning growth rate, which has previously been shown in pigs (Weekes, Reference Weekes1986).
In the next generation when the population data were considered as a whole, many of the relationships observed following one-way regression analyses were similar to those observed in G1 in the non-pregnant state. Moreover, many more of the glucose curve characteristics can be predicted from the morphological parameters over the neonatal period compared to the G1 population. As in G1, this too is likely to be due to the relationships observed in Nl animals rather than Ll and Ln pigs. Taken together, the finding again confirms the idea of intergenerational programming that has been previously demonstrated in humans (McCarron et al., Reference McCarron, Smith and Hattersley2004).
Relationships between GTT in pregnancy and reproductive performance
Many of the GGT characteristics in late pregnancy can be used to predict her ensuing reproductive performance. Moreover, it would appear that GGT parameters in the non-pregnant state can also be used as an indicator of litter outcome. There were a limited number of GTT parameters that could be used to predict reproductive capacity in the G1 L compared to G1 N pigs, thereby suggesting that events in utero disrupt the relationship between GTT and reproductive performance.
Conclusions
Intergenerational effects are only partly observed in the pig but this is probably because they are a litter-bearing species, with a natural variation in body weight within each litter. L offspring exhibited impaired glucose metabolism in later life compared to their N sibling but in the next generation a similar scenario was only observed between LL and LN offspring. Despite L showing greater glucose intolerance in late pregnancy and a decreased litter size, average piglet birth was reduced and there was also a large variation in litter weight; this suggests that they were, to some extent, prioritising their nutrient intake towards themselves rather than promoting their reproductive performance. Glucose curve characteristics in the non-pregnant and pregnant state can, to some extent, be used to predict neonatal outcome.
Acknowledgements
The authors wish to thank the staff at The Pig Research and Development Unit for their care of animals throughout the study, and Alison Cordrey and Katharine Perkins for their technical assistance.