1. Introduction
Export promotion measures are popular in developing countries that count on exports to fuel their economic development (Baere, de and Du Parc, Reference Baere and Du Parc2009; Brandt et al., Reference Brandt, Li and Morrow2021). India offers various such measures to its exporters. While export promotion programs increase exports competitiveness, they are costly to implement for governments, increase compliance costs for firms, and have potential general equilibrium effects that are not well-understood, resulting in ambiguous overall welfare effects (Ianchovichina, Reference Ianchovichina2007). There is widespread anecdotal evidence among practitioners and in the media of firms exploiting weaknesses in these programs to defraud tax authorities.
In this paper, we estimate the prevalence and size of fraud in one of the main export promotion programs in India: the Duty Drawback (DBK) scheme, which covered 26% of exports volume over the years 2005–2019. The DBK scheme aims at reimbursing exporting firms taxes they paid on imported inputs used in the production of exports. The Government of India paid out duty drawback amounting to 3 billion US dollars (USD) yearly on average for the period 2007–2016, which represents 1.1% of total exports value in the same period. We focus on fraud whereby exporting firms misreport their exports to customs to unduly gain duty drawback. We indirectly measure fraud by comparing reported exports (by India) to reported imports (by its trading partners) of the same trade flows. When exporting firms misreport to fraud while importers do not, discrepancies in bilateral trade statistics ensue. We identify fraud by linking these discrepancies to changes in the reporting incentives that exporters face under the DBK scheme.
The DBK scheme has three features that make it particularly prone to fraud. First, tax authorities do not reimburse the actual taxes paid on imported inputs used in production of exports. Rather, duty drawback is calculated as a percentage of exports value at a specified rate – called the drawback rate – making exports over-reporting a viable fraud strategy to claim excess duty drawback.Footnote 1 Second, duty drawback is paid in cash to firms, and not in the form of tax credits that can be used against other tax liabilities – as would be the case for VAT input tax credit, for example. Cash is more liquid and versatile than tax credits and thus likely to be particularly attractive to fraudsters. Third, exporters obtain the cash rebate upon exportation, while the proof of payment by the importer – which acts as confirmation that the transaction effectively took place on the declared terms – is only due within one year of the date of export. This time delay allows fraudsters to disappear before authorities are alerted.
We develop a simple model of the reporting problem of the firm, in which the firm decides how much exports to report to customs for a given transaction. We show that an increase in the drawback rate has two countervailing effects. On the one hand, it leads the firm to over-report exports, as the firm gains the drawback rate for each over-reported dollar – we call this the fraud-enhancing effect. On the other hand, it also results in higher enforcement efforts by customs, and a higher fine for a given amount of misreporting. This enforcement effect lowers the incentive to over-report exports in response to an increase in the drawback rate. Whether firms over-report thus depends on which effect dominates.
We make a conceptual distinction between fraud committed by what we call professional fraudsters, which are firms whose primary purpose is to unlawfully claim duty drawback, and fraud committed by legitimate firms who misreport genuine transactions. Fraud is more complicated for legitimate exporters, as proof of payment by the importer needs to be provided within one year of the transaction. Failing to do so would alert authorities and threaten the business sustainability, which is not an issue for professional fraudsters that can simply disappear within a year. Landmark fraud cases often reported in the media tend to be committed by professional fraudsters. Anecdotal evidence suggests that fraud committed by legitimate firms exists, but it requires collusion with the importer to obtain proof of payment. I provide more details in Section 2.3.
We manually collected data published in The Gazette of India annually on the DBK schedules for the years 2005–2019, including the product-specific drawback rates expressed as a percentage of the free-on-board (FOB) export value – i.e., the transaction value that excludes costs of freight and insurance incurred by importers. Drawback rates vary across products annually to reflect changes in the taxes they are meant to reimburse exporters. The schedules also contain drawback caps, limiting the amount of duty drawback per unit for a subset of products. We merge this information to data on trade reporting gaps, defined as the difference between reported exports by India and reported imports by trading partners for each aggregate trade flow at the harmonized system (HS) 6-digit product level.
We identify fraud using two approaches. First, we regress the drawback rates on reporting gaps. Guided by the model, we expect a positive relationship between reporting gaps and drawback rates if fraud via exports over-reporting increases upon a rise in the rates. If customs enforcement increases in tandem, the positive relationship between reporting gaps and rates is expected to be less marked. The reporting gaps are subject to significant measurement errors, which increase the risk of omitted variable bias (OVB) should the errors be correlated with the drawback rates. We include a rigorous set of fixed effects in our regressions (notably only exploiting time variation within a product–importer pair). However, we deem the risk of OVB to be low since the drawback rates vary at the product level. We rule out reverse causality as the changes in the drawback rates reflect changes in the taxes they are meant to reimburse, and cannot be changed in response to fraud at customs.
Our second approach to measuring fraud exploits kinks in the drawback rate schedules. These kinks arise in the presence of caps that limit the amount of drawback claimable per unit exported. These caps imply that over-reporting beyond a certain unit price does not increase the amount of drawback firms get. We name this threshold the cap-implied price, and it varies at the product level over time. We expect caps to remove the incentive to over-report for fraud purposes beyond the cap-implied price. Any exporter that reports a unit price above the cap-implied price because of fraud – i.e., that would have reported a unit price below or at the cap-implied price if not for fraud – will thus report at the cap-implied price. We investigate bunching in the distributions of reported unit values – defined as exports value divided by exported quantities at the country pair–product level – at cap-implied prices. Bunching is expected in the presence of fraud in India's distribution of reported unit values, but not in the distribution of reported unit values by importing countries, which are not impacted by caps. The reported unit values distribution of importing countries thus offers a counterfactual that allows us to interpret bunching in India's distribution as evidence of fraud.
1.1 Main Findings
We find a positive relationship between drawback rates and reporting gaps, consistent with fraud via exports over-reporting. A one percentage point (p.p.) increase in the drawback rate is associated with a 0.747% increase in reported exports relative to reported imports. The average drawback rate in the sample is 1.1%, which implies that reported exports are over-reported by 0.822% on average. Extrapolating levels, we estimate yearly fraud to lie between USD 840 million and 1.3 billion, depending on the chosen specification. This represents 1.4%–2.3% of the total trade value subject to duty drawback. Fraud detected by customs only represents 3.8%–6% of estimated fraud. This suggests that customs are catching only a small fraction of fraudulent transactions.
We present suggestive evidence that customs focus their enforcement efforts on transactions where fraud is more likely. Specifically, the positive relationship between drawback rates and reporting gaps is weaker in the following cases. First, when the drawback rate is high, theory predicts that both the incentive to fraud (fraud-enhancing effect) and the enforcement effort (enforcement effect) increase. Our result thus suggests that the enforcement effect gains in importance for higher drawback rates. Second, the relationship between rates and gaps is also weaker for trade flows with neighboring countries. Transactions whose sole purpose is to claim drawback are more likely to be shipped to nearby countries to save on shipping costs. Customs know this, and our result suggests that they scrutinize these transactions more carefully, which in turn decreases fraud. Third, after a computer-based risk management system (RMS) that automatized the risk assessment was introduced in 2013 (for exports), making the process less reliant on customs officers’ discretion. Our finding is consistent with other studies that highlight the discretionary power of officers as a potential source of fraud and evasion (Dutt and Traca, Reference Dutt and Traca2010; Chalendard et al., Reference Chalendard, Duhaut, Fernandes, Mattoo, Raballand and Rijkers2020). Fourth, for the trade of differentiated products, for which no reference prices exist and that are known to be evasion-prone (Javorcik and Narciso, Reference Javorcik and Narciso2008). In contrast to the literature, we find fraud to be lower for these goods, which suggests higher customs enforcement targeted at these goods.
Last, we present evidence of bunching in the distribution of reported unit values by India at kinks in the drawback schedule. Specifically, we show that when drawback is capped at a certain amount per unit, exporters tend to report unit values just below the cap-implied price – the price above which higher reported unit values do not increase the amount of drawback claimable. This excess bunching is not present in the distribution of reported unit values by importers, who are not affected by the drawback caps. Bunching is indirect evidence of fraud, as exporters that would report above the cap-implied price to fraud in the absence of caps end up reporting at the cap-implied price in the presence of caps, thus creating excess mass at the cap-implied price.
We find bunching to be more pronounced for trade flows subject to high drawback rates, which suggests higher fraud levels when drawback rates are high, consistent with our baseline result. Based on products for which caps are introduced or abolished over time, we show that bunching arises after caps are introduced, and disappears after caps are abolished.
1.2 Relation to the Literature
This paper relates to several strands of the literature. First, we provide evidence of systematic fraud in the Indian Drawback Scheme, which complements existing anecdotal evidence (e.g. Kumar, Reference Kumar1999; Prakash, Reference Prakash2013; Gupta, Reference Gupta2018), as well as government and media reports. To the extent of our knowledge, this is the first study that uncovers and quantifies fraud in a major export promotion scheme. The existence of widespread fraud has potentially broad implications for the welfare effects of duty drawback programs, on which studies are relatively few (Panagariya, Reference Panagariya1992; Ianchovichina, Reference Ianchovichina2007; Connolly and Yi, Reference Connolly and Yi2015; Brandt et al., Reference Brandt, Li and Morrow2021). Our study suggests that a quantitative assessment of welfare taking into account fraud may be warranted, at least in the case of India. Fraud may affect welfare via the forgone government revenues, the cost of enforcing the drawback rules to non-compliant firms, and potential resource misallocation resulting from exporting firms gaining undue competitive advantage via fraud.
Second, our paper exploits correlations between tax (rebate) rates bilateral trade and mirror statistics to measure fraud, a method fist developed by Fisman and Wei (Reference Fisman and Wei2004) to measure tariff evasion, and since then used in many studies in different contexts (Javorcik and Narciso, Reference Javorcik and Narciso2008, Mishra et al., Reference Mishra, Subramanian and Topalova2008; Ferrantino et al., Reference Ferrantino, Liu and Wang2012; Stoyanov, Reference Stoyanov2012; Sequeira, Reference Sequeira2016; Javorcik and Narciso, Reference Javorcik and Narciso2017; Demir and Javorcik, Reference Demir and Javorcik2020; Bussy, Reference Bussy2021b, among others). Our paper shows that duty drawback fraud affects reported exports, unlike tariff evasion which impacts reporting gaps via under-reported imports, and thus points to a risk of omitted variable bias when estimating tariff evasion in the importing country if tariff rates are correlated to duty drawback rates in the exporting country.
Third, our study relates to the public economics literature that uses bunching at discontinuities in the marginal tax rate schedule to estimate behavioral responses of firms and individuals to tax rate changes (e.g. Saez, Reference Saez2010; Chetty et al., Reference Chetty, Friedman, Olsen and Pistaferri2011; Kleven, Reference Kleven2016). Specifically, we detect fraud thanks to bunching in the distribution of reported unit values by India (the exporting country) at kink points in the drawback rate schedules. A critical feature of our study is that we measure excess bunching by comparing the distribution of unit values reported by India to that of unit values reported by importing countries. Hence, we need not estimate a counterfactual distribution of reported unit values in the absence of bunching.
Last, we speak to the literature that studies the effect of enforcement on customs fraud (Dutt and Traca, Reference Dutt and Traca2010; Chalendard et al., Reference Chalendard, Duhaut, Fernandes, Mattoo, Raballand and Rijkers2020). In particular, we provide suggestive evidence that enforcement efforts increase for trade flows that are prone to fraud, such as those of differentiated products (Javorcik and Narciso, Reference Javorcik and Narciso2008), those with neighboring countries, and those subject to higher drawback rates (Bussy, Reference Bussy2021b). Increased enforcement in turn results in less fraud.
1.3 Structure of the Paper
This paper is structured as follows. In Section 2, we provide information on the duty drawback scheme and other relevant institutional details. Section 3 introduces a simple model that motivates our analysis. Section 4 presents the data, and the empirical strategy is laid out in Section 5. We present and discuss the results in Section 6. Section 7 concludes. Additional tables and figures labelled with A and B, respectively, followed by their reference number are available in the Online Appendix.
2. Institutional Background
In this section, we introduce the DBK scheme in India, focusing on how it works in practice. We explain known fraud schemes, and discuss customs enforcement in practice.
2.1 The Duty Drawback Scheme
DBK schemes allow exporters to claim a refund of customs duty paid on imported intermediate inputs used in the production of exported goods.Footnote 2 Many – mostly emerging – economies have a DBK in place, with the explicit aim of promoting export-oriented industries – a practice allowed by the World Trade Organization (WTO).Footnote 3 Reimbursing import duties on intermediate inputs increases the competitiveness of the export sector by lowering the production costs of exported goods.
In India, Sections 74 and 75 of the Indian Customs Act establish the rules governing the DBK scheme. Crucially, instead of reimbursing import duties actually incurred by the exporter, duty drawbacks are calculated as a percentage of the FOB value of exports. In other words, a firm that exports while sourcing all its intermediate inputs domestically is entitled to duty drawback at the specified rate, despite having not paid any import duties in the first place. The DBK rates are product-specific, and change annually to reflect fluctuations in import duties paid by the average exporter of that good.
2.2 How it Works in Practice
2.2.1 The Drawback Claim Process
To export or import goods and services, a firm has to register with the Directorate General of Foreign Trade, who provides a unique identifying code to the firm – called an exporter importer code. The registration enables the firm to approach Customs at a port to trade internationally. To export goods, a firm files a shipping bill with the port, and goods go through customs examination – more details are provided below. The shipping agent can load goods on the vessel for export after the examination team clears them. Once the vessel sails, the goods are deemed exported. Customs update their records, and the exporter can claim the drawback refund based on the applicable drawback schedule. The exporter files the claim for drawback refunds, and a customs officer checks the export record and clears the claim for refund, which gets credited to the exporter's accounts within a month. The exporter has to produce a record of remittance in the form of a Bank Realization Certificate – a certificate issued by the exporting firm's bank that confirms that payment by the importing firm has been received, specifying the remittance amount – to the customs port within one year of the date of export.
2.2.2 DBK Rates and Caps
The schedule of DBK rates is updated annually and published in The Gazette of India. Not all goods are subject to a positive DBK rate. Furthermore, a cap on the amount of drawback claimable per unit is imposed on some products, which may change over time. Up to financial year 2016–2017, there were two categories of drawback rates in the schedules. Which rate applied to a given transaction depended on whether the firm had already claimed other tax credits associated with that transaction. Specifically, tax credits claimable under the Central Value Added Tax (CENVAT) system – which worked in a similar way as Value Added Tax (VAT) systems around the world – could be claimed by the firm via either CENVAT or at customs in the form of a duty drawback. CENVAT covered selected centrally administered excise and service duties on manufactured goods – to which we refer as CENVAT taxes henceforth. Hence, drawback rates when CENVAT had been availed were lower, as they only reflected import duties and not CENVAT taxes. For each transaction, firms had a choice to claim back CENVAT taxes in the form of tax credits via CENVAT itself – which could be used to offset other tax liabilities – or via DBK at customs in the form of a cash transfer proportional to the export value.Footnote 4 Since the introduction of the Goods and Services Tax (GST) in July 2017, which replaced CENVAT, only import duties can be claimed via DBK.Footnote 5
Changes to drawback rates thus reflect changes in tariff rates on imported intermediate inputs, changes in the mix of imported intermediate inputs used in production, and – prior to 2017 – changes in excise and service duty rates paid on inputs in the case of drawback rates when CENVAT has not been availed.
2.3 Fraud Scheme
Firms may misreport the value of exports to unduly gain duty drawback, the main fraud strategy consisting in over-reporting exports at customs. We conceptually differentiate between two types of fraud.
The first one is committed by what we casually name professional fraudsters, which are individuals that set up firms whose primary purpose is to claim duty drawback unlawfully. Such firms, akin to invoice mills (Waseem, Reference Waseem2020), exist for the sole purpose of claiming DBK and usually operate in collaboration with a partner firm abroad. After going through the registration formalities, these firms tend to export low-quality legitimate items initially because customs risk management systems treat new exporters with suspicion. After the first few legitimate transactions, the firms start misreporting exports. The drawback refunds get deposited in the firms’ accounts at the time of export. Typically, these firms export cheaper goods and overvalue them with fake invoices to claim the drawback refund. The time lag between the refund date and verification of funds remittance via Bank Realization Certificate enables professional fraudsters to disappear with the duty drawback money. Another firm can then be created to continue fraud operations, potentially changing the traded products to avoid suspicion. On the importing side, the importer is generally a shell company linked to the exporter. The importer either receives a different low-value invoice – to avoid import duties – or in some cases, the importer does not claim the goods at all. The imported goods are either sold by the importer at a low price, or destroyed.
Examples of professional fraudsters regularly emerge in the news. In March 2018, the newspaper Business Standard reported that Customs detected fraud of 510 million Rupees (6.8 million USD) by firms exporting carpets, which failed to provide proofs of remittance. Upon inspection, authorities realized that these firms were not legitimate and existed for the sole purpose of claiming duty drawback.Footnote 6 In another case reported by The Times of India in August 2021, arrests were made in relation to DBK fraud by over-valuation of exports worth 18 billion Rupees (240 million USD) made by 124 bogus companies.Footnote 7
The second type of fraud is committed by legitimate firms that cannot disappear after a few transactions. These firms misreport the value of genuine transactions in collusion with the importing firm, who pays the declared amount to the exporter. It is essential that the remittance amount matches the declared value of exports to avoid subsequent detection by customs, when Bank Realization Certificates are collected and verified. The amounts of drawback claimed illegally can then be shared between the two firms, while the excessive remittance paid by the importer may be transferred back to the importer in future operations.
2.4 Customs Enforcement and Fines
2.4.1 Customs Enforcement
Indian Customs guard India's economic frontiers, in coordination with various other local and central government entities. Once a firm files a shipping bill with the port, the transaction undergoes a risk assessment. The shipment may be physically examined by a customs officer when the transaction attracts customs’ attention. The method of risk assessment changed significantly at the end of 2013, when a new computer-based RMS was implemented to monitor exports (that system had already been in place to screen imports since 2005). While risk assessment relied on the judgement and experience of customs officers prior to 2014, the RMS now flags suspicious transactions based on predetermined criteria, randomly assigns an officer to the case, and provides precise instructions for the examination of goods. The criteria used to flag transactions include the history of the exporting firm, deviations of the reported unit price from reference prices (based on market prices or past reported unit prices of similar goods), and the country to which goods are exported – for example, transactions to Singapore, Hong Kong, and the United Arab Emirates are watched more closely due to compliance concerns.Footnote 8
2.4.2 Fines
Upon detection of fraud, customs can recover the amount of duty fraudulently claimed and impose civil and penal punishments. Chapter XIV and Section 135 of the Customs Act specify that fraudsters are subject to both fines and imprisonment terms, both of which increase with the severity of the infraction, i.e., with the amount of duty drawback unlawfully claimed. Large infractions (duty evaded in excess of 5 million Rupees) result in fines and a prison term of up to 7 years.
3. Model and Predictions
We build a simple model to explicitly derive testable predictions that we take to the data.
3.1 Model
Consider the reporting problem of an exporter, who exports goods of value E > 0 to an importer denoted i, on which a drawback is available at rate d ≥ 0. At customs, the firm indicates reported exports of value R ≥ 0, i.e., it misreports by an amount M ≡ R − E. The trader is caught with probability q(d, i) > 0, which depends on the rate of drawback d and the identity of the importing country i. The reporting problem faced by the exporter is:
 $$\max _R\quad ( 1-q( d, \;i) ) Rd + q( d, \;i) ( Ed-X( M, \;d) ) , \;$$
where X(M, d) is a fine the exporter must pay when caught misreporting. The first-order condition for the problem above equates the marginal benefit and cost of misreporting:Footnote 9
 $$( 1-q( d, \;i) ) d = q( d, \;i) X_M.$$
The object of interest is the comparative statics of optimal reported exports with respect to the drawback rate,  $R_d^{\rm \star } $, which can be obtained by taking the derivative of expression (2) with respect to d – noticing that X M depends on d directly, and indirectly via R which depends on d itself:
 $$R_d^{\rm \star } = \displaystyle{{( 1-q) -q_d( d + X_M) -qX_{M, d}} \over {qX_{M, M}}}.$$
-
Assumption 1. The fine is convex in the amount of misreporting (X M > 0, X M,M > 0). Furthermore, for a given amount of misreporting M, a higher drawback rate d results in a larger fine (X M,d > 0).
-
Assumption 2. The probability of fraud detection q may depend positively on the drawback rate d (q d ≥ 0).
-
Assumption 3. The probability of detection q(d, i) is higher for countries known to be associated with fraudulent trade for any level of drawback rate d. Denoting this set of countries as
 ${\cal I}^{{\rm risky}}, \;q( d, \;j) > q( d, \;i) , \;\forall d, \;j\in {\cal I}^{{\rm risky}}, \;i\notin {\cal I}^{{\rm risky}}$

Under assumptions 1 and 2, the sign of  $R_d^{\rm \star } $ depends on two countervailing forces. On the one hand, a higher drawback rate increases the amount of money gained for any amount of misreporting. We call this the fraud-enhancing effect. On the other hand, a higher drawback rate d may result in a higher probability of detection (q d ≥ 0), and also in a higher fine (X M,d > 0). We call this the enforcement effect.
 $R_d^{\rm \star } > 0$ when the fraud-enhancing effect dominates:
 $$\underbrace{{( 1-q( d, \;i) ) }}_{{{\rm fraud}\hbox{-}{\rm enhancing}\,{\rm effect}}} > \underbrace{{[ {q_d( d + X_M) + q( d, \;i) X_{M, d}} ] }}_{{{\rm enforcement}\,{\rm effect}}}.$$
As the enforcement effect increases, the exporter over-reports export less in response to an increase in the drawback rate. In an extreme case in which the enforcement effect dominates, reported exports may theoretically decrease as the drawback rate rises.Footnote 10
3.1.1 Discussion of Assumptions
Under assumption 1, the fine is convex in the amount of misreporting, and increasing in the drawback rate for a given level of misreporting. As discussed in section 2, fines are increasing in the severity of the infraction in reality, and are calculated based on the amount of fraud, M × d. Furthermore, more important infractions lead to more severe penalties in a non-linear fashion, potentially involving prison terms and penal charges. The assumed properties of X(M, d) thus reflect reality accurately.
Assumption 2 states that a higher drawback rate may result in a higher chance of getting caught by customs. This would happen if customs have limited resources to minimize overall evasion, since a given amount of misreporting results in higher losses to customs when the drawback rate is higher. While this is not essential to our results, it reflects our understanding of how customs operate.
If either q d > 0 or X M,d > 0, or both hold, the enforcement effect is non-zero and an increase in the drawback rate d may lead exporters to over-report exports to a lesser extent than they would if only the fraud-enhancing effect was operating. Furthermore, when the importer is deemed risky  $( i\in {\cal I}^{{\rm risky}}) $, the enforcement effect increases while the fraud-enhancing effect diminishes, further dampening the incentive of exporters to over-report exports.
Another important implicit assumption we make is that the reporting choice of the exporter depends only on the rate of drawback. The exporter may be subject to other incentives, such evading VAT or avoiding capital controls (Ferrantino et al., Reference Ferrantino, Liu and Wang2012). We discuss in more details the assumptions needed for fraud identification in Section 5.1.
3.1.2 Aggregation and Reporting Gap
Trade flows between countries at the product level encompass all transactions of a given good for a given time period. Let the index t denote transactions of that good for which exporters solve the above problem. Aggregate reported exports are thus given by  $R_{{\rm total}}^{\rm \star } = \sum _tR_t^{\rm \star } $.Footnote 11 Let
 $I( {{\boldsymbol T}_i} ) $ be aggregate imports as reported by importers to their own customs, where
 ${\boldsymbol T}_i$ is a vector of taxes and administrative measures importers face that might influence their reporting decision.Footnote 12 The reporting gap (G) for this good is thus:Footnote 13
 $$G = \log ( R_{{\rm total}}^{\rm \star } ) -\log ( I( {\boldsymbol T}_i) ).$$
From this expression, it becomes apparent that the reporting gap can be influenced by reporting incentives of both the exporter and importers. We do not take a stance on whether the reported value by the importer is the true value or not. Rather, the empirical exercise consists in studying how the gap changes with changes in the rate of drawback, holding the reporting incentives of the importer constant.
3.2 Predictions
A set of predictions follow.
Prediction 1. An increase in the drawback rate (d) leads to exports over-reporting when condition (4) holds, which results in an increase in the reporting gap (G), and vice-versa when (4) does not hold.
Prediction 2. Condition (4) is less likely to hold as the drawback rate (d) increases, under the sufficient conditions that q d,d ≥ 0 – i.e., the probability of detection (q) is weakly convex in the drawback rate (d) – and X M,d,d ≥ 0 – the marginal effect or misreporting on the fine is weakly convex in the drawback rate (d).Footnote 14
Prediction 3. Condition (4) is less likely to hold for trade with risky importing countries
$( i\in {\cal I}^{{\rm risky}}) $.Prediction 4. Condition (4) is less likely to hold for higher detection probabilities, conditional on the drawback rate (d) and the importing country (i).

4. Data
In this section, we detail the data used in this study. We start with the trade data and the construction of the reporting gaps, followed by data on the drawback scheme.
4.1 Reporting Gaps
Trade statistics between countries at the 6-digit product level of the Harmonized System (HS) is from UN Comtrade. Tariff data at the same level of aggregation are from the UNCTAD TRAINS database. The data consist of an unbalanced panel where the unit of observation is a product exported by India to an importing country, observed over time at the yearly frequency over years 2005–2019. We observe both quantities traded and total trade value for each trade flow. The reporting gaps are constructed using bilateral mirror statistics, i.e., information on the same trade flow reported as exports by India, on the one hand, and as imports by the partner country on the other hand. Following the literature, we define:
 $${\rm Reporting\ ga}{\rm p}_{ipt} = \log ( {\rm exports}_{i, pt}^{{\rm India}} ) -\log ( {\rm imports}_{{\rm India}, pt}^i ) , \;$$
where i stands for the importing country, t for time, and p for the product. Superscripts denote who reports the trade flow. The gaps are expressed in terms of quantities or value. For small values of the gap, expression (6) is approximately the difference between reported exports and imports as a fraction of reported imports. When data on one side are missing, the gap is coded as missing.Footnote 15
The reporting gaps are subject to measurement errors stemming, among other factors, from discrepancies in statistical treatment of the data in each country, and differences in valuation – exports are reported FOB, while reported imports include Cost of Freight and Insurance (CIF). For a detailed description of the reporting gaps, see Bussy (Reference Bussy2021a).
Descriptive statistics of the reporting gaps can be found in Table 1. There are 1.9 million observations of the value reporting gap. The mean value reporting gap is −0.21, which implies that the discrepancies between reports represent ca. 21% of the underlying trade flows on average. This is larger than observed in larger samples (the average gap is 3% in Bussy (Reference Bussy2021a), for example). Reported imports tend to be larger than reported exports. Quantity reporting gaps exhibit similar features. Tariffs imposed on imports from India in partner countries are 6% on average. The tariff data are only available for around 58% of the value trade gap observations.
Descriptive statistics of the main variables

Notes: The reporting gaps are computed according to equation (6). Rates are expressed in percentages, while changes are expressed in percentage points (p.p.). Drawback caps are expressed in USD per unit.
4.2 The Drawback Scheme
Data on the Drawback schedules at the product level come from official documents published in The Gazette of India. The schedules are usually updated annually to reflect changes in the import duties exporting firms are subject to, which, as explained in Section 2, the Drawback Scheme aims at reimbursing. The schedule consists of two elements. First, a drawback rate expressed in percentage of the FOB value of exports. For instance, if this rate is 1%, the exporter is entitled to a cash transfer of 1% of the value of its exports. Second, a cap may restrict the amount of drawback that can be claimed per unit of good exported. The caps are also revised on an annual basis, and are expressed in Rupees. We convert them to USD. Both rates and caps are specified for a subset of products, and are specified at various levels of aggregation of the HS schedule.Footnote 16 This data are available for 2005–2019 and 56% of products are subject to a positive drawback rate while 7% of products are subject to a cap. The drawback schedule is not necessarily updated on 1 January, whereas the trade data are available on a calendar year basis. To merge both, we weight the drawback data proportionally.
One important feature of the Duty Drawback system prior to 2017 is that firms can claim different drawback rates depending on whether CENVAT has been availed for that transaction or not. When CENVAT is availed, all taxes on inputs falling under the CENVAT system have already been claimed by the firm – see explanations in Section 2. The drawback rate when CENVAT has been availed therefore only covers import duties paid on imports and is thus smaller – 0.42 p.p. smaller on average than the drawback rate if CENVAT has not been availed. The evolution of the average rates over time is depicted in Figure B.1. The difference between the two rates reflects CENVAT taxes. Figure B.2 plots changes in the rates (and caps) when CENVAT is availed versus not availed. The changes are correlated, yet there are many instances where they do not coincide. Henceforth, unless specified, the term drawback rate refers to the rate when CENVAT has not been availed.
Descriptive statistics of the rates and caps can be found in Table 1. The mean rate is 1.1%, and it has decreased slightly over time. The average cap per unit is around 3 USD, but this number cannot be easily interpreted since unit types (kg, piece, etc.) vary across products.
5. Empirical Strategy
In this section, we first lay out the regressions we estimate to investigate the relationship between reporting gaps and drawback rates, and then present our approach to detect bunching at the drawback caps.
5.1 Regressions
5.1.1 Baseline Regression
Our empirical approach consists of regressing the reporting gaps on the drawback rates:
 $${\rm Reporting\ ga}{\rm p}_{ipt} = \alpha {\rm DrawbackRat}{\rm e}_{ipt} + {\rm F}{\rm E}_{ip} + {\rm F}{\rm E}_{it} + {\rm \epsilon }_{ipt}.$$
Importer–product and importer–year fixed effects (FE) are included to account for time-invariant differences across importer–product pairs, as well as importer–specific factors that change over time – such as changes in trade statistics recording methodologies. The parameter of interest is α, which we expect to be positive in the presence of fraud: a higher rate induces exporters to over-report exports, resulting in a higher reporting gap – cf. prediction 1. All rates are expressed as decimals in the regressions (i.e. a drawback rate of 1% is written as 0.01 in the data).
5.1.2 Identifying Assumptions
Reverse causality, whereby fraud levels would impact the level of drawback rates, is very unlikely in this setting. The drawback rate on exports of a good is adjusted annually to reflect taxes paid on inputs by producers of that good. When these taxes change, the drawback rate changes accordingly. There is no scope – in the law or in practice – for customs to adjust rates in response to observed fraud (cf. sections 74 and 75 of the Indian Customs Act). Bias resulting from OVB is in principle possible if these variables are correlated with the drawback rates and the reporting gaps. Potential omitted variables are not limited to the exporter's side, but may also affect the gap via the reporting behavior importers — e.g., if importers evade tariffs or non-tariff barriers (Kee and Nicita, Reference Kee and Nicita2022). To mitigate the risk of OVB, we check that our results hold controlling for tariff on the importers’ side. The strict set of fixed effects we use should absorb most time-varying tax incentives that affect all products in the same way. Together with the fact that the drawback rates vary at the product level over time, we deem the risk of OVB to be low. Overall, while we do not claim that our results are causal, we feel confident that they are not spurious correlations.
5.1.3 Additional Regressions
To test prediction 2, the square of the drawback rate is included in the regression equation:
 $${\rm Reporting\ ga}{\rm p}_{ipt} = \beta {\rm DrawbackRat}{\rm e}_{ipt} + \gamma {\rm DrawbackRate}_{ipt}^2 + {\rm F}{\rm E}_{ip} + {\rm F}{\rm E}_{it} + {\rm \epsilon }_{ipt}.$$
According to prediction 2, an increase in the drawback rate dampens the fraud-enhancing effect (through a higher detection probability), and amplifies the enforcement effect (through a higher detection probability and a higher fine). We therefore expect that β > 0 and γ < 0 such that the increase of fraud is lower for higher drawback rates.
In order to test predictions 3 and 4, we interact the drawback rate with product, importing country or time characteristics that are likely to affect the enforcement intensity at customs:
 $${\rm Reporting\ ga}{\rm p}_{ipt} = \delta {\rm DrawbackRat}{\rm e}_{ipt} \times \phi {\rm Characteristic}{\rm s}_{i/p/t} + {\rm F}{\rm E}_{ip} + {\rm F}{\rm E}_{it} + {\rm \epsilon }_{ipt}.$$
Specifically, we consider three cases. First, if the importing country is deemed risky by customs, we expect enforcement to be stricter. Second, if the product is differentiated, misreporting prices may be easier for exporters, yet customs may also pay stricter attention to these goods for the same reason (Bussy, Reference Bussy2021b). Third, a time dummy denoting the implementation, in 2014, of the online customs RMS, which is believed to have been effective in detecting fraud – cf. section 2.
To investigate fraud via misclassification, we augment equation (7) with the average duty drawback rate on goods within the same HS 4-digit category, weighted by trade value.
 $$ \eqalign{ {\rm Reporting\ ga}{\rm p}_{ipt} = \eta {\rm DrawbackRat}{\rm e}_{ipt} + \zeta {\rm DrawbackRateSimilarGood}{\rm s}_{ipt} + {\rm F}{\rm E}_{ip} + {\rm F}{\rm E}_{it} + {\rm \epsilon }_{ipt}.}$$
A negative coefficient ζ is consistent with misclassification for fraud purposes (Fisman and Wei, Reference Fisman and Wei2004). The intuition is best conveyed with an example. Consider two similar goods, A and B. If the drawback rate on B increases (relative to the rate on A), exporters may mislabel good A as good B to claim higher drawback, resulting in a decrease in reported exports of good A, and thus an increase in the reporting gaps associated with good A. There is a negative relationship between gap A and drawback rate B. Hence, an increase in the rate on A (relative to that on B) leads to an increase in the reporting gap of A for two reasons: first, exporters of good A over-report more; second, exporters of good B misclassify their goods as good A. In the data, the drawback rates and the drawback rates on similar goods are positively correlated. Since we expect ζ to be negative, not controlling for the drawback rate on similar goods results in  $\hat{\alpha }$ estimated in equation (7) to be negatively biased due to omitted variable bias. Hence, explicitly controlling for the drawback rate on similar goods should result in a more positive coefficient on the drawback rate (i.e.,
 $\hat{\eta } > \hat{\alpha }$).
5.2 Bunching
On some products which are subject to a positive drawback rate, a cap limits the rupee amount of drawback claimable per unit. This implies that for a given unit, reporting a higher price results in higher drawback payments up to the point when the cap is reached. Beyond that point, the Rupee amount of drawback per unit remains the same irrespective of the reported price. In the absence of a cap, the marginal benefit of over-reporting the unit value is the drawback rate d pt for product p at time t. When drawback is capped at value κ pt per unit, there exists a price beyond which the marginal benefit of over-reporting is 0, which we define as the cap-implied price  $\bar{c}_{pt}\equiv \kappa _{pt}/d_{pt}$.
For the sake of illustration, consider the case of a product p at time t for which exporters in India over-report unit values (relative to those reported by importers) by an amount m ipt which depends on the product, time, and importing country i. For simplicity, let us also assume that no other factor affects reported unit values beside fraud, such that  $UV_{ipt}^{{\rm India}} = UV_{ipt}^i + m_{ipt}$ where
 $UV_{ipt}^r $ denotes the reported unit value reported by India or importing country i (r ∈ {India, i}).
Consider first the case where caps exist but do not apply. This is a purely hypothetical case to illustrate the argument, as in reality, there are either no caps, or caps that are enforced. Panel (a) of Figure 1 plots the density distribution of unit prices reported by importers (dashed blue line) and exporters (dash–dot green line) relative to the hypothetical cap-implied price across products, time, and importers.Footnote 17 The key takeaway from this figure is that unit values reported by India are higher due to fraud, which shifts the distribution of  $UV_{ipt}^{{\rm India}} /\bar{c}_{pt}$ relative to that of
 $UV_{ipt}^i /\bar{c}_{pt}$ by a distance of
 $m_{ipt}/\bar{c}_{pt}$. Furthermore, there is no discontinuity in the distributions.
Bunching at caps
Notes: Illustrative distributions of the ratios of reported unit values to the cap-implied price.

A value of 1 indicates that the reported unit value equals the cap-implied price. Panel (a) depicts the situation where caps do not apply and plots the distribution of unit values reported by the importer (dashed blue line) and the distribution of unit values reported by India (dot–dashed green line). The latter is shifted to the right relative to the former, because firms in India over-report unit values to claim DBK. Panel (b) depicts the same distributions when caps apply. Bunching arises at the cap-implied price because the incentive to over-report vanishes beyond the cap-implied price. All reported unit values that exceed the cap-implied price because of fraud are now bunched at the cap-implied price.
Consider now the case in which caps do apply. To understand why bunching arises, it is useful to consider three separate ranges of reported unit prices by the exporter in the original distribution of Panel (a). First, for all unit values reported by exporters below the cap implied price,  $UV_{ipt}^{{\rm India}} \in ( {0, \;{\bar{c}}_{pt}} ) $, duty drawback is paid at rate d pt – the caps are not binding and thus do not influence reported unit values. The distribution of
 $UV_{ipt}^{{\rm India}} $ remains unchanged. Second, for all unit values
 $UV_{ipt}^{{\rm India}} \in ( {{\bar{c}}_{pt} + m_{ipt}, \;\infty } ) $, the cap fully binds, in the sense that all fraud is removed by the introduction of the cap. The distributions of unit values reported by exporters and importers thus coincide when caps apply. Finally, for all unit values
 $UV_{ipt}^{{\rm India}} \in [ {{\bar{c}}_{pt}, \;{\bar{c}}_{pt} + m_{ipt}} ] $, caps partially bind and remove part of fraud m ipt, up the point where
 $UV_{ipt}^{{\rm India}} = \bar{c}_{pt}$, causing bunching at
 $\bar{c}_{pt}$ (1 in the graph). Intuitively, these are cases where over-reporting by the full amount m ipt would bring the reported unit value above the cap-implied price, but where the unit value in the absence of fraud is lower than
 $\bar{c}_{pt}$. In these cases, exporters over-report up to the cap-implied price, but not beyond. Bunching at the cap is thus an indication of fraud, as there is no reason to observe excess bunching in the distribution of reported unit values by India relative to that reported by importing countries if the caps were not limiting the benefit of over-reporting.
Three points should be noted. First, we express unit prices as ratios of the cap-implied prices because the latter vary across products and time. Hence, bunching happens at different places in the distributions of reported unit values. Normalizing allows us to identify bunching at value 1 of the normalized distribution. Second, as explained in Section 4.1, various measurement errors beside fraud cause differences between reported values and quantities – and thus  $UV_{ipt}^{{\rm India}} $ and
 $UV_{ipt}^{\rm i} $. If these errors are large relative to m ipt, it is unclear how the distributions of reported prices by exporters and importers will look relative to each other – in particular, the shift highlighted in Panel (a) of Figure 1 may not be visible in the data. There is however no reason to believe these measurement errors to be more acute closer to the cap-implied prices. Any observed bunching is thus not likely driven by such errors. Third, the extent of bunching is not constant across observations, since it depends on the size of the red shaded area in Panel (b) of Figure 1, which itself depends on the number of observations with
 $UV_{ipt}^{{\rm India}} \in [ {{\bar{c}}_{pt}, \;{\bar{c}}_{pt} + m_{ipt}} ] $. The size of this set increases in the amount of fraud per unit m ipt.
6. Results
This section is divided into three parts. First, we discuss the main results based on the correlation between reporting gaps and drawback rates. We find evidence consistent with fraud and considerable mitigating effects of enforcement. Second, we show that exporters’ reported unit values bunch at kinks in the drawback rate schedule. Third, we provide tentative calculations of fraud levels based on point estimates from our regression results, and compare our estimates to fraud levels actually detected by Indian customs.
6.1 Fraud and Enforcement
6.1.1 Fraud
The estimates from our baseline regression (Equation (7)) can be found in Table 2. A one p.p. increase in the drawback rate is associated with a 0.747% (p = 0.019) increase in the reporting gaps, consistent with exporters over-reporting exports to unduly gain duty drawback – cf. Prediction 1 of the model. To get a sense of magnitudes, the average drawback rate is 1.1%, which implies that, on average, reported exports are over-reported by 0.822% relative to reported imports for fraud reasons.Footnote 18 The reporting gaps in terms of quantities are not significantly associated with changes in the drawback rates, which suggests that fraud takes place via manipulation of reported prices.
Correlation between reporting gaps and drawback rates

Notes: *p < 0.1; **p < 0.05; ***p < 0.01. p-values shown below estimates. Standard errors are clustered at the year level. The dependent variable is the gap between reported exports by the exporter and reported imports by the importer, expressed in terms of value or quantity, and calculated according to expression (6). In columns (5) and (6), the drawback rate on similar goods is the trade-weighted average of the drawback rates on goods within the same HS 4-digit category.
Prior to 2017, firms could choose to get a refund of CENVAT taxes in the form of a cash duty drawback at customs – see Section 2 for details. This resulted in a higher DBK rate than in the case where only import duties are reimbursed via drawback. We hypothesize that a trader whose aim is to fraud will choose not to avail CENVAT – i.e., not to request a rebate of CENVAT taxes via the CENVAT system itself – and rather claim the higher duty drawback rate at customs. Two reasons motivate this hypothesis. First, tax rebates claimed via CENVAT are given in the form of tax credits, which can only be used against other tax liabilities, whereas tax rebates via duty drawback are in the form of a prompt cash transfer – within a month of the export date. Cash should be more appealing to any firm. Professional fraudsters rely on their disappearance before payment by the importer needs to be proven, while legitimate firms may wish the cash for day-to-day operations. Second, claiming all tax rebates at customs lowers the administrative burden. Consistent with this hypothesis, the reporting gaps are uncorrelated with the drawback rates when CENVAT has been availed – cf. columns (3) and (4) of Table 2 – suggesting that fraud is concentrated in transactions where firms choose the higher drawback rates.
Controlling for the tariff rate faced by the importer is important, since changes in tariffs may induce importers to under-report imports values at their customs (Fisman and Wei, Reference Fisman and Wei2004; Javorcik and Narciso, Reference Javorcik and Narciso2008, Reference Javorcik and Narciso2017; Sequeira, Reference Sequeira2016), which may contaminate our results if tariff and drawback rates are correlated.Footnote 19 However, data on tariffs is only available for half of the observations in our sample, which implies that controlling for tariffs in regressions halves the sample size. Focusing on the sample with tariff data, we show that controlling for tariffs leaves our estimates unchanged – cf. Table A.2. In what follows, we omit tariffs in our regressions to maximize the sample size. All results hold when controlling for tariffs. As shown in Tables A.4 and A.5, the results are also robust to the inclusion of different sets of fixed effects.
Columns (5) and (6) show estimates when controlling for the average drawback rate on similar goods. Consistent with misclassification, the coefficient on drawback rate on similar goods is negative – although not significant. The coefficient on drawback rate also increases significantly, as expected and consistent with a negative omitted variable bias in columns (1) and (2).Footnote 20 Based on these results, it is difficult to assess confidently whether misclassification takes place or not.
All the results described in Table 2 remain qualitatively unchanged using the alternative measure of the reporting gaps that admits zero flows introduced in Footnote 15 – cf. Table A.3.
6.1.2 Enforcement
While the enforcement effort by customs is not directly measurable in our data, we provide indirect evidence that enforcement curbs fraud. All the results to which this discussion refers are in Table 3.
Indirect evidence on effect of enforcement

Notes: *p < 0.1; **p < 0.05; ***p < 0.01. p-values shown below estimates. Standard errors are clustered at the year level. The dependent variable is the gap between reported exports by the exporter and reported imports by the importer, expressed in terms of value or quantity, and calculated according to expression (6). Differentiated is a dummy for differentiated goods according to Rauch (Reference Rauch1999). We include the dummy in addition to the interaction in columns (5) and (6) as very few products change differentiated status over time as product classifications change. Risky importer is a dummy for exports from India to Singapore, Hong Kong and the United Arab Emirates (UAE). Contiguous is a dummy for exports to contiguous countries. Post-2013 is a dummy for observations after year 2013.
First, the point estimates in column (1) suggest that less fraud appears to occur in trade with importing countries deemed risky from a compliance standpoint by Indian customs – namely Singapore, Hong Kong, and the United Arab Emirates. This suggests that fraudsters might avoid these countries for the purpose of DBK fraud, perhaps because they expect higher scrutiny at customs – cf. Prediction 3. However, the coefficient on the interaction of the drawback rate and the dummy for a risky importing country is not significant.
Second, fraud appears to increase more slowly for higher rates of duty drawback, as the negative coefficient on the square of the drawback rate indicates. This is consistent with the enforcement effect increasing faster than the fraud-enhancing effect at higher values of drawback rates in the model, cf. Prediction 2.
Third, fraud appears to be much more prevalent in exports to contiguous countries (Nepal, Pakistan, Bangladesh, Bhutan, Myanmar, and China). This suggests that fraudsters may concentrate their trade to neighboring countries to minimize the shipping costs. This seems particularly relevant for professional fraudsters whose sole aim is to benefit from duty drawback and whose transactions do not necessarily serve an actual client.
Fourth, fraud appears to decrease after 2013. While many factors could cause this change over time, it coincides with the implementation of the online RMS by customs in that year, which anecdotal evidence indicates significantly improved enforcement. In the model, this could be interpreted as an increase of the probability of detection – cf. Prediction 4. We are unable to identify the mechanisms through which the new RMS system impacts fraud. On the one hand, it could be that the new system improves the detection capability of customs officers. On the other hand, it may limit officers’ ability to accept bribes by firms in exchange for lenient customs checks enabling fraud – on the link between customs fraud and bribery, see Dutt and Traca (Reference Dutt and Traca2010) and Sequeira (Reference Sequeira2016).
Last, fraud appears to be significantly less in the case of differentiated goods – goods for which a reference price is not available, which can serve as a guide for customs when assessing whether products in a transaction are over- or under-reported. This is in contrast to the finding that importers tend to misreport the unit value of differentiated goods to evade tariffs (Javorcik and Narciso, Reference Javorcik and Narciso2008). In light of the model, differentiated goods may be easier to misreport, but may also attract more attention at customs. The ultimate effect on the probability of detection is thus ambiguous, and our results suggest differentiated products may be subject to stricter enforcement, which lowers fraud.
While this is not direct irrefutable evidence, we interpret these results taken together – through the lens of the model – as suggestive that enforcement does curb fraud.
6.2 Bunching
We present evidence of bunching of unit values reported by India at the cap-implied prices relative to the distribution of unit values reported by importers, which indicates fraud. Descriptive statistics of the reported unit values and cap-implied prices are presented in Table A.1.
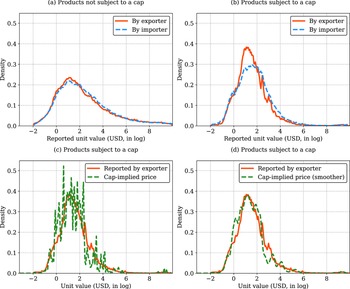
In Figure 2, we compare the distributions of unit values reported by importers and exporters with each other, in two samples: observations that are not subject to a cap, and observations that are. Panel (a) plots the distributions when no cap limits the amount of drawback claimable per unit. Unit values have very similar distributions, irrespective of which side reports. Although we would expect systematic differences stemming from evasion in theory (cf. Panel (a) of Figure 1), these may be masked by measurement errors, as explained in Section 4.1. In Panel (b), we show the same distributions when caps apply. The distribution of unit values reported by India exhibits a thinner right tail and excess mass at the mode of the distribution. This suggests that, beyond a certain point up to which the distributions coincide, exporters in India report lower unit values (relative to importers). The first piece of evidence suggesting that caps might be driving this difference is provided in Panel (d), in which we compare the same distribution of unit values reported by India (solid red line) to the distribution of cap-implied prices. The two distributions closely match each other, suggesting that exporters report unit values close to the cap-implied prices.Footnote 21
Distributions of reported unit values
Notes: Kernel density estimates (Gaussian kernel, bandwidth = 0.25 in Panels (a)–(c), and =1 in Panel (d)) of the distributions of the log of reported unit values by India (solid red) and importers (dashed blue) for (a) products subject to a positive drawback rate without cap; (b) products subject to positive drawback rate with cap. Panel (c) and (d) plots reported unit values by India (the same red line as in Panel (b)) against the cap-implied price. In Panel (d), the distribution of cap-implied prices is smoothed further (bandwidth = 1) for easier comparison. Top and bottom percentiles in terms of reported unit values are removed from sample.

Second, we focus on observations subject to caps and compare deviations of reported unit values from cap-implied prices. Caps do not impact importers, and their reporting should therefore not be influenced by cap-implied prices. If exporters fraud, we expect to see bunching at the cap-implied prices. Panel (a) of Figure 3 shows that unit values reported by Importers and Exporters are both centered around the cap-implied price, which is not surprising if caps are set by authorities such that goods priced reasonably get a full duty drawback refund. The excess mass of unit values reported by exporters at 0 indicates that exporters tend to report closer to the cap-implied price than importers do, suggesting bunching. Panel (b) depicts distributions of the ratios of reported unit values to cap-implied prices. There is excess bunching just below the cap-implied price in the distribution of unit values reported by India, relative to the distribution of unit values reported by importers. We interpret this as direct evidence of fraud. This result is robust to residualizing unit values on importer–year and importer–product fixed effects (cf. Figure B.3) and to explicitly adjusting import values for CIF-FOB margins such that both reported imports and exports are expressed FOB (cf Figure B.4). This mitigates concerns that measurement errors contaminate our results.
Deviations of reported unit values from cap-implied prices
Notes: Kernel density estimates (Gaussian kernel, bandwidth = 0.25) of the distributions of deviations of reported unit values from cap-implied prices by India (solid red) and importers (dashed blue) in absolute value (a); and as ratio of cap-implied price (b). The vertical black line indicates a value of 1, in which case the reported unit value equals the cap-implied price. Top and bottom percentiles in terms of reported unit values are removed from sample.

Third, bunching is more pronounced for observations with higher drawback rates, as depicted in Figure B.5. This is consistent with fraud per unit being higher when the drawback rate is high, supporting our baseline result in Table 2. Linking back to theory, m ipt is larger for higher rates of drawback, which increases the area that ends up bunched at the cap-implied price in Panel (b) of Figure 1. Bunching is also more pronounced for observations of high-value goods, as shown in Figure B.6, suggesting more fraud (in absolute terms) among goods of high value. This makes intuitive sense since a given deviation from a higher-priced good may look less suspicious than the same deviation from a lower-priced good.
Fourth, we focus on time variation in a subset of products for which caps were either introduced (46 instances), or abolished (506 instances). This alleviates the worry that product-specific time-invariant differences across products drive bunching. Performing this exercise is challenging, because cap-implied prices are not defined when there are no caps (i.e., before they are introduced, or after they are abolished). It is thus unclear what one should compare reported unit values to, when caps are not in force. We choose to compare them to cap-implied prices immediately prior to their drop, or after their introduction. We focus on the 4 years before and after cap status changes, and normalize reported unit values of each observation (irrespective of whether caps are in force then) by the corresponding product-specific average cap-implied price over the periods when caps are in force.Footnote 22 We find that bunching arises after caps are introduced (cf. Figure B.7), and disappears after caps are abolished (cf. Figure B.8), although it only progressively disappears post abolishing. We conjecture that traders do not start to fraud immediately, perhaps because modifying existing fraud strategies based on other products is costly.
Last, we show that fraud, as measured via correlations between reporting gaps and drawback rates, remains unchanged in the presence of caps, as shown in column (1) of Table 4, which reports the coefficients on the interaction of the drawback rate and a dummy indicating that a product is subject to a cap. However, it appears that the presence of caps changes the strategy used by traders to fraud, with a shift away from over-reporting unit values towards over-reporting quantities – as suggested by the coefficients on the interactions between the capped dummy and the drawback rate in columns (2) and (3). This is expected since over-reporting beyond the cap is not profitable, and caps appear to be set by authorities such that only reasonably priced goods are entitled to a full refund – which leaves little room to over-report unit values.
Correlation between reporting gaps and drawback rates – Caps versus no caps

Notes: *p < 0.1; **p < 0.05; ***p < 0.01. p-values shown below estimates. Standard errors are clustered at the year level. The dependent variable is the gap between reported exports by the exporter and reported imports by the importer, expressed in terms of value, quantity, or unit value (value/quantity), and calculated according to expression (6). Capped is a dummy that equals one when duty drawback is subject to a cap for product p at time t.
6.2.1 Discussion
As shown in Panel (b) of Figure 1, bunching is the result of a movement of mass within the distribution of reported unit prices. Bunching at the cap-implied prices should therefore be associated with a dip in the distribution immediately above the cap-implied prices. We do not observe this in the data. Rather, it seems that the whole right tail of the distribution becomes slightly thinner. If evasion per unit m ipt varies greatly across products, it may explain why the dip is spread across a wider region to the right of the cap-implied prices, but it cannot explain why the right tail is thinner at very high values of the unit value to cap-implied price ratio. Another possible explanation is that the kernel density estimates are too smooth, which hides important details of the distribution. To check if that is the case, we re-estimate the distributions in Figure 3 with a bandwidth of 0.001, which yields a density curve more akin to a histogram with narrow bins. The results in Figure B.9 suggest dips in the distribution to the right of the cap-implied price. Surprisingly, the distribution of unit values reported by India is much less smooth than that of unit values reported by importers (they are estimated with the same bandwidth).
6.3 Fraud Level
In this section, we infer the level of fraud based on the point estimates from Section 6.1. The coefficient from regressing the reporting gaps on drawback rates tells us by how many percents reported exports change (relative to reported imports) when the drawback rate changes by 1 p.p., a change that our analysis suggests is driven by fraud. By multiplying this coefficient by the level of the drawback rate, we obtain by how many percents, on average, reported exports are misreported because of fraud given the drawback rate. To obtain a dollar amount, we take the product of that percentage and the value of the trade flow. We thus calculate fraud levels in a given year t as follows:
 $${\rm FraudLeve}{\rm l}_t = \sum\limits_p {\sum\limits_i {( {{\rm TradeValu}{\rm e}_{ipt} \times {\rm DrawbackRat}{\rm e}_{\,pt} \times {\rm MarginalEffect}} ) } }.$$
This expression is kept general to accommodate different marginal effects of drawback rates based on point estimates from the previous section. Specifically, we consider baseline specification (7) (marginal effect:  $\hat{\alpha } = 0.747$ for all observations, from Table 2); the specification that allows for non-linearity (8) (marginal effect:
 $\hat{\beta } + 2 \times \hat{\gamma } \times {\rm DrawbackRate} = 1.497-2 \times 8.062 \times {\rm DrawbackRate}$, from Table 3); and the specification that takes into account product differentiation (
 $\hat{\alpha } = 2.228$ for homogeneous products, and
 $\hat{\alpha } = 2.228-1.611 = 0.617$ for differentiated products).
In Table 5, we present the average yearly fraud levels expressed in USD and in percentage of (i) exports trade value; (ii) exports trade value subject to positive drawback rates; and (iii) drawback amounts paid to firms. In the last row, we also display the ratio of detected fraud (as reported by Indian authorities) to our fraud estimate. Yearly data on aggregate exports, detected evasion and drawback paid to firms are in Table A.6. Our estimates of yearly fraud range from 838 million USD using the baseline marginal effect, to 1,328 million USD based on the specification that takes into account product differentiation. This represents between 35.2% and 57.2% of total drawback paid out to firms. In comparison, detected fraud represents 1.9% of the total drawback paid out to firms.Footnote 23 This suggests that our estimates of fraud a far larger than currently detected fraud, as the bottom row indicates – detected fraud represents between 3.8% and 6% of estimated fraud.
Average yearly fraud level estimates

Notes: Fraud levels estimated using the estimated coefficients from regression equations (7)−(9). Fraud levels are obtained by multiplying the trade value with the coefficient and the drawback rate applicable to that trade flow. Fraud is then summed across all observations within a year, and averaged over years. When expressed in % of drawback paid to firms, the calculations are based on years 2007–2016, for which data are available. Similarly, years 2007 and 2015 are missing for the detected fraud figures. Data on detected fraud and drawback paid out to firms are from various Directorate of Revenue Intelligence (DRI) reports.
6.3.1 Discussion
These calculations make heroic assumptions, and are therefore unlikely to be precise. First, the baseline applies the average marginal effect of the drawback rate to all values of the rates. While alternative specifications (non-linear, or taking into account product differentiation) partially address this concern, the wide range of resulting fraud level estimates suggests that results are sensitive to which specification is used.
Second, our calculations ignore misclassification, which we have shown to potentially exist in columns (5) and (6) of Table 2. This may affect our estimates of fraud, because ignoring misclassification when measuring fraud via over-reporting of exports results in an OVB that biases our estimate of fraud downwards, as discussed in Section 5.1 and confirmed empirically in Table 2. Furthermore, there is no straightforward way to calculate fraud amounts arising from misclassification based on our regression results. To see this, consider a rise in the drawback rate of a product, called A. Reported exports of product A increase because transactions of product A are over-reported, and potentially also because exports of product B – a product similar to A subject to a lower drawback rate – are misclassifed as exports of product A. These two sources of over-reporting however have different implications in terms of fraud levels. In the case of over-reported exports of product A, the marginal fraud is the drawback rate applicable to A. In the case of misclassification however, the marginal fraud is the difference between the rate applicable to B – which exporters who misclassify would have received absent misclassification – and the rate applicable to A. Estimating fraud levels ignoring misclassification thus likely produces biased estimates, but it is not clear whether we over- or underestimate them.
Third, all our calculations rely on trade flows for which gaps can be computed, which is a subset of all trade flows – since reports from importing and exporting countries must both be available. On average, gaps are available for 80% of trade volume. Hence, we are not implicitly assuming that fraud is equally prevalent in the 20% of trade volume not used in the estimation. As a result, our estimates may be underestimating the true levels of fraud.
Detected fraud varies significantly over time, as shown in Table A.6. While it hovers between 10 and 20 million USD per year in most years, it is as low as 3.4 million USD in 2008, and as high as 303 million USD in 2013. This suggests that detected fraud levels are heavily influenced by a few very large cases of fraud operated by professional fraudsters, like the ones reported in the news and referenced in Section 2.3. This leads to the following question: since professional fraudsters disappear before providing proof of remittance, authorities should be able to detect such fraud systematically. So, either very large cases of fraud are uncommon, or official statistics somehow fail to capture them. Although time delays in fraud reporting are likely as fraud needs to be legally established before it is counted in statistics – a lengthy process since the time fraud is committed, since a year elapses before proof of remittance is due, and other delays are to be expected before fraud can be confirmed by a court of law – detected fraud should end up accounted for eventually. Very large cases of fraud thus exist, but appear to be uncommon.
7. Conclusion
We provided evidence of widespread fraud in the duty drawback program in India, which aims at promoting exports by reimbursing selected customs duties on imported intermediate inputs used in the production of exported products. Duty drawback is calculated as a percentage of exports values. Over-reporting exports thus allows ill-intentioned firms to fraud and unduly gain duty drawback. We provide evidence of fraud in two ways. First, by empirically establishing that a higher duty drawback rate is associated with an increase in reported exports in India relative to reported imports of the same trade flow in importing countries. Second, by highlighting bunching in the distribution of reported unit values at kinks in the per-unit duty drawback schedule, which arise because of caps that limit duty drawback that firms can claim per unit exported. We find fraud to amount to 1.4%–2.3% of the total trade value subject to duty drawback, and that fraud detected by customs only represents 3.8%–6% of actual fraud. Our findings suggest that customs only detect a small fraction of fraudulent transactions.
Supplementary Materials
To view supplementary material for this article, please visit https://doi.org/10.1017/S1474745622000477.
Acknowledgement
Adrien Bussy gratefully acknowledges financial support from an NUS Startup Grant. We thank Danny Quah, Ramkishen Rajan, the Editor and two referees for comments. The views expressed in this paper are those of the author(s) and do not necessarily reflect those of the Swiss National Bank (SNB).