1. Introduction
The classic Eastern Baltic Ordovician sections have been intensively investigated for over two centuries, by Pander (Reference Pander1830), Eichwald (Reference Eichwald1840), Schmidt (Reference Schmidt1858, Reference Schmidt1881, Reference Schmidt1894, Reference Schmidt1904, Reference Schmidt1906), Lamansky (Reference Lamansky1905), Tjernvik (Reference Tjernvik1956), Rõõmusoks (Reference Rõõmusoks1970), Balashova (Reference Balashova1976) and Ivantsov (Reference Ivantsov2003), among others. During the last 40 years, in particular, the depositional environments, together with sedimentological and geochemical evidence, have been a primary focus for research in the region (Männil, Reference Männil1966; Jaanusson, Reference Jaanusson1973, Reference Jaanusson and Bruton1984; Lindström, Reference Lindström1963, Reference Lindström1971; Dronov, Reference Dronov1997; Felitsyn et al. Reference Felitsyn, Sturesson, Popov and Holmer1998; Sturesson et al. Reference Sturesson, Popov, Holmer, Bassett, Felitsyn and Belyatsky2005). Despite the wealth of biostratigraphical and taxonomic information, relatively few publications have treated the palaeoecology of these unique faunas.
This study is based on the first systematic revision of brachiopods from the eastern Baltic Kundan Stage (C. Rasmussen, unpub. cand. scient. thesis, Univ. Copenhagen, 2005) and constitutes some 6200 brachiopods, sampled bed by bed through most of the Kundan interval of Russia–Estonia. Further, the present paper is the first attempt to divide the Kundan strata into ecostratigraphically defined systems tracts reflecting third and fourth order sea-level changes. Dronov (Reference Dronov1997) and Dronov & Holmer (Reference Dronov and Holmer1999) outlined a regional sequence stratigraphical framework for Baltoscandia, based on what they regarded as third order sea-level fluctuations. This study, however, suggests that the sea-level fluctuations recognized by Dronov (Reference Dronov1997) and Dronov & Holmer (Reference Dronov and Holmer1999) at formation or stage level are mainly second order.
2. Geological setting
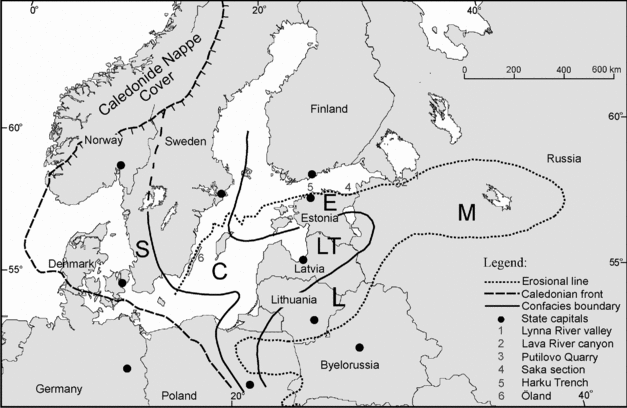
The Ordovician of Western Russia and Northern Estonia is primarily exposed along the Baltic–Ladoga Clint. This is a natural erosional escarpment extending for more than 1200 kilometres from western Russia through Estonia to the Swedish island of Öland (Fig. 1). Ordovician strata are exposed in many cliff sections along this escarpment, as well as in adjacent rivers and quarries (Meidla & Ainsaar, Reference Meidla, Ainsaar, Hints and Ainsaar2004).
Geographical position of the studied sections with the main geological features of the region indicated. Note that all localities are situated at the northern boundary of the Moscow Basin, along the so-called Baltic–Ladoga Clint. Capital letters depict confacies belts: E – North Estonian, LT – Livonian Tongue, L – Latvian, C – Central Baltoscandian and S – Scanian, except M – Moscow Syneclise. See legend for further details. Modified from Hints & Harper (Reference Hints and Harper2003).

Deposition of Ordovician limestone in Estonia and the St Petersburg area (Ingria) commenced in the middle Arenig (Dapingian) just prior to Middle Ordovician times. The limestones do not indicate particularly favourable conditions for the production of carbonates, but rather a very low supply of terrigenous material as the land areas to the north and south of the East Baltic area were in an advanced state of peneplanation and had low relief (Jaanusson, Reference Jaanusson1973). During the Kundan Stage, roughly corresponding to Darriwilian 2, Baltica occupied a position 50–40° south of the palaeoequator (Torsvik, Reference Torsvik1998). These cold-water carbonates were deposited in a sediment-starved, shallow epicontinental sea (Jaanusson, Reference Jaanusson1973).
The Ordovician sedimentary rocks of Baltoscandia have been divided into five so-called confacies belts which are separable on the basis of both fauna and lithology (Männil, Reference Männil1966; Jaanusson, Reference Jaanusson, Bruton and Williams1982, Reference Jaanusson1995). As a general rule, the further towards the southwest, the deeper the depositional palaeoenvironment (see Fig. 1). The stability of the confacies belts reflects the long-term tectonic stability of the Ordovician Baltic Palaeobasin (Dronov & Holmer, Reference Dronov and Holmer1999). Ralf Männil (MS) further proposed two additional sub-divisions, the Ilmen and the Rybinsk confacies belts, in the eastern part of the St Petersburg region, based on the completeness and lithology of the sections in that area. Unfortunately these sub-divisions remain unpublished. Thus, in the present study, though the marly section in Lynna perhaps could be assigned to the Ilmen Confacies belt, it has been retained within the North Estonian Confacies belt, together with the other examined sections. This facies belt is dominated by grey, horizontally stratified calcareous and strongly condensed sediments with common glauconite, iron ooliths and marls. For a more detailed description of the lithology of the studied sections, see Rasmussen & Harper (Reference Rasmussen and Harper2008).
3. Stratigraphy
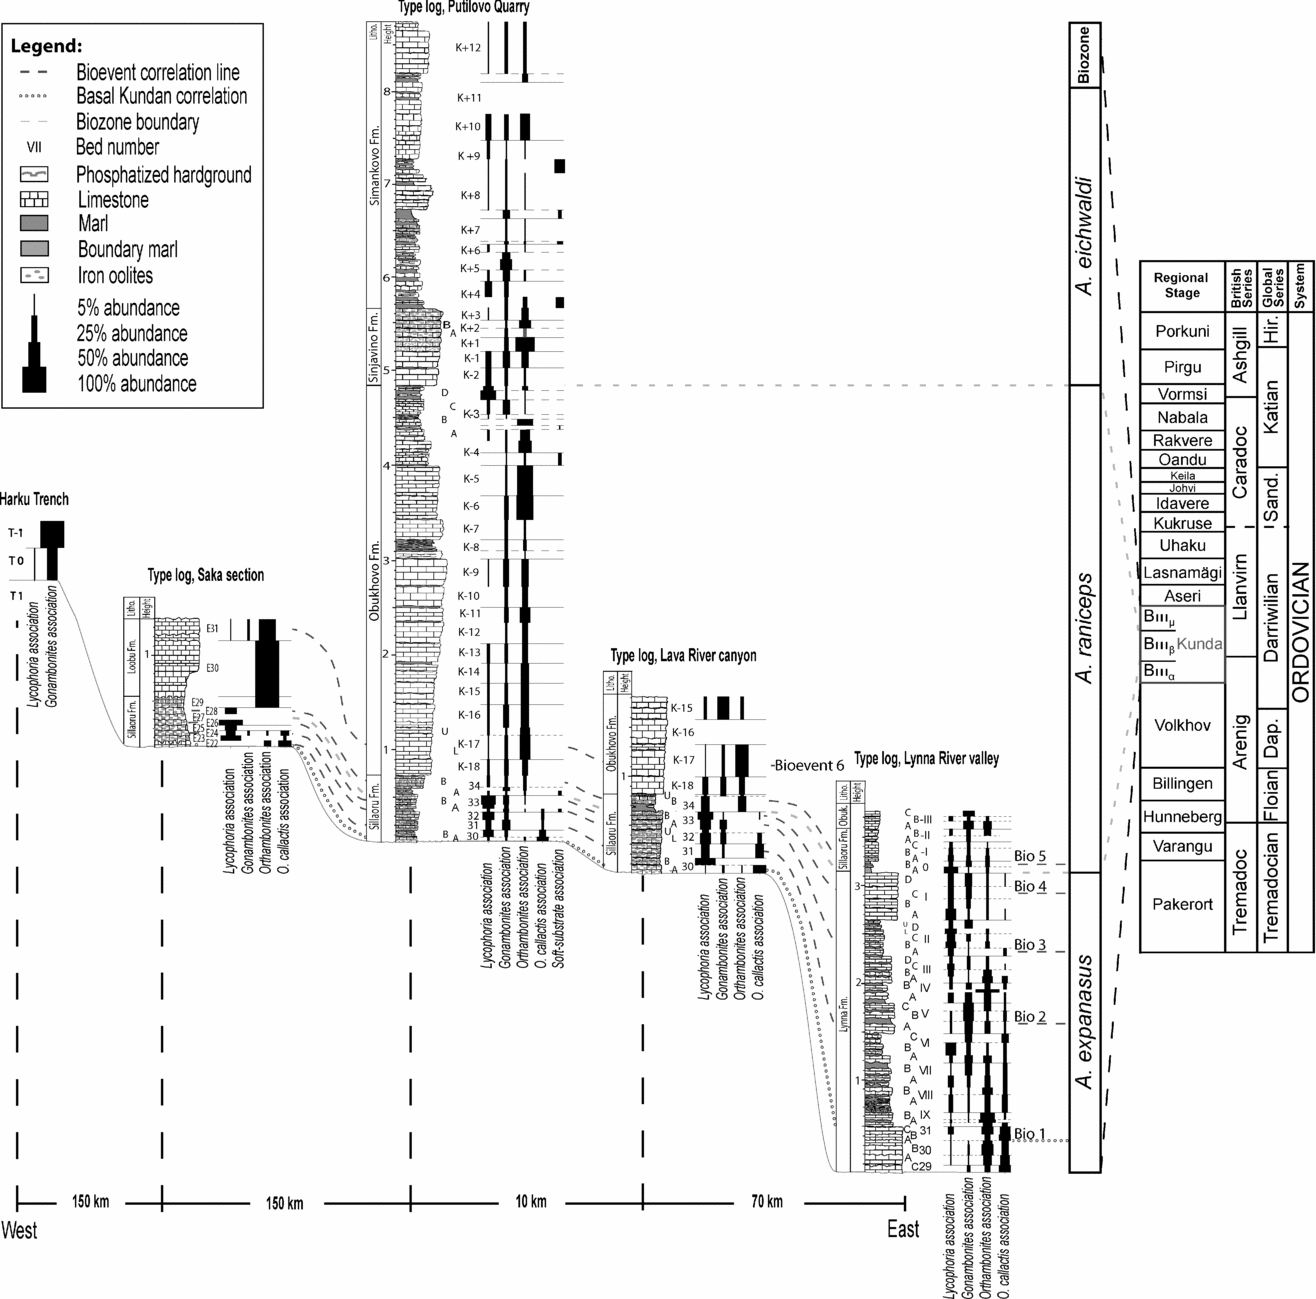
Schmidt (Reference Schmidt1881) established a stratigraphical scheme for the Ordovician of Ingria, based on trilobite range data. His BIII interval later became known as the Kundan Stage. Lamansky (Reference Lamansky1905) subdivided this interval into three biozones labelled α, β and γ (Fig. 2). These designations are still in use and most probably correspond to the Scandinavian Asaphus expansus, A. raniceps and Megistaspidella obtusicauda–M. gigas zones. A local variant, the A. eichwaldi Zone, is used for the last unit in the East Baltic area. The East Baltic biozones, however, are rather vaguely defined and have never been described in detail, therefore a new bed numbering system was established for this study, providing much higher resolution (Fig. 2). In general, local bed-by-bed correlation was possible due to the undisturbed, laterally-continuous carbonate beds that characterize the region. However, these beds are not continuous over long distances (Rasmussen & Harper, Reference Rasmussen and Harper2008), therefore the bed numbering system can vary from section to section (see Figs 2, 9, 10). Only between the sections in Putilovo Quarry and the Lava River valley, which are situated about 10 kilometres apart, can individual beds be tracked convincingly. Thus, the same bed numbers have been applied to these sections. In terms of international correlation, the Kundan Stage corresponds to the Lower Darriwilian (upper Arenig–lower Llanvirn).
Stratigraphical scheme showing the regional stages and Lamansky's (Reference Lamansky1905) trilobite zonations tied to global stratigraphy. The zonations are only shown for the Kundan stage. BIIIα, BIIIβ and BIIIμ are synonyms for the expansus, raniceps and eichwaldi trilobite zones, respectively. Next to each type log the relative ranges and abundances of the five biofacies are shown. For a colour version of this figure see online Appendix 3 at http://journals.cambridge.org/geo. Abbreviations: Hir. – Hirnantian, Sand. – Sandbian, Dap. – Dapingian, Bio 1–5 – Bioevent 1–5. The section in Saka is based on Mägi (Reference Mägi1990).

The current lithostratigraphy of the Estonian area was recently reviewed by Raukas & Teedumäe (Reference Raukas and Teedumäe1997), whom we follow here. Regarding the lithostratigraphy of the Russian sections, we follow the classification adopted by Dronov (Reference Dronov1997).
Lamansky (Reference Lamansky1905) was the first to report that the lower segment of the BIII succession (Kundan) is missing in the western part of the East Baltic area (Fig. 2). The BIIIα section is thus almost 3 metres thick in the Lynna River valley, whereas it measures only about 50 centimetres at Putilovo Quarry, located 70 kilometres westwards. In eastern Estonia, at Saka, this level is about 35 centimetres thick, whereas at Paldiski, in the northwestern corner of Estonia, all BIIIα, some of BIIIβ and most of BIIIγ are missing. However, recently ATN (unpub. data) recorded the index fossil Asaphus expansus from a thin BIIIα interval in old quarries just east of Tallinn, as well as at Saka. The reason for this westward thinning of strata is probably the uplift of the Gotland High that included western Estonia during early Kundan times.
4. Methods
4.a. Brachiopods as biofacies indicators
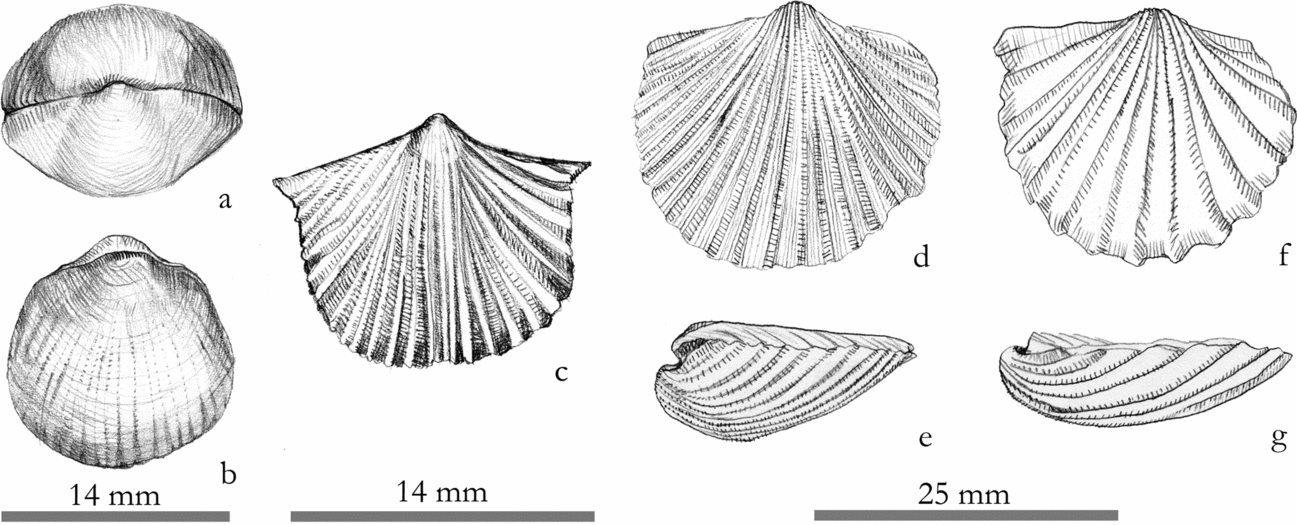
Shell morphology can be a rough guide as to whether a brachiopod species lived in shallow or deeper water (Brenchley & Harper, Reference Brenchley and Harper1998). Many species are facies restricted because of substrate dependency or adaption to specific salinity, temperature or energy levels (Bassett, Reference Bassett1984; Waisfeld et al. Reference Waisfeld, Sánchez, Benedetto and Carrera2003). Such species facilitate the recognition of biofacies, in turn indirectly reflecting the relative palaeo-water depth. An example is the Orthambonites species group (Fig. 3), which presumably used a rather large pedicle to sustain a firm grip on a hard substrate (pedunculate group), or the plectambonitoids, which used their characteristic shell morphology to ‘float’ on the sediment–water interface (recumbent group) without being buried. Hence they were better adapted to rather low-energy habitats, which normally occur in deeper-water environments.
Different adaptive life strategies for brachiopods. (a, b) Nearshore environments are dominated by taxa with thick, biconvex valves, like the genus Lycophoria. (c) If the sediment is soft and muddy, then groups like the clitambonitoids or plectambonitoids, may dominate. This drawing depicts the clitambonitoid Gonambonites. (d–g) In deeper water environments, orthids, like the genera Orthambonites (d, e) and Orthis (f, g), dominate. They were commonly characterized by a weakly biconvex profile, probably with a single, thick pedicle achieving a firm grip in the sediment.

The palaeoenvironmental significance of brachiopod biofacies can also be assessed by analysing their distribution within the basin, that is, whether they occur in nearshore or offshore settings. In order to distinguish, for example, shallow- from deep-water biofacies, a combination of the distribution of selected taxa and sedimentology was used in this study. This approach is primarily based on the occurrence of key taxa, such as Lycophoria spp., which usually are found in marly limestones, and the Orthambonites species group, which usually occur in glauconitic wackestones.
Apart from the ambient living conditions, biofacies associations may also be affected by the post-mortem redistribution of shells by currents or mass gravity transport, as well as by diagenesis.
4.b. Definition of biofacies
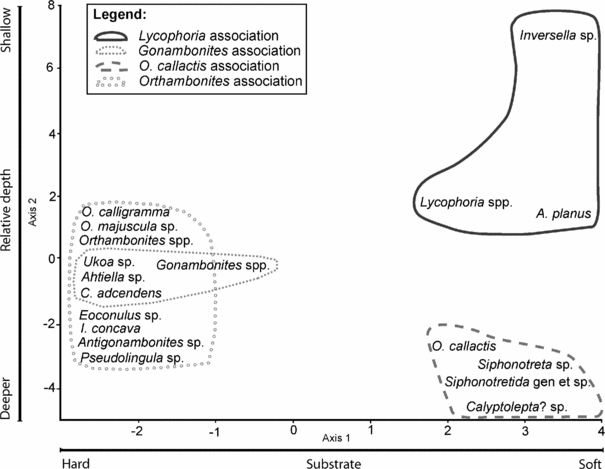
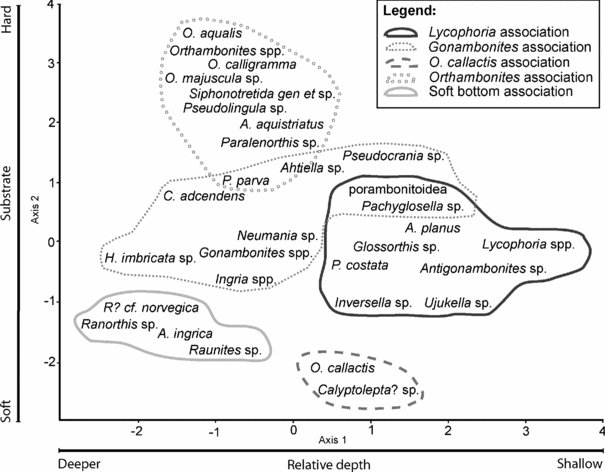
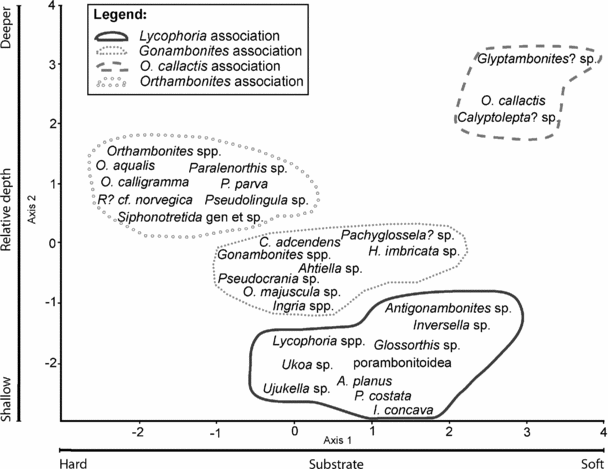
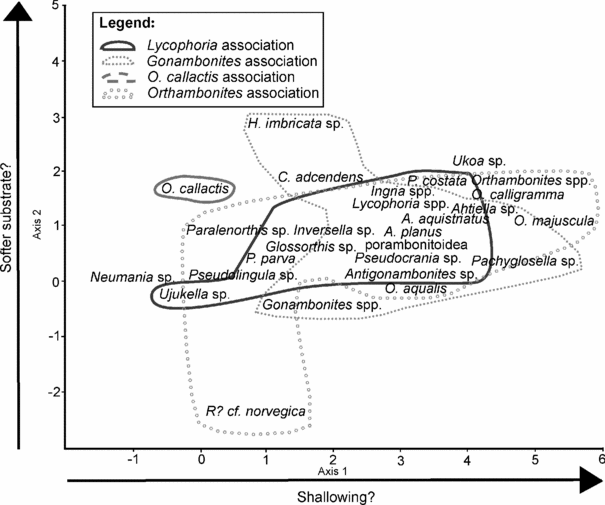
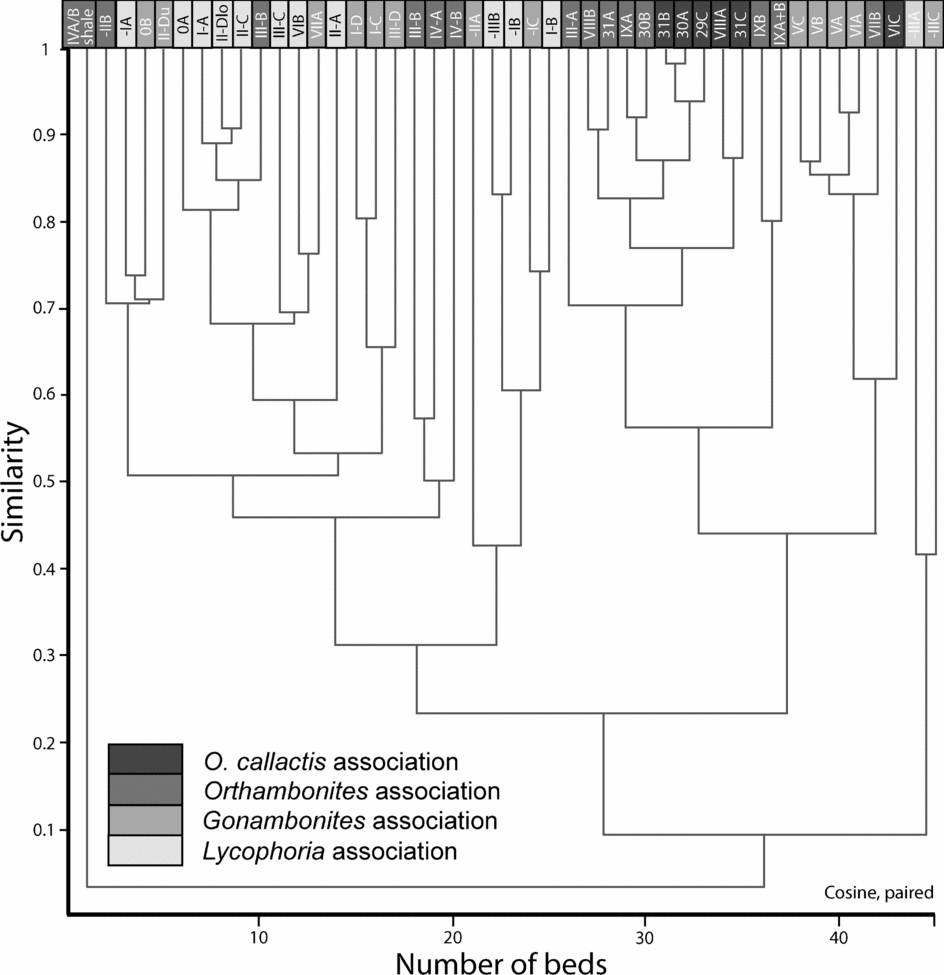
The palaeoecological dataset was examined using detrended correspondence analysis (see Hammer, Harper & Ryan, Reference Hammer, Harper and Ryan2001; Hammer & Harper, Reference Hammer and Harper2005), which visualizes trends or groupings by projecting the multidimensional dataset into a series of two-dimensional plots. In palaeoecology, this analysis is used for the ordination of both samples and taxa in the same plot (Hammer, Harper & Ryan, Reference Hammer, Harper and Ryan2001). Detrended correspondence analysis has been executed for each of the eastern Baltic sections, except for that at Harku Trench, which was too sparsely sampled (Figs 4–6). The statistical analysis has suggested the definition of a set of well-defined brachiopod biofacies. Clusters of taxa are defined as a biofacies association if they cluster coherently in more than one of the sections. The first and second axes in the plots are interpreted as being either substrate or depth related, respectively. In the Lynna River valley section there was no obvious separation of the biofacies using this method (Fig. 7). Therefore a cluster analysis was instead implemented (Fig. 8). The interpretation of biofacies based on the individual sections is described in the online Appendix 1 at http://journals.cambridge.org/geo.
Detrended correspondence analysis of brachiopods sampled from the Saka section, northeast Estonia. The deeper-water Orthambonites association and the transitional zone Gonambonites association plot in the left side of the diagram. This may indicate reworking of the Gonambonites association. The shallow-water Lycophoria association plots in the top right corner, whereas the deeper-water, soft-substrate O. callactis association plots in the bottom right corner.

Detrended correspondence analysis of brachiopods sampled in the Putilovo Quarry. The biofacies associations may be separated when compared with the sections in Saka and Lava. At this locality marl beds were also sampled. The fauna from these beds, the Soft-substrate association, is different from the faunas recovered from the limestone beds because it consists of taxa that do not occur in the other biofacies.

Detrended correspondence analysis of brachiopods sampled in the Lava River canyon. Four different biofacies are distinguished.

Detrended correspondence analysis for the section in Lynna River valley. Note that all biofacies seem to cluster together. Thus, neither substrate nor water depth can be distinguished as the main controlling factor. This may indicate that the more shallow-water associations are allochthonous.

Cluster analysis showing a plot of the beds in the Lynna River valley section. Note that, apart from a few exceptions, the shallow water faunas and deeper water faunas plot coherently, indicating a relationship between these beds and the brachiopod faunas they contain. Exceptions are beds VIIA, III-B, −IA and −IC. In all four beds the different associations were almost equally represented. Thus, the beds have been shaded according to the most dominant biofacies. For a colour version of this figure see online Appendix 3 at http://journals.cambridge.org/geo.

More than one biofacies association may in theory be mixed in any one bed, due to rapidly fluctuating environmental conditions and/or post-mortem transport. Therefore, in this study, the most dominant brachiopod association in a specific bed defines the biofacies of this bed. In a few beds, however, the relative percentages of either the shallowest or deepest associations are equally represented. In these cases an intermediate biofacies association is used in the ecostratigraphical analysis.
5. Biofacies associations
Two deep-water biofacies can be identified, characterizing hard and soft substrates, respectively. The former is, in general terms, characterized by A. aequistriatus, the Orthambonites species group, Paralenorthis sp., P. parva, R.? cf. norvegica and the nonarticulates Pseudolingula sp. and Siphonotretida fam., gen. et sp. indet.? The soft-substrate sub-biofacies is characterized by Calyptolepta? sp. and O. callactis. Marl beds and deeper-water grainstones in the Putilovo Quarry are characterized by Ranorthis? sp. and Raunites sp.
The most shallow-water biofacies is dominated by A. planus, Lycophoria spp., Porambonitoidea and Glossorthis spp.; Inversella sp., P. costata and Ujukella sp. also occur predominantly in these environments. In between this shallow-water biofacies and the two deeper-water biofacies there is possibly a transitional biofacies. It is difficult to characterize because some of the taxa do not occur in the same biofacies in all four sections. These taxa include Ahtiella sp., C. adcendens, Gonambonites spp., H. imbricata, Ingria spp., Pachyglossella? sp. and Pseudocrania sp.
For ease of identification, the assemblages are named after their most dominant taxa. Thus, the deeper-water, hard substrate assemblage is named the Orthambonites association, the deeper-water, soft-substrate assemblage is named the O. callactis association, the transitional biofacies assemblage is named the Gonambonites association and the shallow-water association is named the Lycophoria association. Ranorthis? sp. and Raunites sp. form a separate soft-substrate association which has been found only in the marl beds of Putilovo Quarry. The fact that the Lycophoria association is thought to have been deposited in the most shallow-water environments fits well with this biofacies being the most dominant in the shallow-water A. expansus Zone in the westernmost sections. In the same way, the Orthambonites association primarily occurs in glauconitic wackestones which further supports a deeper-water biofacies.
6. Bed-by-bed correlation of biofacies along the transect
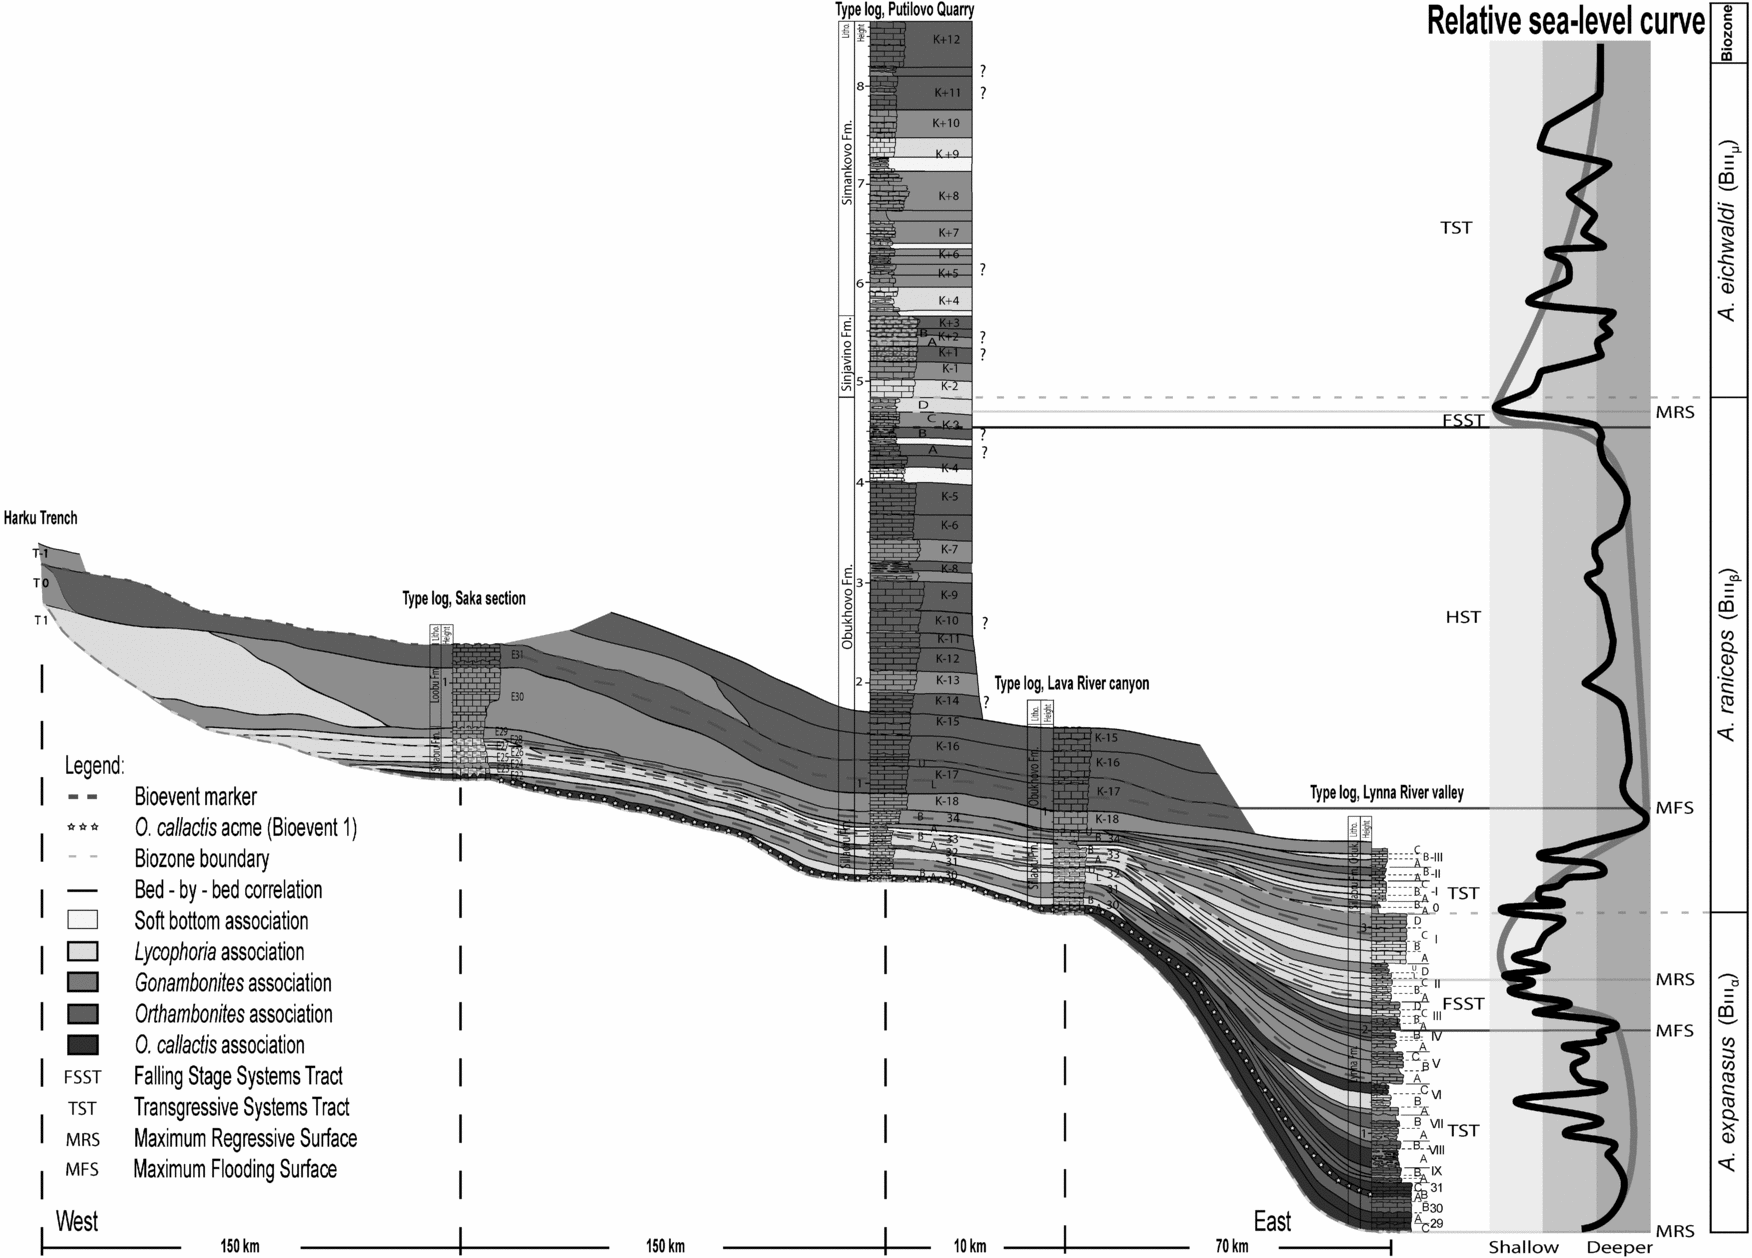
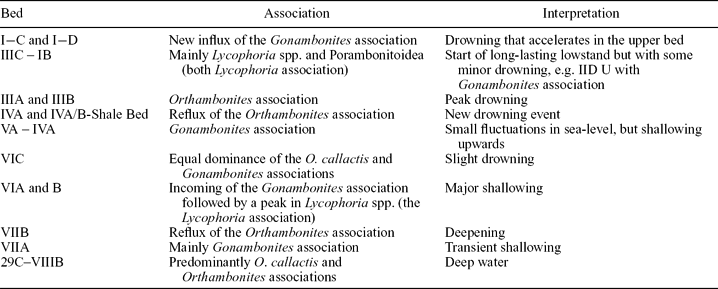
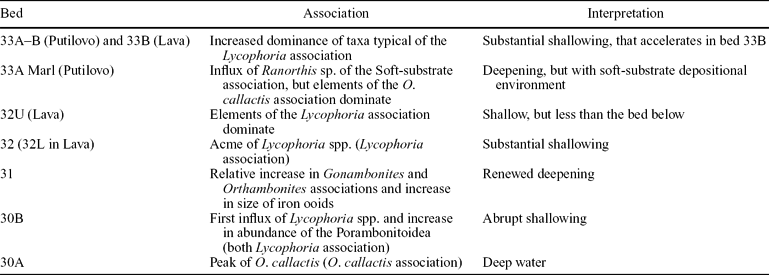
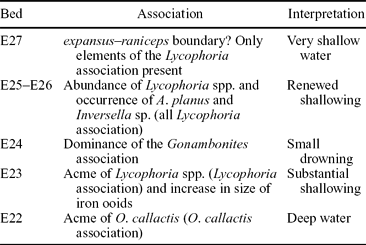
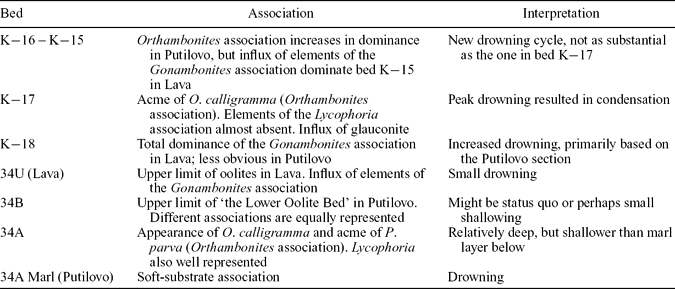
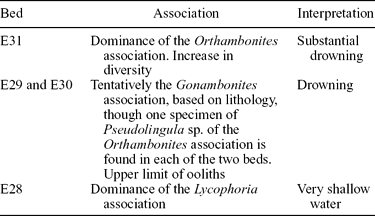
A detailed correlation of the examined eastern Baltic sections has been proposed, based on bioevents correlated along the investigated transect in combination with the range-charts constructed for each section (Rasmussen & Harper, Reference Rasmussen and Harper2008; C. Rasmussen, unpub. cand. scient. thesis, Univ. Copenhagen, 2005). The following interpretation is based on the occurrence of the above-defined biofacies associations. Relative abundances of these associations within each bed are shown in Figure 2; see Figure 9 for clarification and illustration of the following text. As detailed discussion of the correlation of biofacies between the sections is beyond the scope of this paper, readers with a special interest in the detailed bed-to-bed shifts in biofacies throughout the sections are encouraged to request a pdf file of C. Rasmussen, unpub. cand. scient. thesis, Univ. Copenhagen (2005) from the first author. The main points are tabulated in Tables 1–6.
Correlation of biofacies and their interpreted ecostratigraphical depositional regime along the investigated transect. The grey shadings on this figure are based on the dominant biofacies in each bed. See legend for explanation of shades. Two reconstructed sea-level curves are drawn on the far right: a black curve representing fourth order changes in sea-level and an averaged light-grey curve representing third order changes in sea-level. Note that the ecostratigraphical boundaries are placed at the base of the relevant beds, whereas the sea-level curves are drawn from the middle of the bed. Thus, in some beds there are deviations between the positions of the two. For a colour version of this figure see online Appendix 3 at http://journals.cambridge.org/geo. The section in Saka is based on Mägi (Reference Mägi1990).

The expansus assemblage zone at Lynna River valley

The expansus assemblage zone in Putilovo Quarry and Lava River canyon

The expansus assemblage zone at the Saka section

The raniceps assemblage zone at Lynna River valley

The raniceps assemblage zone in Putilovo Quarry and Lava River valley

The raniceps assemblage zone at the Saka Section

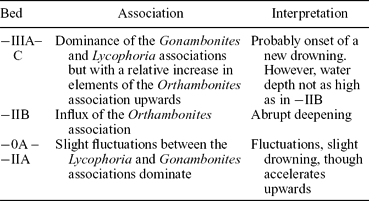
Table 1 illustrates the shifts in biofacies, together with our interpretations of environments within the A. expansus Biozone at the Lynna River valley. This is the most complete section within the studied area (Rasmussen & Harper, Reference Rasmussen and Harper2008). Overall, the deep-water biofacies associations dominate, though with an increasingly greater dominance of the shallow-water Lycophoria association towards the top of the expansus Biozone.
Westwards from the Lynna section, several events can be followed all the way to the westernmost section at Saka (the Harku trench section is too condensed to identify shifts in biofacies at a bed-to-bed scale). The Putilovo and Lava sections, being located only 10 km apart, largely overlap. The different shifts in biofacies in the expansus Biozone at these localities are shown in Table 2. When compared to the Lynna section, one can immediately identify the deep-water associations in the lowermost part of the section. The more condensed sections in Putilovo Quarry and the Lava River valley show rapid changes upwards into shallow-water faunas as compared to a gradual transition in the more expanded section in Lynna. This shallowing-upward cycle is repeated, with the difference that in Lynna a new drowning, not developed to the west, is observed in the uppermost bed of the expansus Biozone.
Further west, at Saka, the deep-water O. callactis association is still seen in the lowermost bed (Table 3). The remaining part of the section is now so condensed that only shifts between the Lycophoria and Gonambonites associations are seen. This indicates very shallow water.
Only the basal part of the A. raniceps Biozone was sampled at the Lynna River valley (Table 4).
It starts with the Lycophoria association. Hereafter, transient fluctuations between the Lycophoria and Gonambonites associations dominate in the lower part. This is succeeded by drowning events that can be traced westwards (Tables 5, 6).
Above the sampled interval in Lynna, the sections in Lava and Putilovo reveal a large, sustained drowning that peaks in bed K−17 with the acme of O. calligramma within the Orthambonites association. This was distinguished as Bioevent 6, based on the peak in the α-diversity curve presented in Rasmussen & Harper (Reference Rasmussen and Harper2008) in combination with the first dominance of the Orthambonites association at Saka, Putilovo and Lava. This peak in α-diversity also marks the most diverse brachiopod fauna in the whole Billingen–Kunda interval of the East Baltic (Rasmussen, Hansen & Harper, Reference Rasmussen, Hansen and Harper2007). This bed is in the lowermost part of the Obukhovo Formation and consists of relatively thick-bedded glauconitic wackestones, marking a shift in lithology from the marly Sillaoru Formation below.
In the most westerly section, the Harku Trench (Figs 2, 9), the Kundan Stage is only represented by two beds. In this section a substantial decrease in diversification among brachiopod taxa is seen across the Volkhov–Kunda boundary (bed T1–T0). Note that the A. expansus Biozone is not present at Harku and T0 therefore represents the lower part of the A. raniceps Biozone.
Above the boundary, a level with taxa that belong to both the shallow-water Lycophoria association and the transitional zone Gonambonites association occurs (Fig. 2). This horizon is succeeded by bed T−1, in which only C. adcendens and Ahtiella sp. are represented. Both are typical of the intermediate biofacies Gonambonites association. Although based on a very small number of specimens, these data indicate quite shallow-water environments in T0, possibly succeeded by a drowning in bed T−1. The lower part of bed T−1 is developed as a conglomerate, possibly a drowning surface.
To summarize, the biofacies analysis of the Sillaoru and Lynna formations reveals that the expansus Biozone starts with an initial drowning event that can be observed as far west as northeastern Estonia. Thereafter, the three westerly sections (excepting Harku) primarily show progressively more shallow-water biofacies. However, the more complete section in Lynna reveals some transgressional events and notably, that the uppermost bed of the expansus Biozone actually is a renewed drowning.
In a regional context, the A. raniceps Biozone was initiated by a drowning event that was succeeded in the lowermost beds of the Obukhovo/Loobu Formation by what here is regarded as the largest drowning within the entire studied interval.
7. Ecostratigraphy in a starved cool-water carbonate ramp margin setting
By using the fossil data in a sequence stratigraphical framework, it is possible to define sea-level related sedimentary packages or systems tracts and use these to construct a relative sea-level curve.
Cool-water carbonate systems, the system relevant here, usually behave more similarly to siliciclastic systems than warm-water carbonate systems (Bosence & Wilson, Reference Bosence, Wilson and Coe2003). However, due to the extremely low sedimentary supply in the Baltoscandian Palaeobasin, no lowstand or highstand systems, both characterized by progradation, can be identified. Hence, at no stage was accommodation space exhausted. It appears that the sedimentary succession mainly records intervals of rising sea-level, highstands and the initial part of falling stages, whereas most of the falling stage and lowstand intervals were associated with non-deposition or even erosion, even when the study area still was inundated during the lowest sea-levels. Usually the clastic influx was highest during relatively low sea-level, whereas the cleanest carbonates, often glauconitic, formed during rising sea-level and highstands. Because of the marked sediment starvation in the basin lacking progradation, it is more appropriate in cool-water carbonate systems to recognize transgressive/regressive sequences with only two system tracts (transgressive and regressive; cf. Embry, Reference Embry1993, Reference Embry2002).
The basin was characterized by a very slow sedimentation rate of cool-water carbonates interspersed by some clastics in relative nearshore areas. The bottom topography was extremely flat, and due to the intracratonic setting, there was virtually no active subsidence or tectonic disturbances. Hence, eustatic sea-level changes are likely to have been, if not the only, then the most important factor controlling accommodation space along the investigated transect. This suggests that the orders of cyclicity revealed by the palaeoecological data mainly represent third order sea-level changes. In the relatively shallow-water deposits, like the A. expansus Biozone at Lynna and the Sinjavino and Simankovo formations in Putilovo, fourth order cycles also seem to be recorded, indicating that the fauna is very sensitive to even small changes in depth or Milankovitch-induced changes in energy levels. Clearly, small fluctuations in sea-level are likely to have a larger affect in shallow-water environments than in deeper-water settings. These fourth order fluctuations disturb the general pattern in the sea-level curve, and will therefore only be discussed where relevant. For ease of reading, two sea-level curves are drawn in Figure 9. A grey curve (red curve in online colour version, Appenix 3, http://journals.cambridge.org/geo) represents the third order cycles and a black the fourth order excursions.
8. Ecostratigraphical interpretation of the biofacies correlations
8.a. The A. expansus–lower A. raniceps interval
The lowermost ecostratigraphically defined sequence starts at the Volkhov–Kunda boundary, which is interpreted as a sequence boundary (Maximum Regressive Surface, MRS). Hereafter follow drowning events that are interrupted by a few transient shallowings preserved only in the most basinward setting. This drowning peaked with the Maximum Flooding Surface (MFS) in bed IIIA in Lynna.
In the westerly sections, large concentrations of Lycophoria spp. occur in strata containing iron ooliths. These horizons likely formed as a result of condensation during transgressions (Sturesson, Heikoop & Risk, Reference Sturesson, Heikoop and Risk2000). Therefore the Lycophoria association, and in particular the influxes of Lycophoria itself in some beds where it dominates, is considered to indicate the initial transgressions in the A. expansus Biozone but where shallow-water conditions still prevailed. The uppermost part of the A. expansus Biozone in the Lynna section contains rather dense, thick-bedded wackestones. This again indicates a drowning event. However, Nielsen (Reference Nielsen1995) demonstrated a large sea-level drop in the uppermost part of the A. expansus Biozone in Scandinavia (representing a much deeper palaeoenvironment). This shallowing is not recorded by the fauna in the eastern Baltic sections, but is probably represented by an unconformity indirectly indicated by the transgressive surface at the expansus–raniceps boundary. The entire A. expansus Biozone thus represents one transgressive–regressive cycle of third order and a new transgression. This interpretation is contrary to previous studies (e.g. Dronov, Reference Dronov1997; Dronov & Holmer, Reference Dronov and Holmer1999) that considered that the A. expansus Biozone is a Lowstand Systems Tract (LST).
Above the transgressive surface at the expansus–raniceps boundary the sea-level rose, at first relatively slowly, as evident in the Lynna section, then, rather dramatically, as indicated by the arrival of the Gonambonites and Orthambonites associations. Thus the raniceps beds of the Sillaoru Formation and the lowermost beds of the Obukhvo Formation are interpreted as a Transgressive Systems Tract (TST), with bed K−17U representing the MFS. This bed contains the largest number of brachiopod specimens at Putilovo. Further evidence for condensation at this level is the formation of glauconite, especially in beds K−18 and K−17. This MFS probably represents the deepest palaeoenvironment in the examined sections. This drowning is correlated with the Harku Trench and Öland (C. Rasmussen, unpub. cand. scient. thesis, Univ. Copenhagen, 2005) and can be traced throughout Scandinavia (Nielsen, Reference Nielsen1995 and references therein). Brachiopod diversity is at a maximum for the entire Billingen through Kunda interval in the East Baltic (Rasmussen, Hansen & Harper, Reference Rasmussen, Hansen and Harper2007).
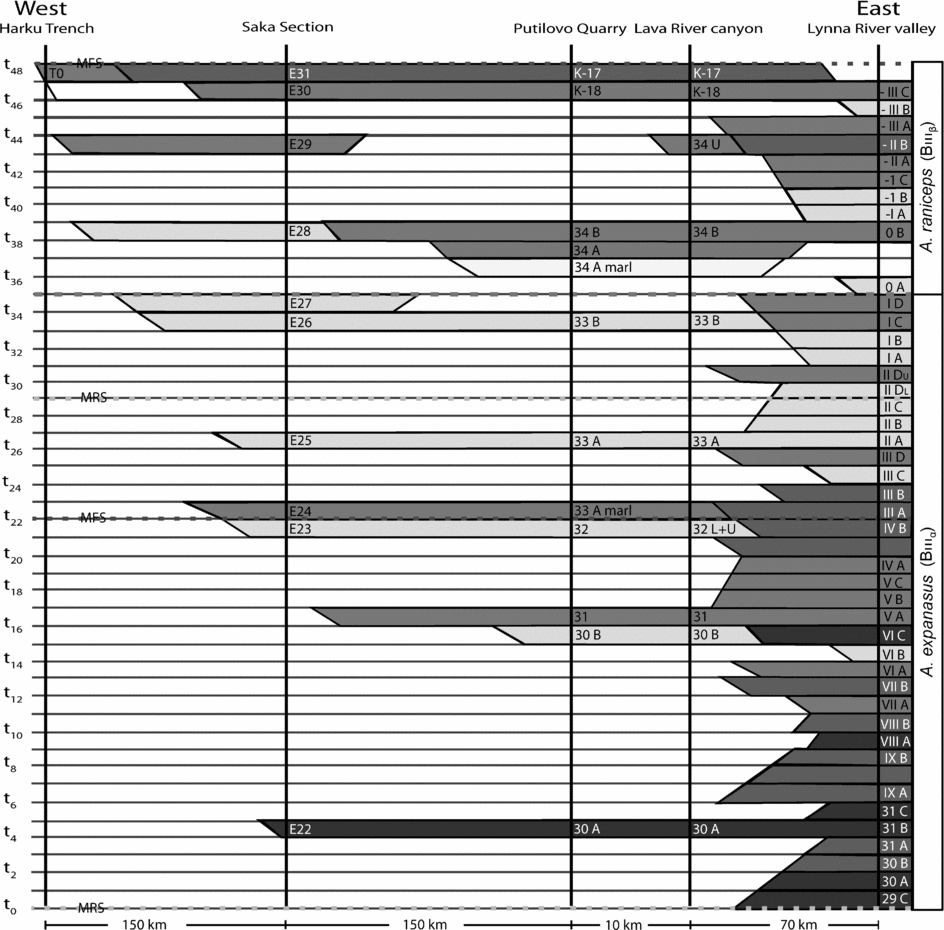
To summarize, as seen in Figure 9, the most shallow-water biofacies dominate towards the west, whereas the deeper-water associations dominate in the east (where the sections are more complete). To give a more detailed illustration of the chronostratigraphical implications of this ecostratigraphical examination of the expansus–lower raniceps interval, the Wheeler diagram (Fig. 10) gives an impression of how much section is probably missing along the profile from east to west.
Wheeler diagram illustrating hiatuses in the western sections compared with the one in the Lynna River valley. The biofacies and interpreted-ecostratigraphical surfaces are also shown to indicate a relative indication of the palaeo-water depth during the deposition of any given bed. Grey shadings are as in Figure 9. For a colour version of this figure see online Appendix 3 at http://journals.cambridge.org/geo.

8.b. Biofacies and their ecostratigraphical implications in the upper part of the Putilovo section
The sea-level rise continued during deposition of the overlying interval, which is sampled only in Putilovo Quarry. Here the biofacies indicate high sea-levels until bed K−3B, although not as high as that during deposition of bed K−17L. Although this signal is third order, we label this interval as a HST, although, strictly speaking, it is possibly a Falling Stage Systems Tract (FSST) deposited after a maximum flooding event. This designation emphasizes that the interval experienced the highest sea-level in the entire Kundan. This third order highstand interval ends abruptly with an MRS in K−3D.
With regard to the fourth order curve, the marl bed within bed K−8 does show some indications of change in faunal composition, with representatives of the Orthambonites association becoming dominant between two limestone beds that are dominated by elements of the Gonambonites association. Bed K−8 and K−8 Marl were therefore deposited during a higher order lowstand. This event may be correlated with strata in the Harku Trench section in western Estonia, where the conglomerate in the lower part of bed T−1 may record this sea-level fall. Possibly the sudden appearance of a high marl content may have been prompted by Milankovitch-driven storms, which increased siliciclastic input.
The shallowing in the Putilovo section is succeeded by a renewed deepening that peaked during deposition of beds K−6 and especially K−5, which are both characterized by a new influx of the Orthambonites association. During deposition of bed K−5 the sea-level is the second highest in the examined interval in the East Baltic. Here O. calligramma first returned since bed K−16 and thereby confirms that sea-level was high, as indicated by the third order curve. The high sea-level continued until deposition of bed K−3C.
A sea-level fall was initiated during deposition of bed K−3C, signalled by the incoming of the Gonambonites association with fairly common Lycophoria spp. This shallowing event peaked during deposition of the succeeding bed K−3D Marl with greatly fragmented Lycophoria spp. accounting for more than half of the specimens in this bed (> 300 specimens of this genus are present). The faunal change records an extensive sea-level fall, probably the largest within the studied Kundan sections, and an MRS is therefore interpreted below the marl horizon in bed K−3D. Hereafter followed a small deepening, as shown by the incoming of limestone in the uppermost beds of the Obukhovo Formation and of O. cf. aqualis and R.? cf. norvegica (Orthambonites association) and the fact that the robust Lycophoria shells are no longer fragmented.
The overlying Sinjavino Formation (‘Upper Oolite Bed’) overall signals a sea-level rise, but fossils are rather rare. The unit starts with a domination by the Lycophoria association, then follows a substantial drowning, indicated by the relative increase in dominance of elements typical of the Gonambonites and Orthambonites associations upwards. This faunal shift is associated with a change in lithology from marl to massive limestone (Fig. 9) and an influx of iron ooliths that increase in size in the upper part of the formation.
The overlying Simankovo Formation primarily consists of marls interbedded with limestone horizons (see Figure 9); the thin limestone beds indicate minor drownings and that these shifts in lithology primarily represent fourth, or maybe even fifth, order changes in sea-level. As discussed in the next section, climatic changes caused by Milankovitch cycles could also explain these shifts in lithology. The substrate became the main factor controlling the composition of the faunas. This is reflected in the marl beds being much more fossiliferous than the limestone beds in this part of the section. Further, they are dominated by the Soft-substrate association, which has been found only in the marl beds of Putilovo Quarry.
At the base of the Simankovo Formation the marly part of the bed is characterized by the sole presence of Ranorthis? sp., which is part of the Soft-substrate association. This is taken as evidence of a minor drowning, whereas the succeeding, more limy parts of bed K+4 are dominated by the Lycophoria association represented by Glossorthis spp. and a peak in Lycophoria spp. Consequently, this part of the bed is interpreted as a shallowing event. Beds K+5 to K+8 are dominated by taxa assigned to the Gonambonites association. Hence, overall this interval is interpreted as a drowning. This is also supported lithologically by the third influx of iron ooliths in the section in bed K+7, indicating renewed transgression. These iron ooids are very minute and present only in the carbonate beds of this level.
The limestone beds succeeding K+9 may be interpreted in two very different ways. Either they are interpreted as an abrupt shallowing event, probably only second to the one in bed K+4 in this formation, based on the occurrence of Glossorthis spp. and a new influx of Lycophoria spp., or this could be explained by transportation from a more shorewards position, because deeper-water genera like Ahtiella, Paurorthis, Pseudolingula and Ranorthis are also found in this bed. The latter is probably the case. The marly part of the bed is totally dominated by Ranorthis? sp., suggesting a deeper-water environment.
The fauna of the remaining upper part of the section is indicative of a deepening based on the incoming of a more diverse fauna that consist of elements of the deeper-water biofacies. Therefore it is interpreted as a TST that either succeeds a fourth order FSST in bed K+9 or a continuation of the TST in bed K+7.
To summarize, the Sinjavino and Simankovo formations are interpreted as a third order transgressional event.
9. Discussion on the changing sea-level and possible physical controls
Dronov (Reference Dronov1997) recognized seven depositional sequences in the Ordovician of Ingria. Of these, the fourth coincides with the Kundan Regional Stage. He interpreted the A. expansus Biozone as a LST and considered that most of the A. raniceps Biozone (the Obukhovo Formation) corresponds to a TST, whereas the remainder of the Kundan Stage was classified as a HST. Dronov (Reference Dronov1997) concluded that the depositional sequences reflect third order relative sea-level cycles, with the Kundan sequence being in general a highstand in sea-level (the highest sea-level of the seven Ordovician depositional sequences).
Dronov & Holmer (Reference Dronov and Holmer1999) divided the Ordovician of Baltoscandia into ten depositional sequences, and suggested they represented third order cycles of relative sea-level change, each with a duration of between 4–5 to 9–10 Ma.
The current investigation has recognized several transgressive/regressive cycles within the studied sections in Estonia and Ingria, and we are inclined to classify the depositional cycles recognized by Dronov (Reference Dronov1997) and Dronov & Holmer (Reference Dronov and Holmer1999) as lower order cycles. This would be in agreement with their relatively long duration, as third order cycles normally have a duration of about 0.5–3 Ma.
In the relative sea-level curve constructed in Figure 9, the lowermost interval is especially interesting when compared with the Scandinavian and regional sea-level curves for Baltoscandia reconstructed by Nielsen (Reference Nielsen1995, Reference Nielsen, Webby, Droser, Paris and Percival2004). The basal Kundan transgression, represented by the O. callactis acme, probably reflects the sea-level rise seen in the middle part of the A. expansus Biozone in Scandinavia, which, until this study, was not thought to be present in Northern Estonia. The Lynna section further reveals that sea-level was generally higher in the lower half of the A. expansus Biozone, and the fauna of the uppermost bed of the zone also evidences a short-lived drowning close to the top of the zone. This pattern is in agreement with studies in Scandinavia (Nielsen, Reference Nielsen1995). The current study also confirms that the A. expansus Biozone represents an overall sea-level lowstand (Nielsen, Reference Nielsen1995; Dronov & Holmer, Reference Dronov and Holmer1999). Faunal and sedimentological data from Northern Iran also show a similar order of shallowing in the lowermost Darriwilian (Ghobadi Pour, Williams & Popov, Reference Ghobadi Pour, Williams and Popov2007). In our interpretation, the expansus lowstand was part of an overall second order lowstand that probably continued throughout the Kundan Stage (Nielsen, Reference Nielsen, Webby, Droser, Paris and Percival2004). This is in contradiction to the overall highstand interpreted by Dronov (Reference Dronov1997).
Sturesson, Dronov & Saadre (Reference Sturesson, Dronov and Saadre1999) noted that it is likely that the stratigraphical distribution of iron oolite facies is controlled by sea-level changes related to plate tectonics, as the iron oolites are thought to be derived from subduction-related volcanic ash falls. Changes in the spreading rate of mid-ocean ridges are usually thought to be the cause of first order sea-level changes. Increased volcanic activity leads to an increase in the volume of the mid-ocean ridges, as a result forcing the oceans to transgress the continents. However, the Kundan iron ooids are associated with an overall sea-level lowstand. Therefore, the related volcanic activity, possibly linked to the docking with Avalonia, may be of a more regional character and thus not related to first order changes in sea-level.
The two larger drownings in the overlying A. raniceps Biozone, of which the lower one is the largest, are especially characterized by the influx of O. calligramma. These are coincident with the transgressions indicated for the A. raniceps Biozone by Nielsen (Reference Nielsen1995). However, his study did not include the upper part of the A. raniceps Biozone. Thus, the major shallowing in the uppermost beds is documented here for the first time. However, Nielsen (Reference Nielsen, Webby, Droser, Paris and Percival2004) published a composite sea-level curve for the whole Kundan interval of Baltoscandia. He inferred a Basal Llanvirn Drowning Event that correlates well with the basal raniceps sea-level rise of the current study (peak in bed K−17L). A similar succession with a shallowing succeeded by a drowning is reported from northern Iran (Ghobadi Pour, Williams & Popov, Reference Ghobadi Pour, Williams and Popov2007).
The upper raniceps drowning of the current study (bed K−5) was not recognized in Nielsen (Reference Nielsen, Webby, Droser, Paris and Percival2004). It may be of fourth order or, as suggested here, represents the final stages of a prolonged period with high eustatic sea-level. The maximum regressive surface in the uppermost Obukhovo Formation most likely corresponds to the Stein Lowstand Event of Nielsen (Reference Nielsen, Webby, Droser, Paris and Percival2004). The rising sea-level in the Sinjavino and Simankovo formations probably signals the initial stages of the Helskjer Drowning Event of Nielsen (Reference Nielsen, Webby, Droser, Paris and Percival2004).
With regard to the minor fluctuations seen especially in the lower and upper part of the studied interval, these probably reflect fourth or even fifth order fluctuations in sea-level. This, of course, could also be explained by periodic fluctuations in energy levels. As Baltica was positioned at mid-latitudes during the Kundan Stage, cyclonic storms probably affected the depositional environment. The influence of these storms may have been controlled by Milankovitch cycles. Indeed, the section in Putilovo that represents most of the Kundan demonstrates four or five intervals with an especially high clay content that could be assigned to changes in the eccentricity cycles.
Though the landmasses were deeply peneplained, cyclonic storms possibly stirred the shallow waters of the studied areas. Thus, together with increased runoff from rivers, the siliciclastic input was increased considerably during these intervals. Contrary to previous research (e.g. Dronov, Reference Dronov1997), the present analysis of brachiopods shows evidence of transportation of both fossils and sediment in the marl beds. Even thick brachiopod shells, like Lycophoria, are highly fragmented in many marl horizons. This suggests that the marly intervals did not only represent background sedimentation. Probably, the marl beds were deposited during drops in sea-level, when increased erosion occurred, or during intervals of increased precipitation and cyclonic storm activity that was Milankovitch cycle-controlled. Increased runoff from rivers and increased energy levels driven by storms retained the fine siliciclastic material in suspension for longer intervals of time.
Thus, brachiopods living on the sea floor above storm wave base during these events were likely to be transported and fragmented. However, transportation was probably not very far, since the individual biofacies are still discernable, as shown by the present study.
Our interpretaions of the order of the sea-level fluctuations requires further comment. If, as claimed here, they represent third and fourth order fluctuations, this would imply that they were caused by glacio-eustasy. Hitherto, no permanent ice shields have been reported from the Darriwilian. However, recently Trotter et al. (Reference Trotter, Williams, Barnes, Lécuyer and Nicoll2008) used conodont thermometry to demonstrate that the Ordovician period, and in particular the early Darriwilian, may have been cooler than previously thought. In addition, Kaljo, Martma & Saadre (2007) used stable isotope data to show that on Baltica, the Kundan may have been subject to a significantly cooler climate. This is supported by sedimentological and trilobite data that show a coincident sea-level drop and cooling in the early Darriwilian of Northern Iran (Ghobadi Pour, Williams & Popov, Reference Ghobadi Pour, Williams and Popov2007) and arcritarch studies from central Saudi Arabia that indicate a climatic cooling at this level (Le Hérissé et al. Reference Le Hérissé, Al-Ruwaili, Miller and Vecoli2007). Further, the data from Iran show a following sea-level rise which may well be the Basal Llanvirn Drowning Event of Nielsen (Reference Nielsen, Webby, Droser, Paris and Percival2004) and thus, coincident with the lower raniceps Biozone drowning found in the current study. As noted by Ghobadi Pour, Williams & Popov (Reference Ghobadi Pour, Williams and Popov2007), a sea-level drop of similar magnitude seen in both Baltica and Iran may not be coincidental and may eventually prove to be eustatic. The succeeding rise in sea-level seems to indicate the same. Thus, the expansus lowstand described in the present study could prove to be related to the growth of minor ice caps in Gondwana during the early Darriwilian.
10. Conclusions
Ecostratigraphical investigations indicate that at least two and a half third order transgressive–regressive sequences are present in the Kundan Stage of the Putilovo section. It is clear that the shallowest palaeoenvironment along the investigated profile was in NW Estonia and that the environment progressively deepened towards the east. It is stressed, however, that the investigated section represents an oblique strike section.
Overall, the biofacies analysis and ecostratigraphical divisions in the Kundan sections in the East Baltic represent two main intervals of deposition. A lower interval, the expansus Biozone, consists of at least two third order drowning events within a second order lowstand, when especially siliciclastic material bypassed the mid-shelf area to be deposited in deeper water (in the present case to the east). This lowstand can be traced to Scandinavia, Iran and Saudi Arabia. This strengthens the eustatic signal of the sea-level curve and thus suggests the growth of minor ice caps in Gondwana during the early Darriwilian.
The expansus lowstand was succeeded by larger transgressive events of third order, where the shoreline moved far to the north, leaving the examined sections starved of sediments due to marine condensation.
In particular, the sea-level rise that occurred in the lowermost Obukhovo Formation (lower A. raniceps Biozone) was substantial; it can also be recognized on Öland and throughout the rest of Scandinavia as the Basal Llanvirn Drowning Event. In addition it is reported from Northern Iran.
Thereafter followed an abrupt shallowing in the uppermost part of the Obukhovo Formation, where the shoreline probably moved significantly basinwards. This, again, was succeeded by a new prolonged drowning event that continued through the deposition of the Sinjavino and Simankovo formations.
Finally, contrary to previous interpretations (e.g. Dronov, Reference Dronov1997), this study suggests that the marly intervals did not solely represent background sedimentation, as they show evidence for transportation of both fossils and sediment. Therefore, it is proposed that the marl beds may have been deposited during either drops in sea-level, when increased erosion would be expected, or during intervals of increased precipitation or frequency of cyclonic storms, when increased runoff from rivers and high energy levels stirred and retained fine-grained material in suspension for longer periods. This latter model could be controlled by Milankovitch cyclicity.
Acknowledgements
Andrei Dronov facilitated field work and provided measured logs of the sections. We had numerous fruitful discussions in the field with Andrei, as well as Petr Fedorov. Kristian Grube Jakobsen is thanked for good company in the field and for many inspiring discussions during the months of work in the laboratory. Also we would like to thank the Carlsberg Foundation (Denmark) for financial support of the field campaign. Further, Lars Holmer (University of Uppsala, Sweden) is thanked for identifying the nonarticulate brachiopods and Anne Hastrup Ross is thanked for providing the brachiopod drawings. Finally, the authors would like to thank the anonymous referees whose comments and critical review greatly improved the manuscript. This is a contribution to IGCP Project 503: Ordovician palaeogeography and palaeoclimate.