


Introduction
What makes someone belong to an ethnic group? The question is deceptively simple. Scholars of ethnicity have long emphasized descent-based attributes such as ancestry, language, religion, and physical appearance as central to the construction and maintenance of ethnic identity. Yet, in practice, these attributes do not all carry equal weight, nor do they function uniformly across groups or contexts. A person may speak a particular language, practice a particular religion, or bear a particular surname without that attribute being sufficient—or even necessary—for coethnics to view them as a member of a given ethnic group. Still, many studies implicitly treat ethnic identity as if it can be captured by a single attribute, often out of necessity rather than theory (Easterly and Levine Reference Easterly and Levine1997; Green Reference Green2023; Kuijs Reference Kuijs2000).
This paper asks a narrower and more practical question: when, and for whom, is it defensible to operationalize ethnic identity using a single attribute? While it is widely accepted that ethnic identities involve multiple attributes, far less attention has been paid to whether those attributes are organized in sufficiently similar ways across groups to justify common measurement strategies. If researchers rely on language, ancestry, or appearance as a proxy for ethnic identity, what assumptions are they making about how those attributes relate to one another, or the broader identity that those attributes are meant to represent? And especially for comparative work looking across multiple ethnic identities, do those assumptions hold equally across groups?
To answer these questions, I analyze how individuals evaluate the relative importance of eight commonly cited identity attributes—ancestry, appearance, language, religion, surnames, holidays, cuisine, and neighborhood—using two original survey experiments conducted in the United States. The empirical focus is on respondents who identify as White, Black, or Latino. While these particular categories are specific to the U.S. context, they provide a useful setting for examining whether widely used measurement practices implicitly reflect the structure of identity for some groups more than others. Rather than asking whether ethnic identity is “multidimensional” in the abstract, the analysis evaluates whether a single dominant dimension adequately summarizes how individuals within each group understand the boundaries of group membership.
Using a combination of principal components analysis (PCA), multidimensional preference scaling (MDPREF), and circular regression, I assess whether attribute evaluations converge on a common ordering within groups, whether that ordering differs across groups, and whether within-group variation is highly structured or weakly constrained. The results show that while a single dominant dimension captures much of the variation in how White and Black respondents evaluate identity attributes, the specific attributes defining that single dimension are not the same. Moreover, a single dimension obscures a great deal of variation in attribute evaluations among Latino respondents, whose evaluations are more weakly aligned and more sensitive to framing. These differences matter for measurement: strategies that perform well for some groups may systematically mischaracterize others.
By foregrounding the relationship between identity structure and measurement validity, this paper contributes to debates on ethnicity, race, and identity by providing an integrated approach to the study of identity boundaries without presuming a universal psychological architecture. The findings raise important implications for how researchers conceptualize and measure ethnicity, particularly in contexts where data constraints push us toward overly simplified indicators. They demonstrate that the appropriateness of simplified identity measures depends on how attributes are organized within specific groups, an empirical question that can and should be evaluated rather than assumed.
The Problem with Ethnicity
Early research defining ethnicity emphasized the need for a subjective belief in common descent or ancestry (Fearon and Laitin Reference Fearon and Laitin2000; Horowitz Reference Horowitz1985; Smith Reference Smith1996; Weber Reference Weber and Sollors1996). In Weber’s (1996) words, ethnic groups are those “human groups that entertain a subjective belief in their common descent because of similarities of physical type or customs or both, or because memories of colonization and migration; this belief must be important for the propagation of group formation; conversely, it does not matter whether or not an objective blood relationship exists” (p. 56). Many of these scholars have also stressed that members of an ethnic group need to share cultural features or content. However, this led Fredrik Barth to ask an important question: if the cultural content associated with a given ethnic identity ever changes, should we consider its adopters to be an entirely new ethnicity? In answer, Barth argued the main aspect of an ethnic group is the boundary that defines those in the in-group from those in the out-group, providing a way of identifying the same ethnic group over time (Barth [Reference Barth1969]Reference Barth1998).
This insight has become axiomatic for virtually all contemporary research on the subject. But when we study ethnic categories, we often implicitly assume which attribute dimensions are most important, or even outright definitional: ethnonational and the nation; ethnoreligious and faith; ethnolinguistic and language; and ethnosomatic and race. The problem is that these attribute dimensions are frequently insufficient on their own for claiming membership. For example, while the Uyghurs of central and east Asia speak a Turkish language and predominately practice Islam, neither speaking Uyghur nor being Muslim makes someone Uyghur on its own. But if a researcher were to define Uyghur identity as an ethnolinguistic identity, a change in the language someone speaks suggests a parallel change in their ethnic identity—an assumption that may not reflect how individuals understand their own group membership.
As another example, consider the case of Black identity in the United States. Certain phenotypic traits (e.g., skin tone), possessing an ancestral connection to an enslaved person, and experiences of racial oppression could be taken as important defining aspects of this identity. If a researcher were to define Black identity as an ethnosomatic identity, one with a heavy focus on skin tone (despite, it should be said, the fact that no single skin tone comes close to capturing all individuals who identify as Black), they may classify someone whose skin tone has darkened as Black regardless of their other attributes or how that individual understands their identity. While this may seem ridiculous to modern readers who are familiar with the socially constructed nature of racial identities, this sort of imposed racial classification has many historical analogs in slave codes, Jim Crow laws, and racial purity tests.
These examples highlight the dangers of treating racial and ethnic identities as unidimensional concepts. In recognition of these issues, I draw on a line of constructivist research that defines ethnicity as the subset of identities in which descent-based attributes are necessary (though not necessarily sufficient) for membership (Chandra Reference Chandra2012). These attributes include those “acquired genetically (e.g. skin color, gender, hair type, eye color, height, and physical features), through cultural and historical inheritance (e.g. name, language, place of birth, and origin of one’s parents and ancestors), or in the course of one’s lifetime as markers of such an inheritance (e.g. last name or tribal markings)” (Chandra Reference Chandra2006, 400). Said another way, here, descent refers to socially constructed signals of ancestry, not solely those passed along through biological or genetic inheritance. This definition distinguishes ethnicity from other identities (e.g., Democrat, working-class) as those that require descent-based attributes, but is still flexible enough to allow for additional attributes that are not associated with descent to be important for determining group boundaries. In addition to capturing the vast majority of identity labels we commonly refer to as ethnicities, this definition provides a shared framework for analyzing ethnic, racial, and national identities, treating all three as types of “ethnicity” so long as at least one descent-based attribute is required for membership. Finally, this definition allows for an individual to have multiple ethnic identities (e.g., Black, Latino, and Afro-Latino; Hmong and Asian) to the extent that they possess the necessary attributes (i.e., meet the membership rule) for more than one category.
Crucially, this definition does not imply that all descent-based identities are organized in the same way. Instead, it raises an empirical question: how do individuals organize and prioritize these attributes when evaluating group membership, and does that organization vary across groups? Answering this question is essential for assessing whether common measurement strategies capture the identities they claim to measure.
A Unified Approach
Before moving on, it is worth reiterating how this definition differs from other approaches to identities like race and ethnicity. Many scholars focus on a single type of identity for good reasons: the different processes and actors that play a role in giving rise to such identities; the varying ways these identities divide and order groups in society; and how these elements shape the ways identity influences political outcomes. Furthermore, the identity dynamics in different societies are often dominated by a particular identity cleavage, such as in the case of race in the United States.
Coming from the field of comparative politics and drawing on the constructivist definition of ethnic identity above, I instead use the terms “ethnicity” and “ethnic identity” to include all identities for which descent Footnote 1 plays a definitional role (i.e., at least one descent-based attribute is required for membership) (Schmotter Reference Schmotter2025). Thus, I treat identities we commonly term “racial” and “ethnic” as different sub-types of the same basic concept—ethnic identity. This approach is similar to ERI (ethnic–racial identity) models of identity developed in psychology. The proponents of ERI argue that the divisions between race and ethnicity are based on nominal conventions, and that the considerable empirical, experiential, and conceptual overlap between race and ethnicity means they should be studied using the metaconstruct of ethnic–racial identity (Thelamour et al. Reference Thelamour2024; Umaña-Taylor et al. Reference Umaña-Taylor2014). In contrast, other authors have argued that certain features of race, such as experiences of racial oppression or racially-structured material inequalities, are inseparable from the formation and meaning of racial identities, especially for those individuals whose racial identities place them outside of the privileged position in the racial hierarchy (Omi and Winant Reference Omi and Winant1994; Thelamour et al. Reference Thelamour2024).
Recognizing these concerns, this paper does not attempt to collapse race and ethnicity into a single social process. Instead, it asks whether, despite these differences, individuals rely on similar or distinct configurations of attributes when determining group membership. To be clear, I do not mean to dismiss race’s distinct social and political significance in the United States, nor its relationship to state violence, systemic inequality, and experiences of oppression. While I acknowledge that identities like race and ethnicity can differ in important ways, I argue that they are similar in how their constituent parts are related to societal norms of classification (Roth Reference Roth2018). Using this as my starting point, this paper presents a series of methods that allow scholars to test the extent to which the structures of various racial (e.g., White, Black), ethnic (e.g., Kurdish; Gujarati), or national (German; Japanese) identities resemble one another. As a result, it also allows researchers to investigate whether or not these identities draw on similar sorts of attributes and whether they can be accurately measured using a single general approach or require unique strategies.
Empirically, and as I describe in greater detail in the section below, the analysis focuses on White, Black, and Latino American adults. While White and Black are commonly understood as racial identities (especially in the context of the United States), Latino identity is frequently understood as an ethnic identity—and is occasionally combined with racial categories to further disaggregate demographic groups. While the U.S. Census Bureau collects information on Latino identity using a separate question from that on race, some scholars of the United States, in addition to political observers, treat Latinos as a racial category of its own. From this perspective, this study speaks solely to race and even then only race in the U.S. context.
Given my data, this is a fair interpretation of my results. But as I demonstrate below, my respondents understand the structure of Latino identity quite differently from White and Black identity, differences that would be obscured by treating all three as “races” and ones that could not be investigated should Latino identity be sequestered on its own as incomparably “ethnic.” By instead operationalizing ethnicity as a descent-based identity and focusing on the organization of identity attributes rather than category labels, this paper provides a unified framework for assessing measurement validity across groups and demonstrates how treating these identities as subtypes of a larger concept allows for a more fine-grained analysis of the ways in which they are structurally similar and dissimilar. Moreover, the methods described below provide a roadmap for scholars to track how these structures evolve over time, dovetailing with other research investigating phenomena such as the racialization of Latino identity (Massey Reference Massey, Bucerius and Tonry2014). More broadly, it offers tools for evaluating whether simplified indicators plausibly capture the identities they are intended to represent, as well as identifying when they do not.
From Definition to Measurement
Although ethnic identities can be defined using a variety of attributes, language has historically occupied a central role in ethnographic classification (similar to the way certain phenotypic traits associated with groups of people with a shared geographic origin guided racial classification). Early British ethnographers tended to focus on language as a means of distinguishing ethnic communities, a heuristic borrowed by Soviet and Chinese ethnographers embarking on their own projects of ethnic classification (Mullaney Reference Mullaney2012; Suny et al. Reference Suny, Suny and Martin2001). One effect of this is that today we are limited in the sorts of historical data that are available to test theories regarding changes in ethnic identity. This means that rather than ethnic identity per se, scholars are often reliant on measuring identity change using things like the ethnolinguistic fractionalization index (ELF) or primary language as reported in government censuses (E. Green Reference Green2023; Hoddie Reference Hoddie2006; Laitin Reference Laitin1998).
For some research questions, this strategy is appropriate. However, it raises a fundamental measurement problem: does a change in a single attribute reflect a change in ethnic identity, or merely a change in one component associated with that identity? For example, is a change in one’s primary language spoken best thought of as a matter of skill-acquisition, a change in ethnolinguistic identity alone, or a change in ethnic identity in a broader sense? This question is especially salient when other incentives, such as the ability to participate in the workforce or a desire to blend into society, may encourage an individual to adopt one or two new ethnic attributes (e.g., a new language, style of dress, cuisine) without a corresponding change in how they understand their group membership.
These concerns have prompted scholars to reconceptualize ethnic identity as not reducible to any one attribute. In the past two decades, scholarship on race and ethnicity has increasingly come to recognize the multifaceted nature of these identities. Beyond classic markers like ancestry, appearance, language, or religion, racial and ethnic identities are correlated with attributes such as names, holidays, clothing, neighborhood, social status, and more (Freeman et al. Reference Freeman2011; Garcia and Abascal Reference Garcia and Abascal2016; Hayward Reference Hayward2013; Holsapple Reference Holsapple2023; Huang Reference Huang2023; Sen and Wasow Reference Sen and Wasow2016). Which attributes are important to a given identity have been shown to vary by group and across contexts (Chen et al. Reference Chen, de Paula Couto, Sacco and Dunham2017; Habyarimana et al. Reference Habyarimana, Humphreys, Posner and Weinstein2009). In addition, we now have a range of tools for operationalizing multidimensional identities, the attributes of which may be related to one another in extremely complex ways (Chandra Reference Chandra2006, Reference Chandra2012; Posner Reference Posner2017; Sen and Wasow Reference Sen and Wasow2016).
Yet acknowledging that identities involve multiple attributes does not, by itself, resolve the measurement problem. For one, even if all of these markers are associated with ethnic identity, they may not be constitutive of it. For example, perhaps ancestry is the trait that defines group boundaries, with other attributes like style of dress better thought of as an effect of ethnic identity rather than something that delimits members from non-members. In this formulation, ethnic identity—defined by ancestry—is the treatment, and its effect on things like style of dress may be stronger or weaker depending on either the “strength” of the treatment or some number of other factors. In either case, this would lead to a hierarchy of identity attributes, with one serving as a near-perfect classifier and others as increasingly noisy proxies.
It is also possible that different attributes jointly define group boundaries, such that an individual must possess multiple attributes in tandem to be classified as a member of the group. These classification rules might be clear-cut, in line with a sort of Boolean logic, or may follow a blurrier “family resemblance” approach where no particular attribute is absolutely required so long as a collection of attributes gets one “close enough” to be counted as a member of the group. In these worlds, single-attribute measures risk systematically misclassifying individuals, especially when researchers are interested in identity change rather than static classification.
These conceptual distinctions raise a further challenge: the difference between how researchers measure identity and how individuals understand it. If an attribute like the ability to speak a certain language is how membership in an identity category is defined, then a change in language is equivalent to a change in identity. But if an identity category is defined by multiple attributes, then a change in language may be reflective of some other dynamic entirely. To better illustrate what I mean, consider the case of the Kurdish people of Türkiye. In a simplified version of Green’s (Reference Green2023) formulation, a Kurdish person who previously reported speaking Kurdish most frequently in their day-to-day interactions should be considered to have swapped their Kurdish identity for a Turkish one if they subsequently report speaking Turkish most frequently in their day-to-day interactions.Footnote 2 But is this really a change in ethnic identity? Only in the case that language is the key defining trait for these identities.Footnote 3
If measuring ethnic identity using a single attribute dimension is problematic, there are other options worth considering. One common approach is to use self-reported ethnic identity rather than collecting information on ethnic attributes. If I identify as Kurdish at one point and Turkish at a later point, this is good evidence that my ethnic identity has changed. But this data suffers from limitations of its own and may not be useful for certain research questions. For one, self-reported identity collected via something like a census is not always available, and the options from which respondents select may be limited by the survey design (decisions about which may be political in nature). Furthermore, self-reports of ethnic identity do not reveal why or how identity shifts come about: is it a result of an individual acquiring new ethnic attributes associated with Kurdish or Turkish identity, because their understanding of the social rules defining Kurdish and Turkish has shifted, or some other mechanism entirely? Furthermore, if I am interested in a group of people that have reclassified, self-reports alone do not allow me to determine whether these individuals reclassified in the same way: perhaps one person acquired a new language, another acquired a whole range of new ethnic attributes, and a third adopted a new definition for the group and reclassified themselves without any change in their ethnic attribute repertoire.
At the other extreme is a factorial approach, where the researcher collects data on a wide range of ethnic attributes and constructs full cross-tabulations of each combination. One advantage is that this allows the researcher to avoid deciding which identities count as “ethnic” by focusing instead on how attribute dimensions segment the full population. Selway provides an example of what this could look like, creating three multidimensional measurements of social structure using combinations of race, language, religion, region, and income Selway (Reference Selway2011). While a significant advancement, several limitations remain. First, the burden of collecting such data is enormous, and because such data does not exist equally across regions and countries, this approach has limited applications in comparative contexts. This approach also would treat all possible identity dimensions as equally salient, despite the fact that some ethnic identities may be more strongly defined by some attributes than others (e.g., religion may not define separate ethnic identities). Individual cells representing particular combinations of attributes like religion, language, race, and region may not correspond to identity groups in any meaningful way, and the potentially small values in each cell as the population is partitioned further and further make detecting statistical significance difficult. Finally, this approach by itself is poorly suited to studying change in ethnic identities because a change on any dimension would be equivalent to a change in identity (i.e., the individual falls into a new cell in the cross-tab), a result that is disconnected from real-world identity categories.
In this paper, I treat these issues as empirical measurement problems rather than purely conceptual ones. The central question is not whether ethnic identity involves multiple attributes, a point that is broadly accepted by scholars today, but whether those attributes are organized in ways that permit simplified measurement. Specifically, are the attributes of ethnic identity sufficiently consistent with one another that ethnic identity can be treated as unidimensional, and when does such simplification obscure meaningful differences across groups? As explained above, much quantitative research on identity distinguishes between the identity categories under analysis using a single dimension (e.g., language, nationality). While attributes like language serve as practical identity markers, especially given the limitations of using historical census and survey data, it is an open question whether such approaches are actually measuring the identities they claim to measure (e.g., Moldovan; Turkish) or a separate identity category defined solely by the attribute for which information has been collected (e.g., Romanian-speakers; Turkish-speakers). Another issue such studies raise is whether it is appropriate to compare groups defined by an attribute like language to groups defined in a more culturally holistic manner by those collecting the data, especially when both types appear in the same dataset, as is the case in early ethnic compendia like the Soviet Atlas Narodov Mira.
To answer my central question, I use a sequence of multidimensional analysis tools to investigate the architecture of three ethnic identities in the United States. I begin with PCA to evaluate whether a dominant latent dimension accounts for most variation in the importance individuals ascribe to different ethnic attributes. I then turn to MDPREF to assess whether individuals order attributes along a common axis or display weakly constrained preferences. Finally, circular regression then examines whether variation in these orderings is systematically related to observable characteristics or largely unstructured. Together, these methods allow for an explicit evaluation of whether common measurement strategies plausibly capture the identities they aim to measure, and whether those strategies perform differently across groups.
Data
To analyze the dimensionality and structure of ethnic identity, I draw on two original online survey experiments hosted by Qualtrics and fielded in the United States in May 2024. The first survey includes three independent samples of 600 adults each, drawn from the three largest racial and ethnic communities in the United States: self-identifying White, Black, and Latino Americans. Each respondent was randomly assigned to a control or one of two treatment conditions, with an equal split across all three groups. In Treatment 1, respondents read a short description of an affirmative action policy tailored to their ethnic group, which defined eligibility for the program based on holidays, cuisine, and neighborhoods. The second treatment mirrored the first, but instead defined eligibility using ancestry, appearance, and language. While not the primary focus of this paper, the treatments were designed to test whether individuals’ understanding of their ethnic identity is sensitive to how ethnic identity is framed: something more cultural, practiced, and elective (e.g., Treatment 1) or something more ascriptive, inherited, and largely fixed (e.g., Treatment 2). The second survey mirrors the first but focuses exclusively on a sample of 900 Latino American adults and includes an additional conjoint component (not analyzed here). I pool respondents from the two surveys in the analyses that follow.
The primary focus of both surveys was to elicit respondent preferences regarding eight attributes commonly associated with ethnic identity: ancestry, appearance, language, religion, surnames, holidays, cuisine, and neighborhood. These were measured alongside a battery of questions related to political orientation, socioeconomic characteristics, and classic demographics like age and gender. Table A1 provides descriptive statistics for the full sample, split by ethnic group, while Table 1 provides an overview of the eight attributes and the language provided to respondents for the Likert scale question (discussed below).
Attribute descriptions shown to respondents

Table 1 Long description
A table with two columns: Attribute and Description. The table lists eight attributes associated with ethnic identity and their corresponding descriptions. The attributes are Ancestry, Appearance, Cuisine, Holidays, Language, Names, Neighborhood, and Religion. Each attribute is described by a question about its importance. The descriptions are as follows: Ancestry - How important is it that they have ancestors from certain places? Appearance - How important is it that they have a certain physical appearance? Cuisine - How important is it that they are familiar with certain foods? Holidays - How important is it that they celebrate certain holidays? Language - How important is it that they speak a certain language? Names - How important is it that they use certain names? Neighborhood - How important is it that they live in certain neighborhoods? Religion - How important is it that they practice a certain religion or faith?
Note. Respondents were asked to provide a rating of importance to their understanding of who should count as White/Black/Latino for each of the attributes listed. These questions were asked separately, and the order in which the questions were presented was randomized across respondents.
Respondents were asked to evaluate how important or useful each of the eight attributes is for determining whether someone shares their ethnic identity. This information was collected in two ways: first, using a 5-point Likert scale for each attribute dimension individually; and second, using a single question that asked respondents to rank-order all eight attribute dimensions at once. The exact presentation of the ranked question can be found in the Appendix (Figure A1). In both cases, the order in which attributes were presented was randomized for each respondent.
While earlier research suggested that rank-order questions in particular may force respondents to select among answers that they believe to be equally important (Alwin and Krosnick Reference Alwin and Krosnick1985; Maio et al. Reference Maio, Roese, Seligman and Katz1996), more recent research suggests this is not a serious problem and that respondents are more than capable of adjudicating between similarly valued response options (Ciuk and Jacoby Reference Ciuk and Jacoby2014; Jacoby Reference Jacoby2006). A more pressing concern is that rank distances may not be equivalent across the distribution (e.g., 1st to 2nd is not the same as 5th to 6th). Accordingly, I treat my Likert measure as interval data and the ranked measure as ordinal.
In total, the two survey experiments contain data from 2,826 respondents. To avoid confounding effects from the treatment conditions, I restrict my initial analyses to the 957 respondents assigned to the control condition. Among these, 790 provided a distinct set of responses to the Likert scale questions, while 928 respondents provided distinct rank-orderings. This demonstrates substantial heterogeneity in how respondents perceive the importance of different ethnic attributes.
Table 2 provides some additional description of the distribution of rankings for the full dataset, with each cell denoting the proportion of respondents who placed each attribute in each rank. Ancestry occupies the number one spot (29.05%), with appearance (17.66%) and language (14.94%) coming in a distant second and third, respectively. In comparison, neighborhood is the most common attribute ranked last (19.85%), with religion taking the honor of being the second-most-commonly last-ranked attribute (17.76%). Attributes like cuisine, holidays, and names tend to place somewhere in the middle, while appearance displays the opposite dynamic and is frequently rated either the most or least important attribute. As I discuss below, this is due to the very different emphasis placed on appearance across my three respondent groups. But to determine the extent to which there is any systematic structure within the full set of individual attribute preferences, I turn to the first of my dimensionality analyses, PCA.
Distribution of importance ranks for eight ethnic attributes

Table 2 Long description
A table with eight rows and eight columns, showing the distribution of importance ranks for eight ethnic attributes. The columns are labeled Rank, Ancestry, Appearance, Cuisine, Holidays, Language, Names, Neighborhood, and Religion. Each row represents a rank from 1 to 8 and the corresponding proportions for each attribute. Row 1: Rank 1, Ancestry 29.05, Appearance 17.66, Cuisine 7.63, Holidays 6.58, Language 14.94, Names 6.69, Neighborhood 7.00, Religion 10.45. Row 2: Rank 2, Ancestry 17.97, Appearance 15.15, Cuisine 10.97, Holidays 10.76, Language 17.24, Names 10.87, Neighborhood 7.52, Religion 9.51. Row 3: Rank 3, Ancestry 12.33, Appearance 11.08, Cuisine 14.63, Holidays 11.81, Language 15.57, Names 13.38, Neighborhood 11.70, Religion 9.51. Row 4: Rank 4, Ancestry 9.51, Appearance 9.20, Cuisine 17.03, Holidays 14.73, Language 12.75, Names 14.94, Neighborhood 10.34, Religion 11.49. Row 5: Rank 5, Ancestry 8.57, Appearance 10.34, Cuisine 14.94, Holidays 13.48, Language 11.81, Names 16.30, Neighborhood 12.12, Religion 12.43. Row 6: Rank 6, Ancestry 6.79, Appearance 10.97, Cuisine 15.15, Holidays 14.00, Language 11.18, Names 13.48, Neighborhood 14.32, Religion 14.11. Row 7: Rank 7, Ancestry 9.20, Appearance 10.66, Cuisine 9.93, Holidays 16.30, Language 8.67, Names 13.38, Neighborhood 17.14, Religion 14.73. Row 8: Rank 8, Ancestry 6.58, Appearance 14.94, Cuisine 9.72, Holidays 12.33, Language 7.84, Names 10.97, Neighborhood 19.85, Religion 17.76.
Note: Cell entries are percentages, and the total number of observations is 957. Cell values indicate the proportion of respondents that placed each attribute at a given rank, where 1 is the most important and 8 is the least important. Both columns and rows sum to 100 (with any discrepancies due to rounding).
Assessing Consistency Between Rating and Ranking Measures
Because respondents were asked to complete both rating and rank-order tasks for the same set of identity attributes, I assess the internal consistency of these responses as a basic validity check. For each respondent who completed both tasks, I compute a Spearman rank-order correlation between their Likert ratings and their ranked preferences.
Of the 2,826 respondents, 311 assigned identical ratings to all eight attributes, which precludes the calculation of a rank-order correlation. These respondents are therefore excluded from this diagnostic only. Because it is difficult to distinguish satisficing from substantively meaningful responses in this subset—and because including or excluding them has no substantive effect on any of the analyses that follow—I retain all respondents in the main analyses.
Figure 1 displays the distribution of within-respondent correlations by ethnic group. Across the full sample, the correlations are generally positive but modest in magnitude (median ρ = .405; mean ρ = .314), with approximately 75% of respondents exhibiting positive associations between their ratings and rankings. Similar distributions are observed within each ethnic group. Among Black respondents, the median correlation is .294 (mean = .249); among Latino respondents, the median is .412 (mean = .316); and among White respondents, the median is .454 (mean = .373). In each case, the distribution is centered above zero, and a clear majority of respondents display positive alignment between the two measures.
Distribution of within-respondent Spearman correlations between rating and ranking tasks. Note. Each panel shows the distribution of Spearman rank-order correlations between respondents’ Likert ratings and ranked preferences across eight identity attributes. Respondents who assigned identical ratings to all attributes are excluded from this diagnostic, as rank-order correlations are undefined in such cases. Distributions are shown for the full sample and separately by ethnic group.

Figure 1 Long description
Panel A: A histogram shows the frequency distribution of Spearman correlations for the full sample. The x-axis represents Spearman ρ values ranging from -1.0 to 1.0, and the y-axis represents frequency. The distribution peaks around 0.5 to 1.0, indicating a higher frequency of positive correlations. Panel B: A histogram displays the frequency distribution of Spearman correlations for white respondents. The x-axis represents Spearman ρ values ranging from -1.0 to 1.0, and the y-axis represents frequency. The distribution peaks around 0.5 to 1.0, showing a higher frequency of positive correlations. Panel C: A histogram illustrates the frequency distribution of Spearman correlations for black respondents. The x-axis represents Spearman ρ values ranging from -1.0 to 1.0, and the y-axis represents frequency. The distribution peaks around 0.5 to 1.0, indicating a higher frequency of positive correlations. Panel D: A histogram shows the frequency distribution of Spearman correlations for Latino respondents. The x-axis represents Spearman ρ values ranging from -1.0 to 1.0, and the y-axis represents frequency. The distribution peaks around 0.5 to 1.0, showing a higher frequency of positive correlations.
This pattern suggests that respondents’ ratings and rankings are directionally aligned more often than not, indicating that the two tasks captured related evaluations of attribute importance rather than random or contradictory responses. Rankings of course impose a forced ordering, whereas Likert ratings permit ties and scale compression; moreover, each within-person correlation is estimated over only eight items, which increases the variability of the correlation estimate. Furthermore, given the abstract nature of the task (and question format; see Figure A1), modest correlations are to be expected; the key point is that the alignment is overwhelmingly positive.
Principal Components Analysis
To assess whether a single latent dimension can plausibly summarize how respondents evaluate ethnic identity attributes, I begin with a PCA of Likert-scale ratings of attribute importance for each of the three respondent identity groups, estimated using a polychoric correlation matrix to respect the ordinal nature of the response scales (Holgado–Tello et al. Reference Holgado-Tello, Chacón-Moscoso, Barbero-Garca and Vila-Abad2010). PCA is useful here as a measurement diagnostic: if responses are organized primarily along one dimension, then a single component should account for most systematic covariance among the eight attributes. If multiple dimensions are substantively important, variance should be more evenly distributed across components, and the loadings should reveal stable secondary structure. For example, if ancestry and appearance load heavily on the first component, while cuisine and holidays load on the second, we might interpret the first dimension as capturing more “ascriptive” or sticky and inherited aspects of identity, and the second as reflecting more “acquirable” or cultural components.
I use two complementary criteria to evaluate whether ethnic identity can be treated as unidimensional for the purpose of measurement. First, I examine the scree pattern and eigenvalues: a sharp elbow after the first component and eigenvalues below one for subsequent components indicate that additional components explain little variance relative to the original items. Second, I examine whether including a second component produces separation among attributes that would change substantive conclusions about which attributes are central to group membership. To clarify, I am not using PCA to recover ‘true’ latent dimensions, but as a diagnostic tool for evaluating whether simplified measurement strategies plausibly approximate how respondents organize identity attributes.
The clear dominance of the first component for all three groups is easily seen in Figure 2. For all three groups, the eigenvalue for PC2 falls below 1, suggesting that any second dimension explains less variance than a single original attribute. Also of note is the variation in the eigenvalues for PC1 across groups: White participants’ responses are most tightly structured along a single dimension, while Latino participants’ responses are the least. Taken together, these patterns imply that a single dominant dimension provides a reasonable summary of attribute evaluations among these respondents, while leaving open the possibility of a weaker secondary dimension, particularly for Latino respondents, that may matter for interpretation and measurement.
Screen plot by ethnic group.

Next, I turn to my variable loadings. To save space, I note the most important features here, but Table A2 provides the full list of values. I find that all eight attributes are positively correlated with the first principal component, with values ranging from .660 to .923 across all three identities. This is a good facial test that these attributes are indeed all capturing some part of the same latent concept (i.e., ethnic identity), and that all eight attributes display a similar relationship to it (e.g., same sign).
The more consequential question for measurement is whether there is any sort of secondary differentiation among attributes beyond this general dimension. Here, the patterns diverge across groups. Among White respondents, PC2 is dominated by appearance, while ancestry dominates PC2 for Black respondents. Among Latino respondents, things are a bit more complicated; while ancestry and appearance display the strongest loadings, they are significantly weaker than in the case of White and Black respondents and have opposite signs to one another. This suggests that for White and Black respondents, all attributes capture these ethnic identities to some degree, with appearance and ancestry occupying a special position, respectively. In the case of Latino identity, these results suggest these respondents may conceptualize Latino identity in divergent ways, with some emphasizing ancestral roots and others more outward markers like appearance.
To more easily understand the relationships between these attributes, these results can also be visualized using a biplot, which simultaneously displays both the attributes and respondents in a common two-dimensional space. Figure 3, Figure 4, and Figure 5 display these plots for each identity group. In these representations, each point corresponds to a respondent’s position based on their evaluations, while each vector represents an identity attribute.
PCA biplot for white respondents. Note. In this biplot, the first two principal components comprise the x- and y-axes, respectively. Vectors represent identity attributes and points individual respondents, plotted based on their scores and loadings on the first two principal components. The more tightly clustered a group of points, the more similar the ratings provided by those respondents. The direction of an arrow indicates increasing values for a given variable in the reduced dimensional space, while the length of the arrows signifies the strength of their contribution to the principal components. Variables pointing in similar directions are positively correlated, while those pointing in opposite directions are negatively correlated.

PCA biplot for black respondents. Note. In this biplot, the first two principal components comprise the x- and y-axes, respectively. Vectors represent identity attributes and points individual respondents, plotted based on their scores and loadings on the first two principal components. The more tightly clustered a group of points, the more similar the ratings provided by those respondents. The direction of an arrow indicates increasing values for a given variable in the reduced dimensional space, while the length of the arrows signifies the strength of their contribution to the principal components. Variables pointing in similar directions are positively correlated, while those pointing in opposite directions are negatively correlated.

PCA biplot for Latino respondents. Note. In this biplot, the first two principal components comprise the x- and y-axes, respectively. Vectors represent identity attributes and points individual respondents, plotted based on their scores and loadings on the first two principal components. The more tightly clustered a group of points, the more similar the ratings provided by those respondents. The direction of an arrow indicates increasing values for a given variable in the reduced dimensional space, while the length of the arrows signifies the strength of their contribution to the principal components. Variables pointing in similar directions are positively correlated, while those pointing in opposite directions are negatively correlated.

Biplots provide a visual summary of the first two components by showing the relative orientation of attribute vectors (which reflects correlations among attributes and with the components), and the extent to which each attribute contributes to the 2D representation. In what follows, I emphasize the relative separation of key attributes (especially ancestry and appearance) from the remaining cluster, since this is the aspect most directly relevant for evaluating whether single-attribute proxies behave similarly across groups.
These plots tell us different things depending on the identity group analyzed. In the case of White respondents, appearance most clearly captures a unique source of variation in the data. It points approximately halfway between the x- and y-axes, revealing that it is equally correlated with the first two principal components. Furthermore, as the vector with the largest angle from the x-axis, appearance largely defines the variation captured by the second principal component. In contrast, the remaining seven attributes in Figure 3 are tightly clustered, suggesting they capture a very similar component of White identity.
The plot for Black respondents (Figure 4) is similar, with three important differences. In addition to displaying slightly less clustering than that observed in Figure 3, ancestry replaces appearance as the strongest attribute defining the second principal component. The angular separation of ancestry and appearance is also noteworthy: while ancestry was the closest to appearance in the case of White respondents, in the results among Black respondents these vectors are approximately orthogonal, indicating little correlation between ancestry and appearance and suggesting that they reflect largely independent dimensions of the identity structure observed among Black respondents. Finally, the plot for Latino respondents (Figure 5) most clearly suggests multiple underlying identity dimensions. Here ancestry again stands alone, with cuisine, holidays, and language forming a second dimension and names, neighborhood, religion, and appearance collectively providing additional variation.
Taken together, the PCA results point to a simple but important conclusion. Across groups, respondents’ evaluations share a strong common dimension (captured by PC1) that reflects how individuals treat ethnic boundaries as defined by the attribute set overall. Beyond this, secondary differentiation among attributes is group-specific. For White respondents, appearance is the clearest “outlier” attribute relative to the remaining cluster; for Black respondents, ancestry plays that role; and for Latino respondents, no single secondary contrast is as stable or dominant. These patterns motivate the next stage of the analysis, which uses rank-order data to assess whether respondents’ preferences converge on a common ordering of attributes within groups and whether Latino identity exhibits weaker alignment that would make single-attribute measurement approaches especially fragile.
Multidimensional Preferences Scaling
In the previous section, I restricted my analyses to the Likert measure of my eight ethnic attributes, summarizing covariance in how respondents rate attribute importance. In this section, I turn to the rank-order measure, which is better suited to assessing whether respondents share a common ordering of attributes and whether that ordering differs across groups. I draw on a technique called MDPREF to jointly represent both identity attributes and individual respondents’ rankings in a common low-dimensional space.
Specifically, I employ an ordinal vector preference model that assumes each respondent evaluates identity attributes from most to least important according to a directional preference, represented as a vector in the latent space. Attributes, then, are represented as points. If respondents within a group share a common preference structure, their vectors should cluster in similar directions; if they do not, vectors will be widely dispersed. Unlike similarity-based scaling methods, which focus on average relationships among attributes, this approach is designed to preserve individual-level rank structure and to make within-group agreement (or lack thereof) visible.
When applied to ethnic identity, MDPREF models are able to capture both the latent structure of identity attributes in addition to how individuals weight and prioritize different attributes of ethnic identity. For example, one respondent might place greater emphasis on ancestry and language, while another might focus more on surnames and religion—with each evaluation structure defined as a different direction in the low-dimension space. In this way, this method helps to reveal not only the dimensionality of ethnic identity but also the heterogeneity in how individuals interpret and organize identity-related information.
This approach provides two advantages for the measurement problem motivating the paper. First, because MDPREF uses complete rankings across the attribute set, it makes it possible to evaluate the extent to which respondents agree on a shared ordering of what “matters most” for group membership. Second, by transforming respondent preference structures into vector orientations, I’ve created directional data which can be used in a subsequent analysis of angular variability in attribute preferences using a circular-linear regression. In the next section, I use these angles as outcomes in a circular-linear regression to test whether observed heterogeneity in rankings is systematically related to respondent characteristics, an experimental condition, or whether it is largely unstructured.
Because the circular-linear regression uses the estimated vector directions, I estimate the MDPREF model on my entire dataset, including those in Treatment 1 and Treatment 2, unlike the results presented above that were limited to respondents in the control condition. While there are no substantive changes in the results of the MDPREF models regardless of whether I include these additional respondents, the specific locations of attributes and individuals in the reduced dimensional space do change. In order to use the plots presented here to aid in the interpretation of the regression results, then, I run these models on my full sample of respondents.
Following the example set by Jacoby (Reference Jacoby2014), I use a geometric approach which arranges the points (ethnic attributes) and vectors (respondent preference structures) such that each vector points toward the attributes the respondent believes are most important and away from those that they consider to be least important. To be more precise, each respondent’s vector will be oriented such that their importance rankings for the attributes are monotonically related to the order in which the attribute points project onto their vector (Jacoby Reference Jacoby2014). In other words, in the case of a perfectly fitting model, if we were to draw perpendicular lines from each attribute point to an individual’s vector, the order in which these lines meet the vector would exactly match the respondent’s original rank ordering for all respondents in the dataset. But as a rough approximation, attributes located closer to a given vector endpoint are those ranked more highly by the respondent.
For this analysis, I estimated one-, two-, and three-dimensional MDPREF solutions and selected the two-dimensional representation as the most interpretable, low-dimensional summary of the rank-order data. For all three ethnic groups, this model explains nearly 80% of the variation in the dataset (R 2 ranging from 73%–80%) with only small increases resulting from the far more complex three-dimensional solution (ranging from 80%–86%). In comparison, the one-dimensional solution is uniformly a poor fit, breaking 50% only in the case of White respondents (56.1%). Moreover, the two dimensional solution provides a stable configuration that supports clear comparisons of group-level patterns. In selecting two dimensions, I emphasize that my goal is not to claim that ethnic identity is intrinsically two-dimensional, but that it is the lowest-dimensional representation that captures systematic structure in the rankings.
In order to simplify interpretation, all individual vectors have been adjusted to a length of one, meaning all vector terminal points fall along the circumference of a unit circle—an adjustment with no substantive effect since the order in which ethnic attribute points project onto the vectors are the same, regardless of length (Jacoby Reference Jacoby2014). For extra clarity, I remove the individual vector lines from my final plots, representing their terminals with shaded points, such that each point represents a single respondent. Finally, I include a lone arrow (
 $\overline{R}$
) representing the grand mean vector. Unlike the individual respondent vectors, the length of this grand mean vector does have a substantive interpretation as it is inversely related to the amount of angular separation in the set of vectors over which the mean is calculated. Because all individual vectors are standardized to a length of 1,
 $\overline{R}$
can range from 0 (when exactly half of the individual vectors point in opposite directions) to 1 (when all vectors are perfectly aligned) (Jacoby Reference Jacoby2014). Stated simply, the greater the agreement among respondents, the longer the resulting vector.
Figure 6, Figure 7, and Figure 8 show the results of this model, with a separate plot for each ethnic group. Looking first at the attribute point configuration (represented by the solid, labeled points), attributes that are plotted nearer one another received similar importance rankings from respondents, with those far away receiving very different rankings. As noted above, these figures also show the terminal points of the vectors representing individual respondents, denoted by the shaded points on the unit circle. These points have been jittered to increase visibility, making it easier to see the distribution of individuals in the space.
Vector model of attribute preferences, White Respondents. Note. In this plot, attribute points are shown as solid circles while the terminal points of individual respondent vectors are shown as shaded circles. Vector terminal points are jittered to facilitate visual perception of the relative concentration of vectors around the unit circle. This figure also shows the mean direction vector, which describes the average attribute preference structure of the sample.

Vector model of attribute preferences, Black respondents. Note. In this plot, attribute points are shown as solid circles while the terminal points of individual respondent vectors are shown as shaded circles. Vector terminal points are jittered to facilitate visual perception of the relative concentration of vectors around the unit circle. This figure also shows the mean direction vector, which describes the average attribute preference structure of the sample.

Vector model of attribute preferences, Latino respondents. Note. In this plot, attribute points are shown as solid circles while the terminal points of individual respondent vectors are shown as shaded circles. Vector terminal points are jittered to facilitate visual perception of the relative concentration of vectors around the unit circle. This figure also shows the mean direction vector, which describes the average attribute preference structure of the sample.

In the case of White respondents (Figure 6), appearance and ancestry occupy a large region of space alone, revealing they have distinct relationships to White identity in the minds of respondents. Because an attribute like language is closer to ancestry than appearance, this also reveals that respondents view these attributes as more similar in terms of their importance to White identity than attributes like appearance and language. In comparison to appearance and ancestry, language, names, cuisine, holidays, and religion are tightly clustered, with neighborhood not far away, revealing that these attributes received similar rankings on average. We can see that the majority of White respondents fall on the left-side of the unit circle, meaning they tended to rate attributes like appearance and ancestry most highly. This impression is further reinforced by the mean vector (i.e., the arrow), which points approximately halfway between appearance and ancestry. While the dominance of appearance and ancestry is clear to see, it is far from universal. For example, we see a small clustering of endpoint vectors around the 2:00 position, which reveals more culturally-coded attributes like holidays or language are important markers of White identity for at least some respondents. While the average ordering clearly places ancestry and appearance at the top of the ranking for many White respondents, the dispersion of individual vector endpoints and the shortness of the mean vector (
 $\overline{R}=0.434$
) indicates that no single ranking profile is universal. This matters for measurement: even within groups where ancestry and appearance are typically central, relying on any single attribute as a proxy will systematically miss a nontrivial subset of respondents whose rankings prioritize more culturally coded attributes.
The plot for Black respondents (Figure 7) shows many of the same features, with both appearance and ancestry occupying their own space. Their distance from one another, however, suggests that respondents did not agree about which was more important. Furthermore, for those that preferred ancestry, religion was most often given the second place rank while those that preferred appearance were more likely to rank names as the second most important attribute. We also see the remaining attributes clustered again, suggesting that at least for the cluster of respondents located between ancestry and appearance, these other traits are roughly equal (and relatively unimportant). Similarly to the case of White respondents, the vector endpoints for Black respondents are concentrated near ancestry, with another smaller concentration near appearance and a fairly even spread between the two. The mean vector points more directly at ancestry, suggesting that ancestry is the most important on average, but with a large role remaining for appearance. Religion also plays an interesting role here—as noted, respondents that preferred ancestry to appearance also tended to prefer religion to a higher degree. In other words, many Black respondents agree that ancestry is a critically important attribute of Black identity, with a roughly even split between appearance and religion in second place for this subgroup. However, as in the case of White respondents, the relatively short length of the mean vector (
 $\overline{R}=0.392$
) and the spread of vector endpoints around the circle indicates that there is meaningful within-group dispersion in rank profiles, even as the group-average ordering remains oriented toward ancestry and appearance.
In the case of Latino respondents (Figure 8), there are several important differences to note. First, while ancestry is again quite important for many individuals, language’s location suggests it captures a very similar element of Latino identity and one that is also related to attributes like cuisine. For Latino respondents, appearance is no longer located near the greatest concentration of respondent vector endpoints, signaling its much reduced importance to Latino identity for most respondents. It is also possible to see that a large number of respondents had a more culturally-informed understanding of Latino identity. This is represented by the heavy concentration of points starting from the mean vector and moving clockwise around the circle towards attributes like cuisine, holidays, and religion. This makes sense given the overlap between religious affiliation and the holidays one tends to celebrate, but is interesting in that it seems to form a distinct way of defining Latino identity for a subset of respondents and one quite different from respondents that prioritized appearance. Crucially, the Latino configuration differs from the White and Black configurations in a way that is directly relevant for measurement: language and other attributes related to cultural practices (e.g., cuisine, holidays) are positioned much closer to the region where many respondents’ vectors point, while appearance is not. This implies that measurement strategies that treat appearance as a central proxy, plausible for White or Black identity in these data, perform much less well for Latino identity, where rankings place substantially greater weight on language and cultural practice for many respondents. That said, again the short length of the mean vector (
 $\overline{R}=0.394$
) and distribution of vector endpoints around the circle reveals a high degree of within-group variation in the rank order preferences of the attribute dimensions investigated here.
Given the different locations of attributes in each plot, it can be difficult to compare between groups. To better showcase these differences, Figure 9 also includes an MDPREF model including the rank order data of all three identity groups at once (R 2 = 0.77), with a separate mean vector arrow for each group. Two aspects of these vectors are important for interpretation: the direction of the vectors reveals the average profile of attribute rankings for each ethnic group, while the lengths of each vector correspond to the level of homogeneity of preferences among respondents in each group.
Vector model of attribute preferences, all respondents. Note. In this plot, attribute points are shown as solid circles while the terminal points of individual respondent vectors are shown as shaded circles. Vector terminal points are jittered to facilitate visual perception of the relative concentration of vectors around the unit circle. This figure also shows a mean direction vector for each respondent group, as well as the grand mean vector.

Figure 9 Long description
Panel A: A scatter plot with attributes labeled as Appearance, Ancestry, Names, Language, Cuisine, Holidays, Religion, and Neighborhood. The plot shows solid circles representing attribute points and shaded circles representing terminal points of individual respondent vectors. Arrows in blue, black, red, and yellow represent preferences of different groups: Black, Grand Mean, Latino, and White respectively. The arrows point towards different attributes, indicating group preferences. The plot also includes mean direction vectors for each group and a grand mean vector.
Focusing on the ethnic group vectors reveals that White respondents preferred appearance more strongly than Black and especially Latino respondents. By the same token, Latino respondents preferred language much more strongly than either of White or Black respondents. The grand mean vector (
 $\overline{R}=0.334$
) indicates modest within-group agreement overall, with somewhat greater alignment among White (
 $\overline{R}=0.473$
) and Latino (
 $\overline{R}=0.398$
) respondents than among Black (
 $\overline{R}=0.298$
) respondents in these data.
Given the circular nature of these data, it is also possible to describe the similarity of these preference structures by calculating the cosine of the angle between each pair of vectors, which is equal to their correlation coefficient. In this way, “vectors separated by angles less than 90 degrees represent positively correlated rankings while those separated by angles greater than 90 degrees correspond to negatively correlated rankings,” with smaller angles between vectors representing more similar attribute rankings (Jacoby Reference Jacoby2014, 762). This results in the following correlations: .97 (White-Black); .57 (Black-Latino); and .37 (White-Latino). Thus I observe a high correlation of preference rankings between White and Black respondents, a medium correlation between the preference rankings of Black and Latino respondents, and a medium-low correlation between the preference rankings of White and Latino respondents. At least with respect to these eight ethnic attributes, White and Black identity have very similar preference structures, and while the structure of Latino identity is more similar to Black than White identity, overall it is quite different from both. These patterns reinforce the paper’s central measurement implication: measurement strategies that implicitly assume a common attribute ordering across groups are more defensible for comparisons between White and Black identity than for comparisons involving Latino identity, where the average ordering is meaningfully different.
Circular-Linear Regression
For my final analysis, I estimate a circular regression model with linear predictors, termed a circular–linear regression in directional statistics. Circular–linearFootnote 4 regression is a statistical technique used when the dependent variable is measured on a circular scale—for instance, angles or directional preferences, such as positions in a political or identity space—and the independent variables are measured using a more traditional linear scale. This approach is particularly well-suited to MDPREF outputs that yield circular or radial structures, as in the MDPREF models presented in the previous section (Gill and Hangartner Reference Gill and Hangartner2010). In the context of ethnic identity, circular-linear regression allows us to assess how linear predictors (e.g., demographic characteristics, political attitudes, or social experiences) relate to the full structure of individuals’ attribute rankings in a circular space. This method allows me to investigate how continuous variables predict directional variation in attribute preference structures, enabling a more nuanced understanding of the relationship between them.
For my models, I first transform the individual vector endpoints into radians, which are then regressed on a series of independent variables using a regression of the following form:
 $\mu _{i}=\mu +g^{-1}\left({\bf x}_{i}\beta \right)$
where μ
i
is the position of a given observation’s vector endpoint around the unit circle (in radians, starting at the 3:00 position), μ is the intercept,
 ${\bf x}_{i}$
is the set of independent variables, β is the set of coefficients, and g
−1 is the link function mapping the values of the linear predictor onto the radial interval from 0 to 2π (Gill and Hangartner Reference Gill and Hangartner2010; Jacoby Reference Jacoby2014). The parameters of the circular-linear regression model are estimated by maximizing a likelihood function based upon the von Mises distribution (Fisher and Lee Reference Fisher and Lee1992; P. J. Green Reference Green1984).
For my independent variables, I include the following measures: respondent age (in years, recoded so 0 represents an 18 year old); gender (a binary variable taking a value of 1 if the respondent self-identified as a woman); highest level of education completed (an ordinal variable with 7 possible values ranging from less than high school to doctorate); partisanship (a 7-point scale ranging from strong Republican to strong Democrat); household income (an ordinal variable with 7 possible values ranging from less than $20,000 to more than $120,000); and identity strength (a composite 14-point scale ranging from 0 to 13)Footnote 5 . Furthermore, while not the primary focus of this study, as noted above, the regression approach allows me to measure any potential treatment effects, maximizing the data that can be used in the model. For this reason, I also include two binary treatment indicators and run these models on the full dataset for each ethnic group.
Table 3 presents the results of these circular-linear regressions for all three ethnic groups. The coefficient estimates can be treated similarly to those in a linear regression model, with the “zero” point represented by a horizontal line at the 3:00 position rather than the origin. This means the intercept represents the mean vector orientation (in radians, moving counterclockwise from “zero”) when all independent variables are equal to zero (Gill and Hangartner Reference Gill and Hangartner2010; Jacoby Reference Jacoby2014). To ease interpretation, I summarize the results using predicted vector orientations evaluated at substantively meaningful covariate values (e.g., group-specific means and medians). Due to the structure of the circular-linear model, the values of the coefficients themselves are not directly interpretable. That said, the sign on each coefficient indicates the direction of angular movement (clockwise for negative, counterclockwise for positive), with values representing the magnitude of change in radians rather than change in the units of each variable.
Circular-linear regression showing the effects of demographic characteristics on individual preference vector orientations

Table 3 Long description
A table comparing the effects of demographic characteristics on individual preference vector orientations across three ethnic groups: White, Black, and Latino. The table has 11 rows and 4 columns. The columns are labeled Variable, White (N = 640), Black (N = 643), and Latino (N = 1536). The rows list variables such as Treatment 1, Treatment 2, Age, Education, Partisanship, Income, Identity Strength, Female, and Intercept. Each cell contains coefficient estimates and standard errors in parentheses. Notable trends include significant values for Treatment 2 and Age in the Latino group, and Identity Strength in the White group. The table provides a detailed comparison of how different demographic factors influence preference vector orientations in each ethnic group.
Note. Cell entries are maximum likelihood coefficient estimates, standard errors, and significance stars (* p < 0.05; ** p < 0.01; *** p < 0.001) obtained from three circular regression models following the presentation by Jacoby (Reference Jacoby2014). The sign on each coefficient describes the direction of angular movement, where negative values represent clockwise and positive values counterclockwise motion.
The first thing to notice about these results is the differences between ethnic groups. In the case of White respondents, only the strength of their attachment to their White identity is associated with systematic rotation of the preference vector, while among Black respondents, none of the included predictors reliably explain directional variation. In comparison, among Latino respondents, multiple covariates (Treatment 2, age, income, identity strength, and gender) are associated with statistically detectable shifts in the orientation of rank profiles. In other words, the Latino rankings appear more responsive to measured individual differences and experimental treatments, whereas White and Black rankings appear comparatively stable with respect to these predictors.
Next, I turn to a more substantive interpretation of these results. Starting with White respondents, the mean vector in Figure 6 corresponds to a 51.8-year-old male with a 2-year degree, an annual household income of $40-59k, who identifies as a Republican-leaning independent, and who expresses a medium attachment to their White identity (6.7 on a scale from 0 to 13). Moving from the lowest to the highest possible value for identity strength translates to a 21∘ counter-clockwise shift in their vector. In the geometry of Figure 6, this rotation moves the predicted ranking profile towards a greater emphasis on appearance relative to ancestry. Substantively, this suggests that stronger identification with “White” is associated with a somewhat more appearance-centered conception of the attributes that signal group membership, though the overall ordering remains anchored in the ancestry/appearance region of the space.
For Black respondents, the regression indicates that directional variation in rankings is not well explained by the included predictors. Conditional on the covariates measured here, I do not detect systematic rotation in preference profiles associated with age, income, partisanship, identity strength, education, gender, or the experimental treatments. This does not imply that preferences are homogeneous (Figure 7 shows substantial dispersion), but that the dispersion does not align cleanly with these particular covariates. One implication is that within-group variation in how identity attributes are prioritized among Black respondents may be shaped more by unmeasured experiential or historical factors than by standard sociodemographic variables.
In the case of Latino respondents, the mean vector in Figure 8 corresponds to a 40.4-year-old female with some college, an annual household income of $40-59k, who identifies as a Democrat-leaning independent, and who expresses a medium-strong attachment to their White identity (9.8 on a scale from 0 to 13). Unlike in the two cases above, several predictors are associated with systematic rotation of ranking profiles. Of the covariates included, Treatment 2, age, and income all lead to clockwise shifts in the vector. Looking at Figure 8, this translates to a greater emphasis on attributes like language, cuisine, holidays, and religion relative to ancestry or appearance. As a reminder, Treatment 2 framed Latino identity as better defined by attributes like ancestry, appearance, and language. This result is interesting in that it suggests the frame may have altered how respondents balanced cultural-practice attributes against ancestry/appearance in their rankings, a dynamic I do not observe for Treatment 1. Age and income are also associated with clockwise movement in the same region of the space. I interpret these associations conservatively: older and higher-income respondents, on average, display ranking profiles that tilt somewhat more toward language and attributes associated with cultural practices. As the analysis does not, by itself, identify the mechanisms producing these associations, I avoid strong claims about why they occur.
In contrast, both identity strength and gender are associated with counterclockwise movement in the preference vector, increasing the importance of attributes like ancestry or appearance relative to cuisine, holidays, or religion. One interpretation is that stronger identity attachment may correlate with conceptions of group membership that emphasize more ascriptive markers. However, given the modest magnitudes and the descriptive nature of the model, I treat this pattern as suggestive rather than definitive. Finally, these covariate-associated rotations are nontrivial in geometric terms; moving from the lowest to highest values for all statistically significant variables is equivalent to 39.1∘ of angular separation in preference vectors—a significant cone of variability seen in the spread of vector endpoints on the right-hand side of Figure 8.
Taken together, the circular-linear regressions underscore the paper’s central measurement takeaway. Among White and Black respondents, the ordering of identity attributes appears largely insensitive to the measured covariates and to the brief experimental frames, even though individual rankings are dispersed. By contrast, among Latino respondents, the orientation of rank profiles is more predictably associated with several covariates and with one experimental condition, indicating greater sensitivity of attribute ordering to measured differences and contextual cues. These patterns underscore that the stability of simplified measurement strategies cannot be assumed uniformly across groups: even when a small set of attributes captures a common dimension, the relative ordering of those attributes, and their sensitivity to framing, may differ in ways that matter for inference. Ultimately, the circular-linear regression approach enables a level of precision in modeling these directional shifts that would be obscured by more conventional analytic tools. In doing so, it highlights how factors like age, income, or gender identity can meaningfully reorient the structure of ethnic identity.
Conclusion
This paper set out to answer two related questions: first, whether ethnic identities are sufficiently well approximated by a single latent dimension to justify simplified measurement in practice; and second, whether the same dimensions occupy similar positions across ethnic groups, such that a common measurement strategy could be used to compare identities over time or across contexts. Across multiple analytic approaches, the results suggest a qualified answer. On the one hand, respondents’ evaluations of identity attributes exhibit a strong common dimension, particularly for White and Black respondents, indicating that a small number of attributes capture much of the systematic variation in perceived group boundaries. On the other hand, the organization and relative ordering of those attributes differ across groups in ways that matter for research on ethnic identity. For example, while appearance plays a comparatively central role in White respondents’ rankings and ancestry does so among Black respondents, these patterns do not generalize cleanly to Latino respondents, whose rankings place greater relative weight on language and cultural-practice attributes for many individuals.
The implication is not that any single attribute is inherently inappropriate as a proxy for ethnic identity, but that the performance of such proxies is group-specific. For example, the relative importance of appearance among White respondents and ancestry among Black respondents means that studies focused on skin color 1) uncritically adopt the White perspective of identity as the standard definition, 2) match theory to practice only in the case that research participants are White, and 3) are better suited for understanding White identity than Black or Latino identity. Similarly, strategies that rely on language may capture important dimensions of Latino identity while failing to represent those for whom language is peripheral. These mismatches are not merely conceptual concerns; they shape which individuals are included in empirical categories and which dynamics are ultimately observable in data.
The importance of particular identity attributes not only varies between racial and ethnic groups but also within them, often in ways that standard demographic variables cannot fully explain. For White and Black respondents, this heterogeneity is only weakly structured by the covariates examined here; for Latino respondents, rankings are more responsive to measured characteristics and to contextual cues. Rather than treating this dispersion as evidence of noise or incoherence, the analysis highlights its relevance for measurement. When rank-orderings are weakly aligned, simplified indicators inevitably capture only a subset of the population they purport to represent.
That said, several limitations of the study warrant emphasis. For one, asking people to reflect on and rank the components of their ethnic identity in this way is both unfamiliar and abstract, and some of the observed variation in preferences (as highlighted by the discussion of Spearman’s ρ) may reflect confusion or uncertainty with the task. Furthermore, the data are cross-sectional, drawn from a single national context, and limited to three identity categories. The analysis, therefore, does not establish causal mechanisms. Instead, it offers a set of tools for diagnosing when common measurement strategies are likely to be successful and informative, and when they are not.
These results open up several important avenues for future research. First, expanding the scope of the project to include a greater number and types of ethnic identities will help researchers to understand the extent to which racial, national, and those conventionally termed “ethnic” identities resemble those in their same categories as well as those in other categories. This would also help to clarify whether the all-encompassing definition of ethnicity used here is appropriate in the first place. The differences observed here between White and Black identity on the one hand, and these racial identities as compared to Latino identity on the other, suggest that even when adopting a single framework for ethnic identity, they should be at a minimum analyzed separately. Second, future research could explore what explains the wide variation in identity attribute preferences, particularly among White and Black respondents, where sociodemographic variables were largely uninformative. Richer data on lived experience, social context, and interactions with others may help explain why some identities exhibit a more structured ordering of attributes than others.
Finally, an especially promising and exciting direction for research would involve tracking these patterns over time. Longitudinal data tracking the correlations between preference ranking vectors would allow researchers to assess whether the structure of ethnic identity is converging across groups—for example, whether Latino identity is becoming more “racialized”—or diverging, suggesting these identities are understood by individuals as different concepts in meaningful ways. Likewise, within a single group, tracking changes in preference structures could reveal whether dominant conceptualizations are forming or whether heterogeneity persists, reflecting a multiplicity of lived experiences and identity logics.
In sum, the contribution of this paper is not to merely demonstrate that ethnic identity is complex, but to show that this complexity has uneven implications for measurement across groups. Treating identity attributes as interchangeable proxies risks obscuring meaningful differences in how group boundaries are understood. By explicitly evaluating the structure and ordering of identity attributes, researchers can better align measurement choices with the identities they seek to study. As scholars continue to grapple with the challenges of measuring identity, embracing this complexity is essential not only for the sake of precision but also for doing justice to the diversity of ways people make sense of who they are.
Funding statement
This publication was made possible by the Doctoral Dissertational Survey Research Grant from the Rapoport Family Foundation. The financial sponsor played no role in the design, execution, analysis or interpretation of data, nor writing of the study. The statements made and views expressed are solely the responsibility of the author.
Competing interests
The author reports there are no competing interests to declare.
Appendix
Rank Order Question Text and Presentation.
Note. Respondents were asked to rank all eight attributes at once using the single question shown here. This question format is one potential explanation for the modest correlation observed between the two question formats. Future research in this area would be well-served by using a different approach for collecting rank data, such as successive or sequential ranking, which would help to guard against respondents mistakenly reversing the rank order of their preferences.

Descriptive statistics by identity group

Table A1 Long description
A table comparing descriptive statistics by identity group across three categories: Black, Latino, and White. The table has 14 rows and 4 columns, including column headers and row labels. Column headers are Variable, Black (N = 643), Latino (N = 1536), and White (N = 640). Row labels include Age, Identity strength, Gender, Education, Partisanship, and Income. Each row provides mean (SD) for numeric variables and n (%) for categorical variables. Notable trends include variations in age, identity strength, gender distribution, education levels, partisanship, and income across the three identity groups.
PCA Loadings by Identity Group

Table A2 Long description
The table presents PCA loadings for three identity groups: White, Black, and Latino. It has 3 groups, 8 principal components (PC1 to PC8), and 8 variables (Language, Neighborhood, Appearance, Cuisine, Ancestry, Names, Holidays, Religion). Each group has 8 rows, and each row has 8 columns of values. Row 1: White, Language, PC1: .893, PC2: .151, PC3: .043, PC4: .170, PC5: .148, PC6: .353, PC7: .034, PC8: .017. Row 2: White, Neighborhood, PC1: .889, PC2: .109, PC3: .076, PC4: .358, PC5: .018, PC6: .247, PC7: .003, PC8: .053. Row 3: White, Appearance, PC1: .660, PC2: .711, PC3: .175, PC4: .023, PC5: .152, PC6: .021, PC7: .019, PC8: .057. Row 4: White, Cuisine, PC1: .923, PC2: .079, PC3: .088, PC4: .000, PC5: .273, PC6: .043, PC7: .135, PC8: .200. Row 5: White, Ancestry, PC1: .804, PC2: .163, PC3: .570, PC4: .000, PC5: .005, PC6: .009, PC7: .048, PC8: .009. Row 6: White, Names, PC1: .917, PC2: .125, PC3: .050, PC4: .095, PC5: .248, PC6: .019, PC7: .238, PC8: .115. Row 7: White, Holidays, PC1: .917, PC2: .142, PC3: .122, PC4: .214, PC5: .043, PC6: .024, PC7: .207, PC8: .180. Row 8: White, Religion, PC1: .872, PC2: .321, PC3: .002, PC4: .196, PC5: .215, PC6: .126, PC7: .136, PC8: .134. Row 9: Black, Language, PC1: .891, PC2: .155, PC3: .034, PC4: .071, PC5: .248, PC6: .083, PC7: .114, PC8: .307. Row 10: Black, Neighborhood, PC1: .889, PC2: .023, PC3: .160, PC4: .167, PC5: .026, PC6: .043, PC7: .390, PC8: .037. Row 11: Black, Appearance, PC1: .736, PC2: .386, PC3: .442, PC4: .274, PC5: .073, PC6: .175, PC7: .051, PC8: .013. Row 12: Black, Cuisine, PC1: .847, PC2: .103, PC3: .044, PC4: .112, PC5: .482, PC6: .015, PC7: .135, PC8: .083. Row 13: Black, Ancestry, PC1: .697, PC2: .564, PC3: .424, PC4: .007, PC5: .115, PC6: .058, PC7: .003, PC8: .022. Row 14: Black, Names, PC1: .852, PC2: .261, PC3: .054, PC4: .241, PC5: .063, PC6: .287, PC7: .061, PC8: .234. Row 15: Black, Holidays, PC1: .852, PC2: .077, PC3: .229, PC4: .093, PC5: .140, PC6: .390, PC7: .140, PC8: .129. Row 16: Black, Religion, PC1: .776, PC2: .101, PC3: .336, PC4: .495, PC5: .014, PC6: .164, PC7: .000, PC8: .055. Row 17: Latino, Language, PC1: .719, PC2: .174, PC3: .542, PC4: .260, PC5: .206, PC6: .177, PC7: .012, PC8: .135. Row 18: Latino, Neighborhood, PC1: .809, PC2: .221, PC3: .243, PC4: .119, PC5: .118, PC6: .152, PC7: .049, PC8: .430. Row 19: Latino, Appearance, PC1: .755, PC2: .403, PC3: .169, PC4: .158, PC5: .062, PC6: .227, PC7: .396, PC8: .037. Row 20: Latino, Cuisine, PC1: .784, PC2: .252, PC3: .138, PC4: .090, PC5: .388, PC6: .349, PC7: .150, PC8: .010. Row 21: Latino, Ancestry, PC1: .665, PC2: .557, PC3: .212, PC4: .286, PC5: .323, PC6: .127, PC7: .012, PC8: .019. Row 22: Latino, Names, PC1: .789, PC2: .192, PC3: .152, PC4: .370, PC5: .055, PC6: .212, PC7: .252, PC8: .263. Row 23: Latino, Holidays, PC1: .780, PC2: .237, PC3: .258, PC4: .220, PC5: .193, PC6: .273, PC7: .269, PC8: .188. Row 24: Latino, Religion, PC1: .734, PC2: .334, PC3: .282, PC4: .365, PC5: .250, PC6: .137, PC7: .208, PC8: .112.
Note. These PCA loadings are based on respondents in the control group only
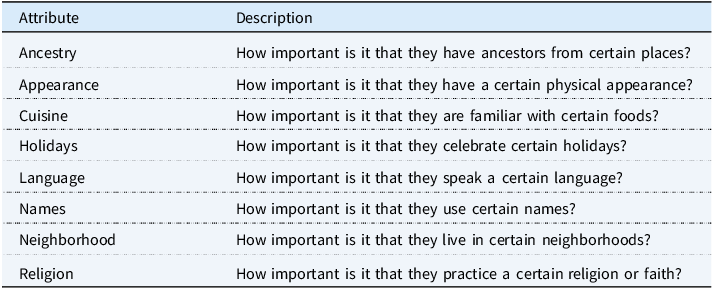
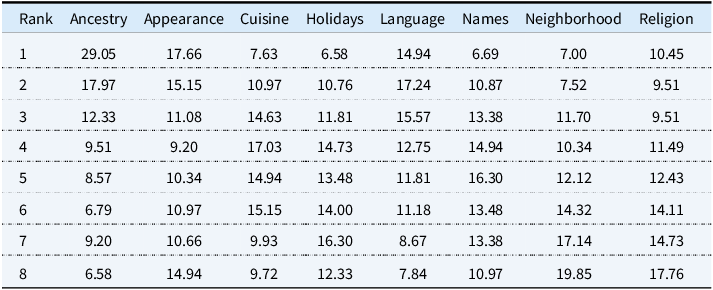
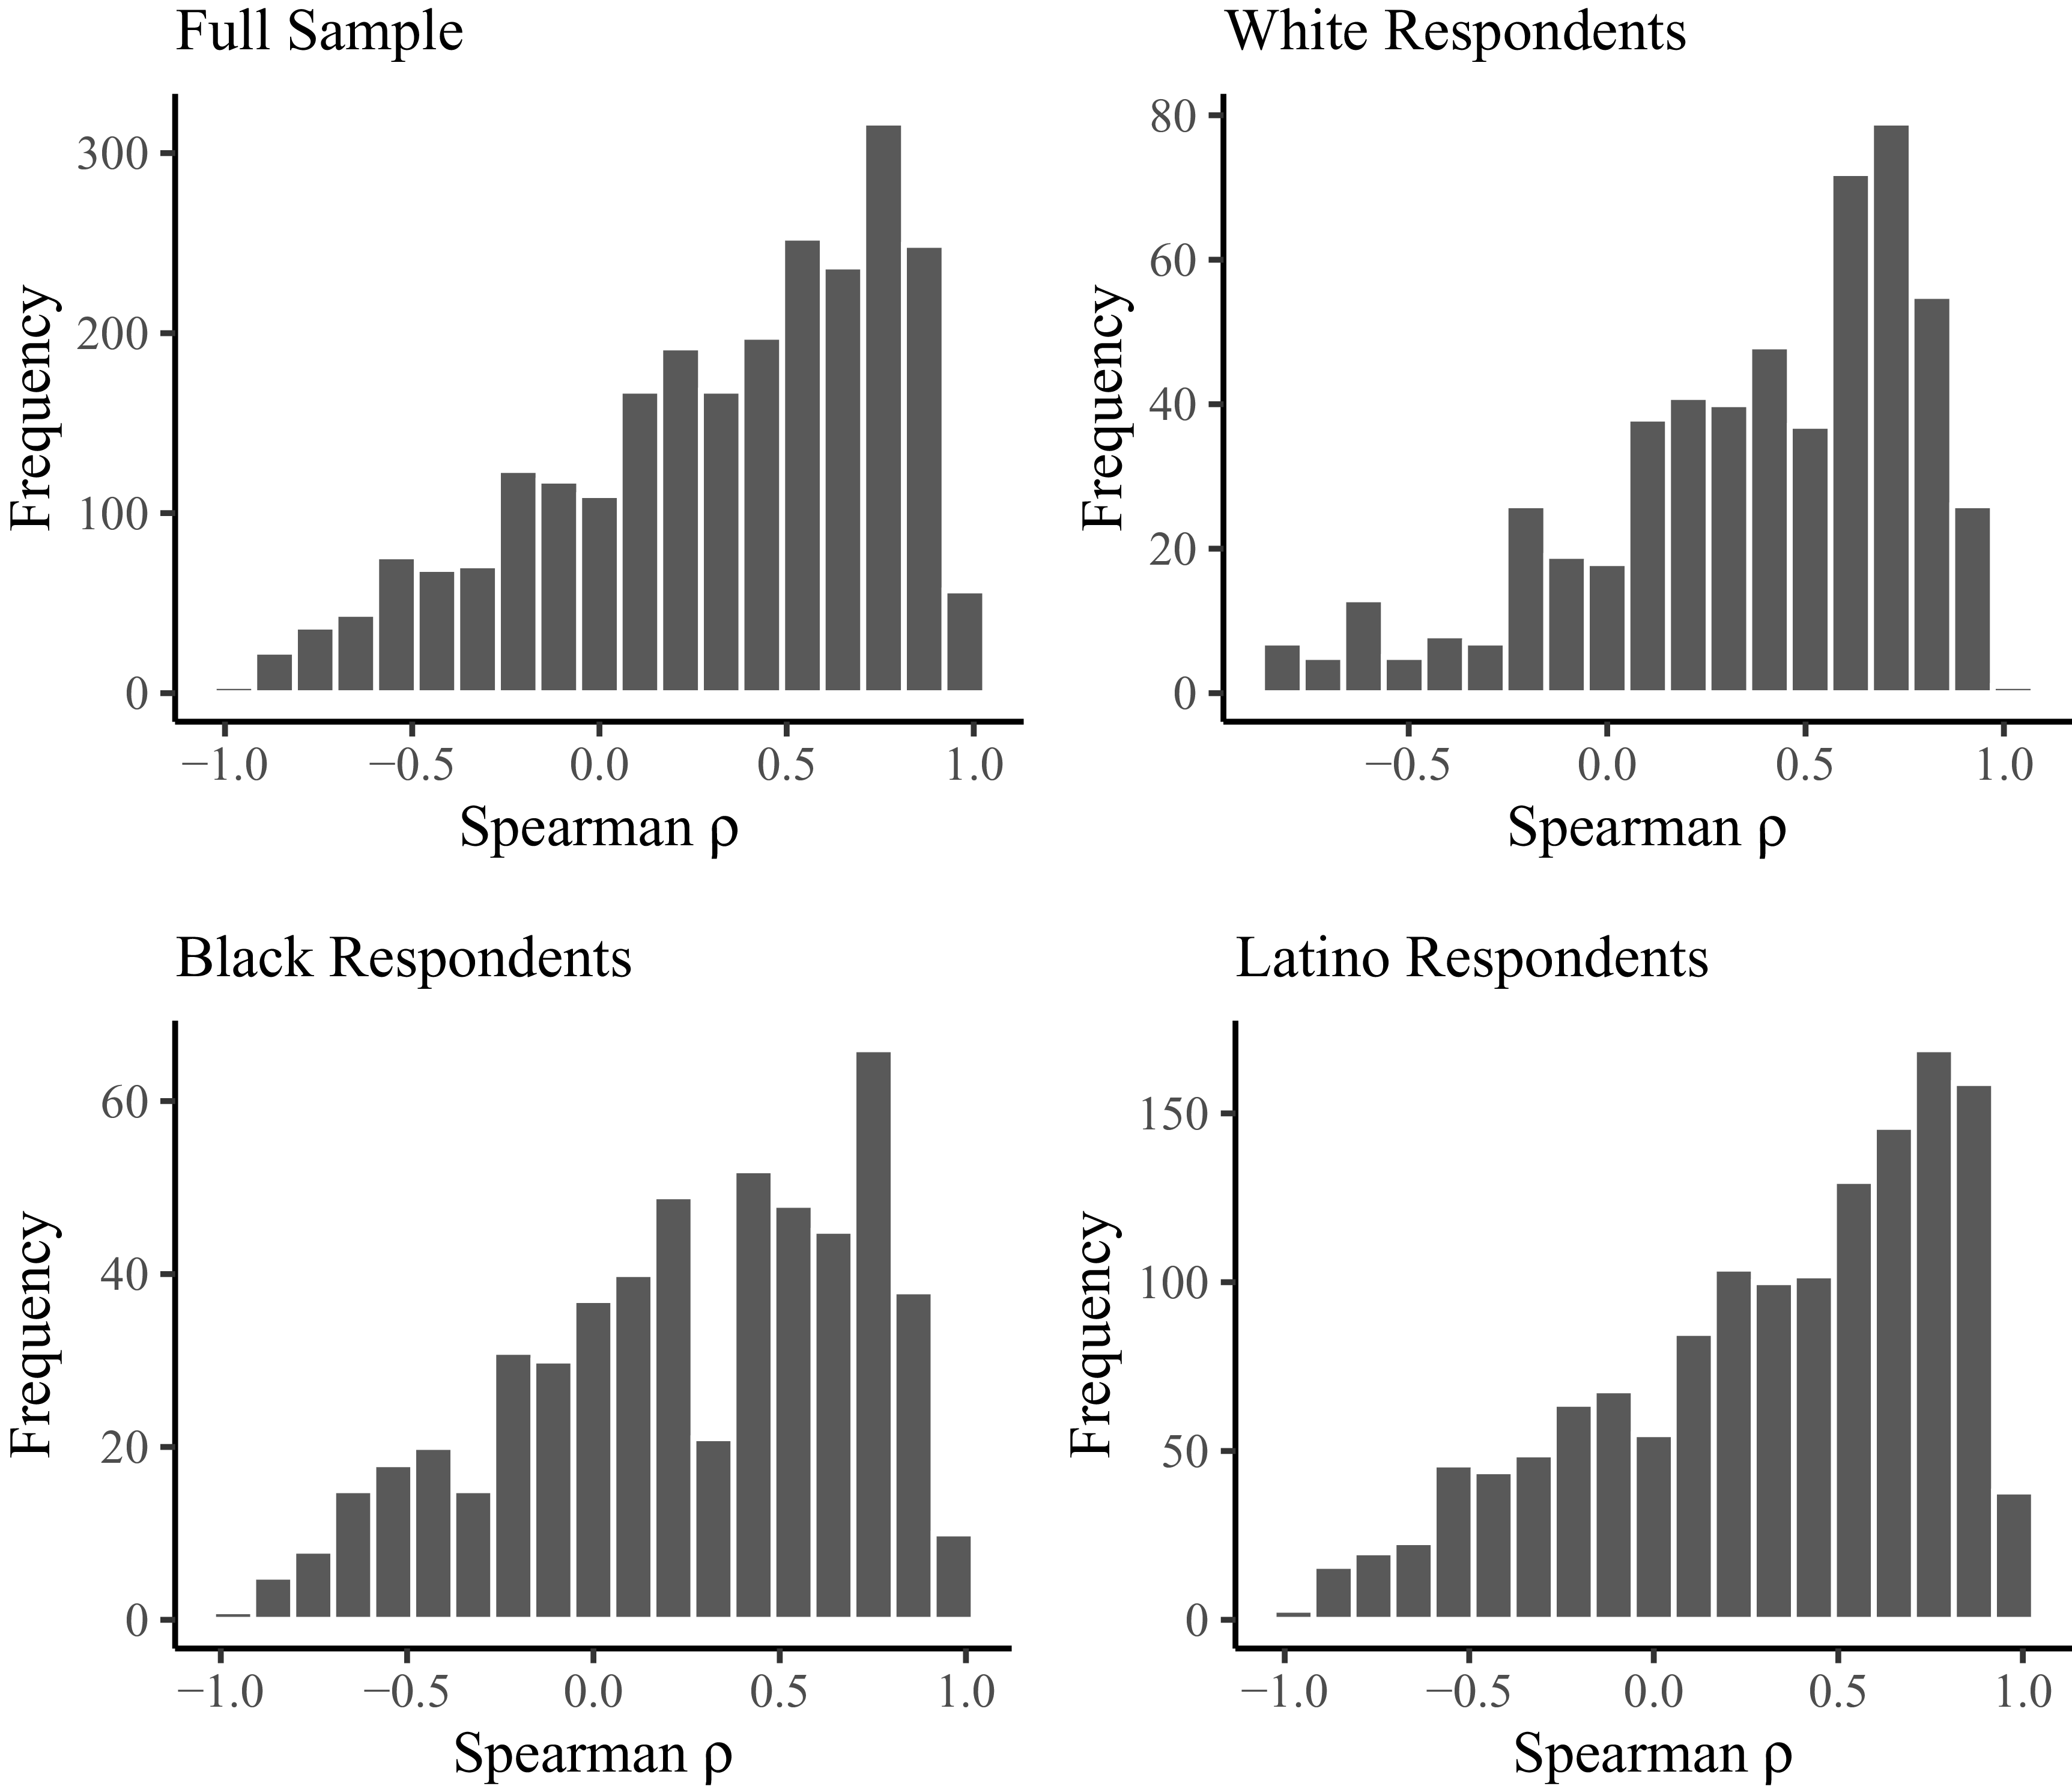
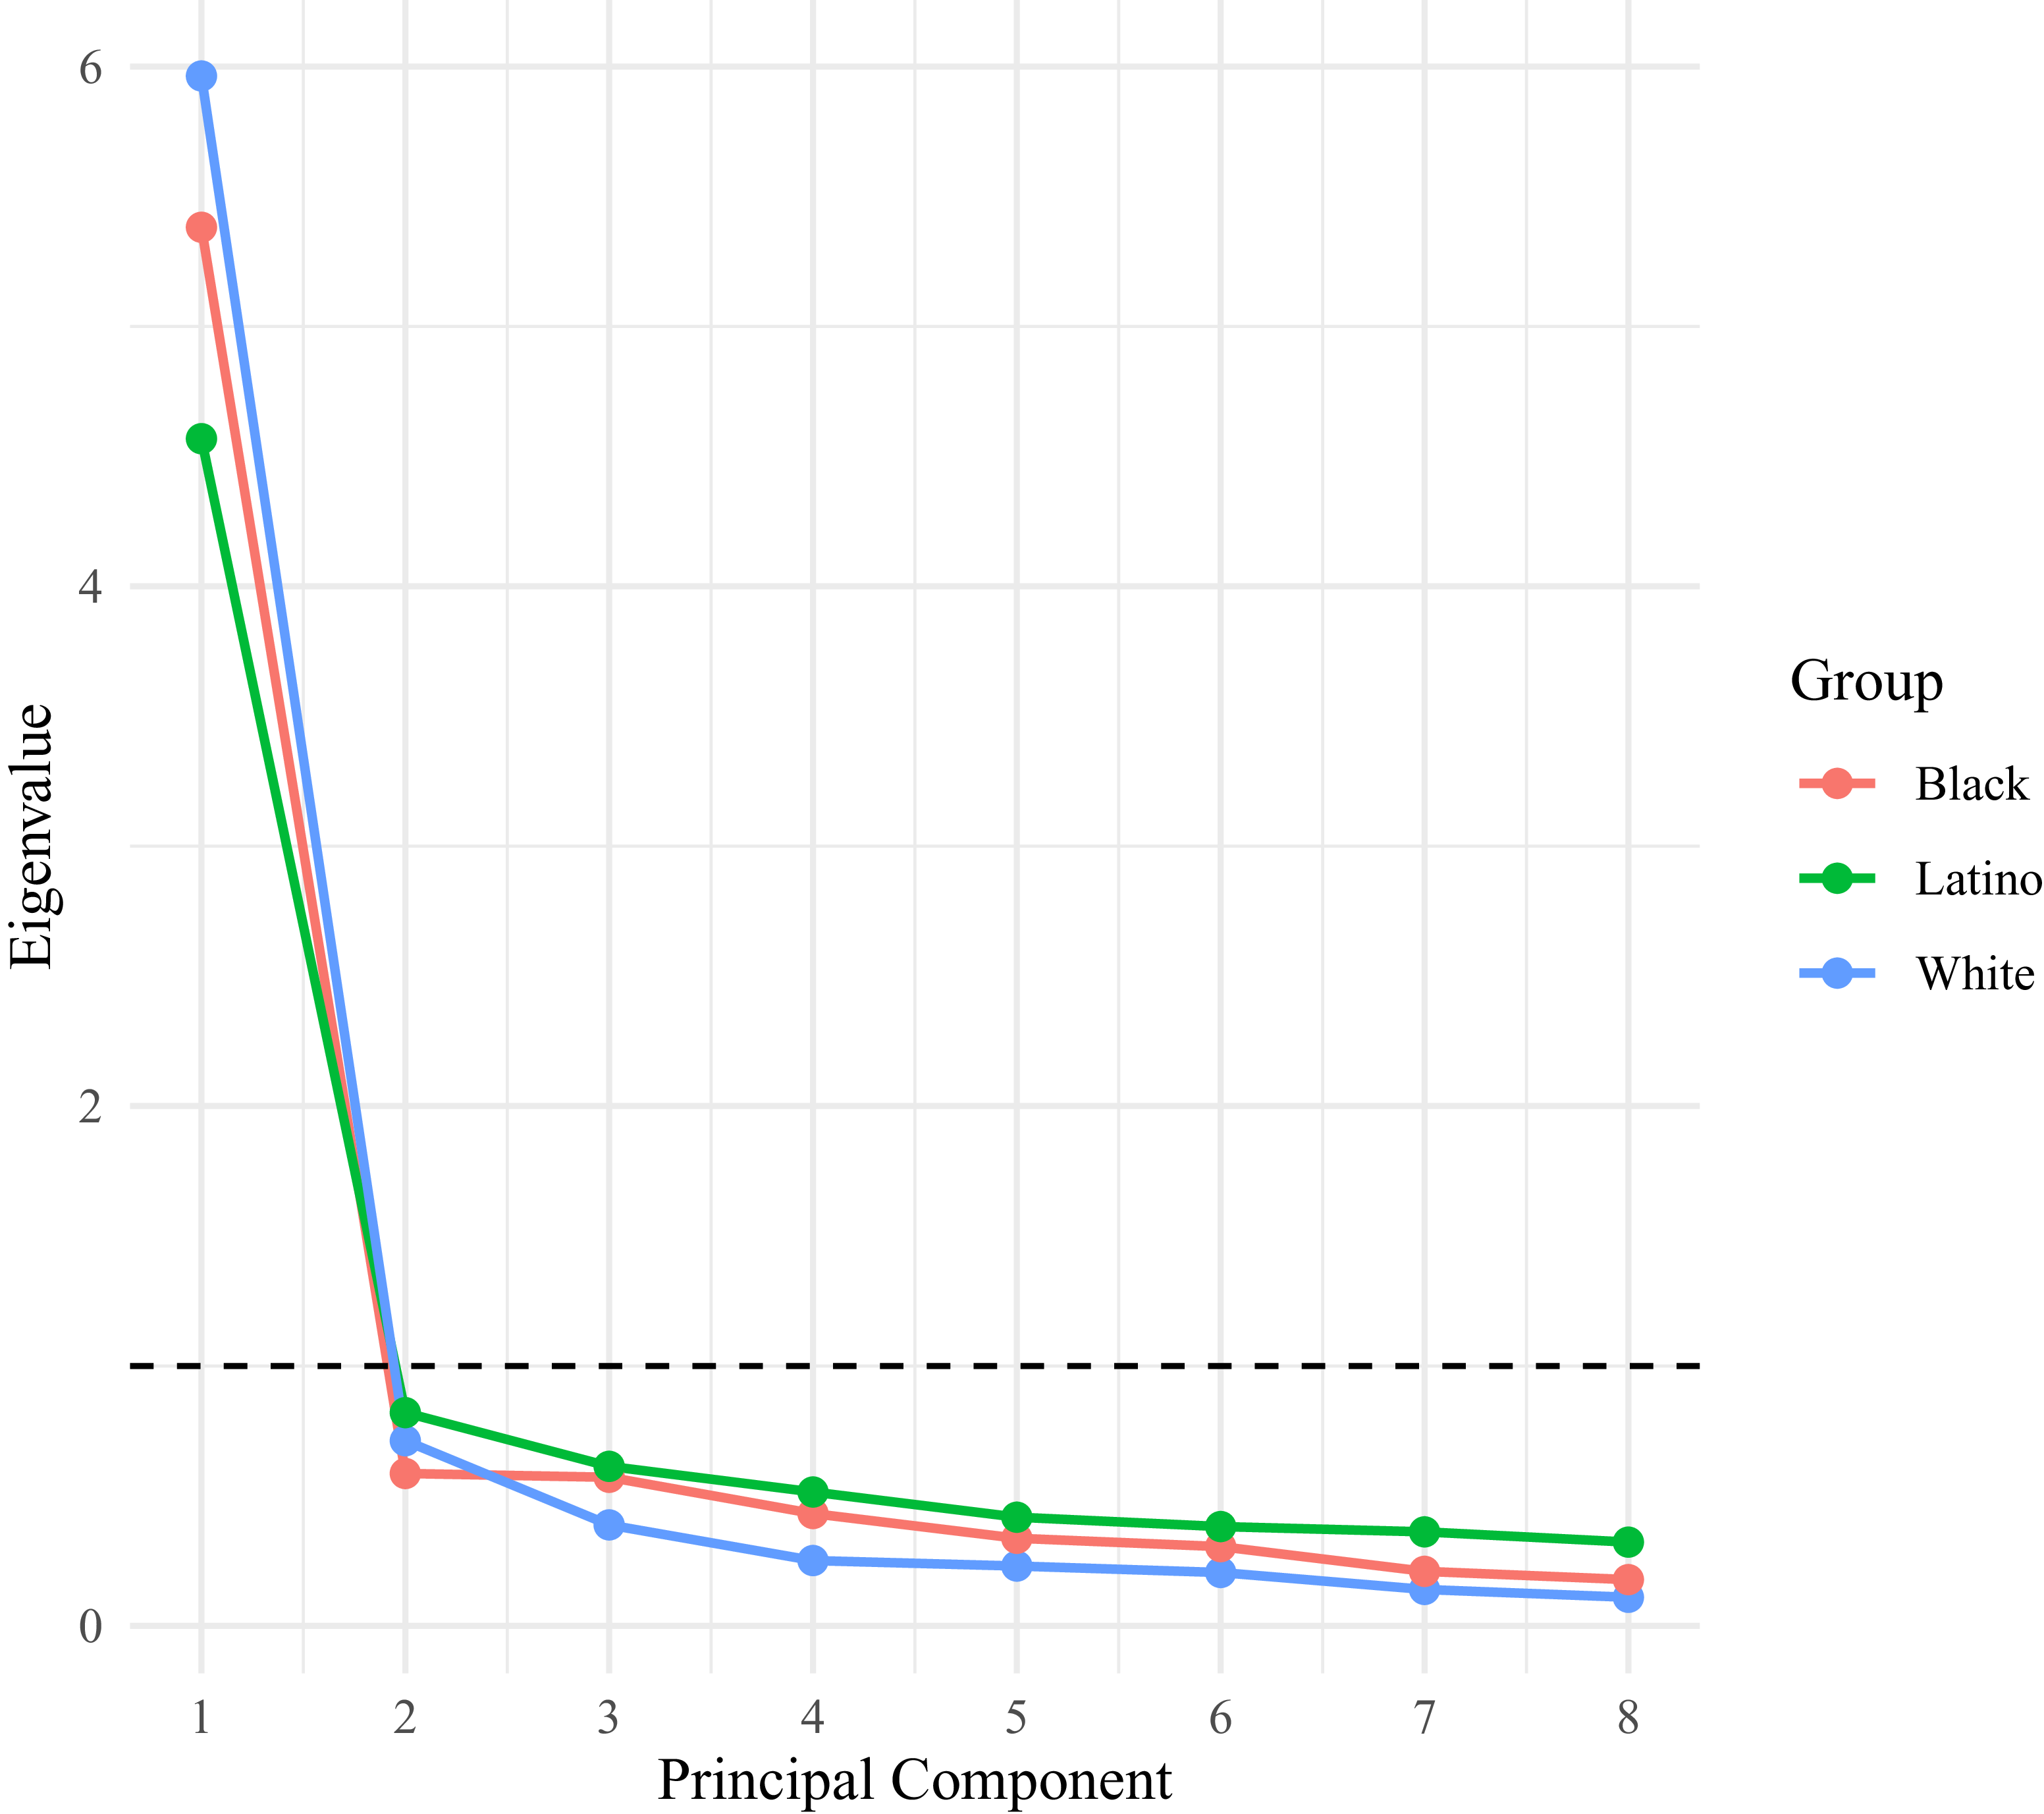
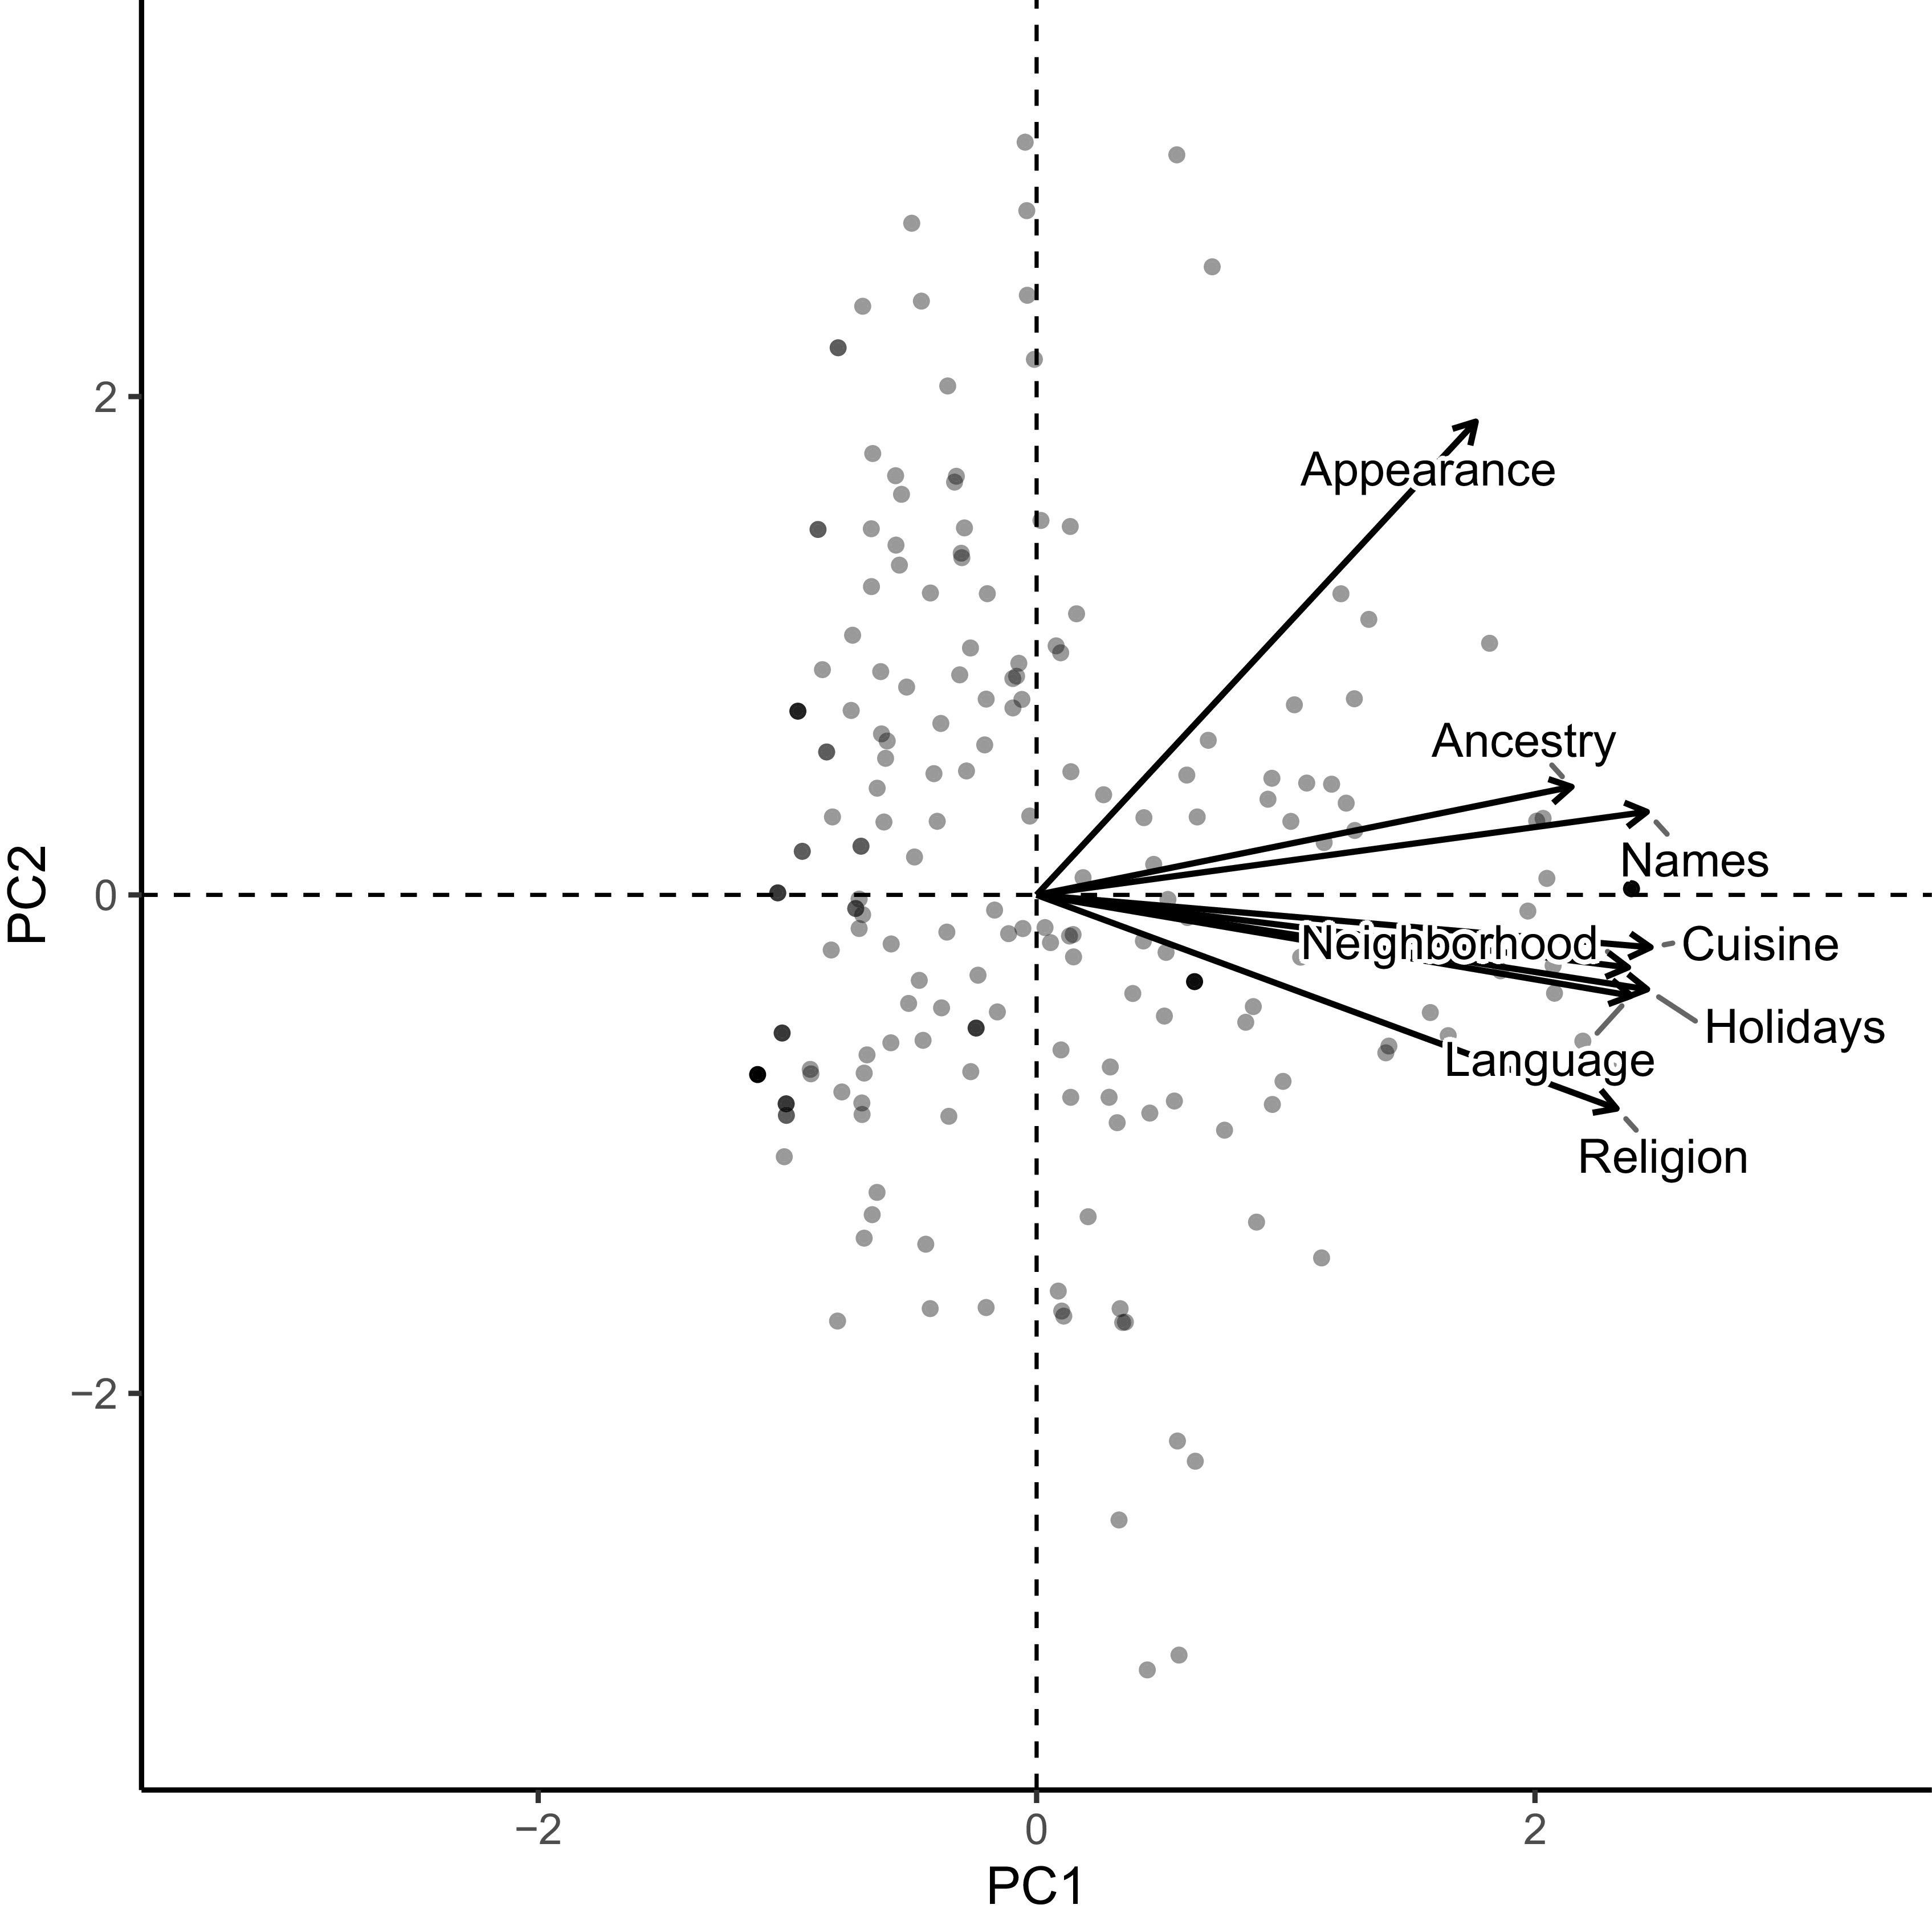
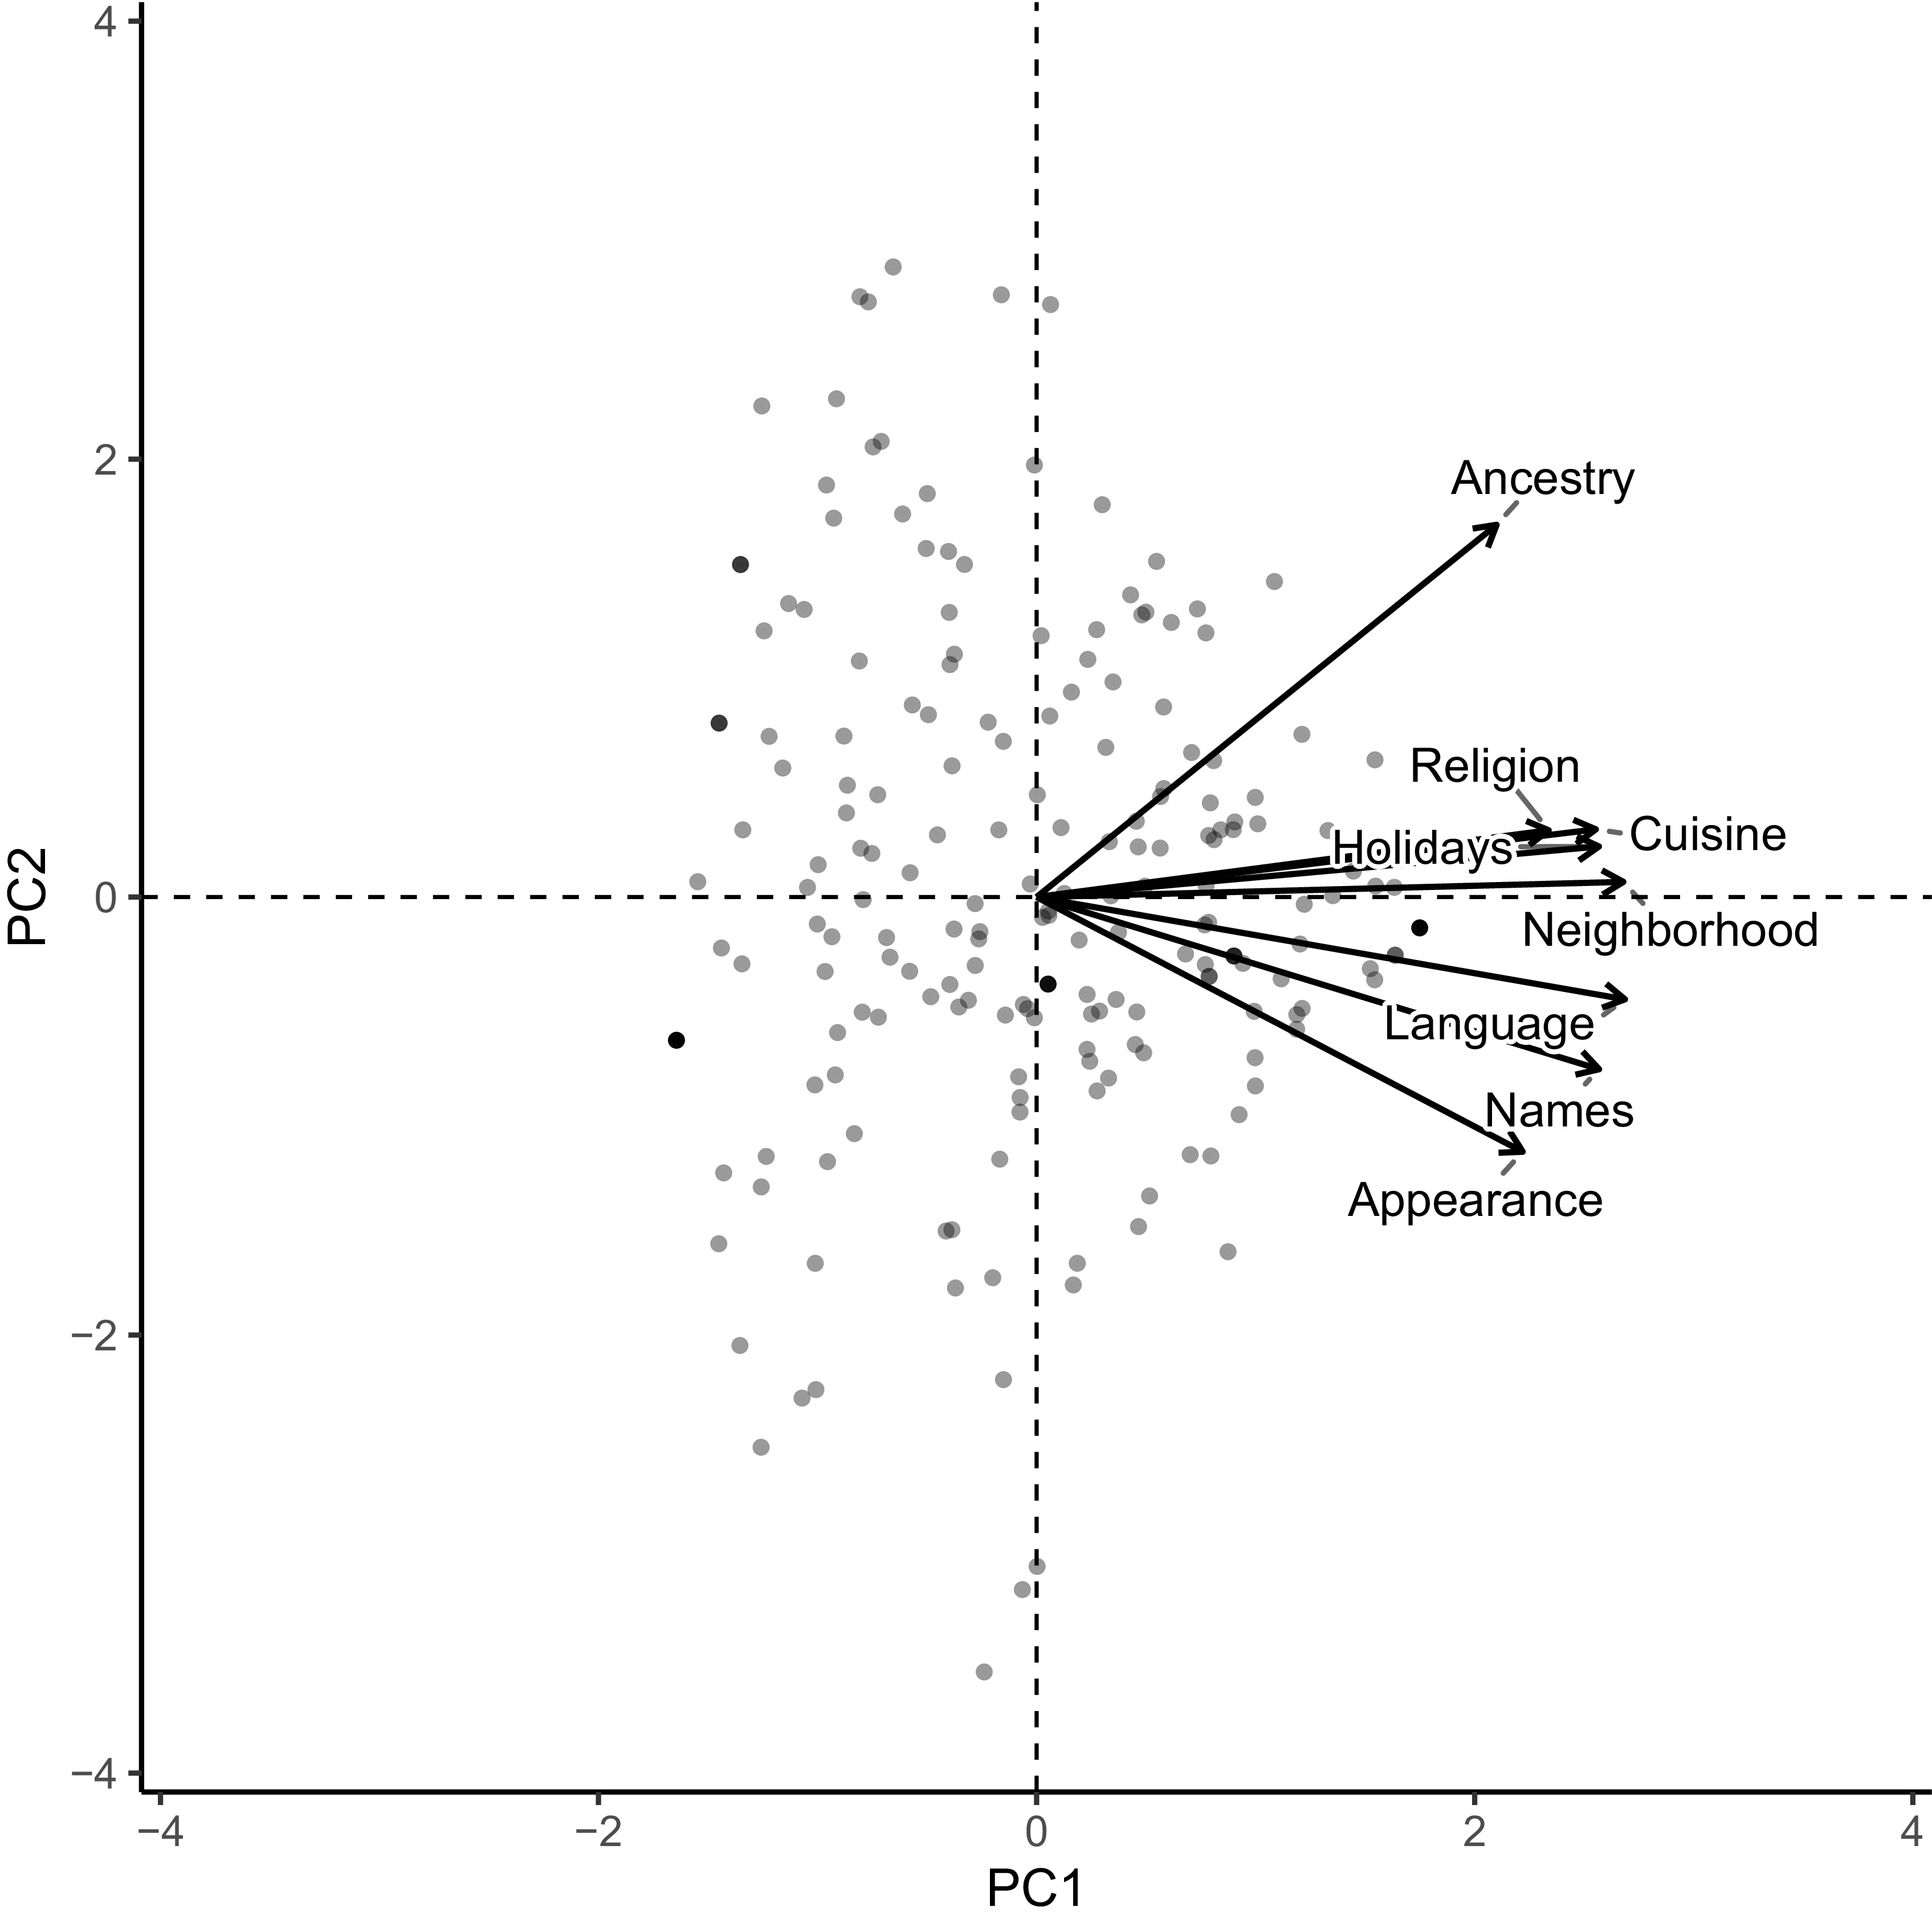
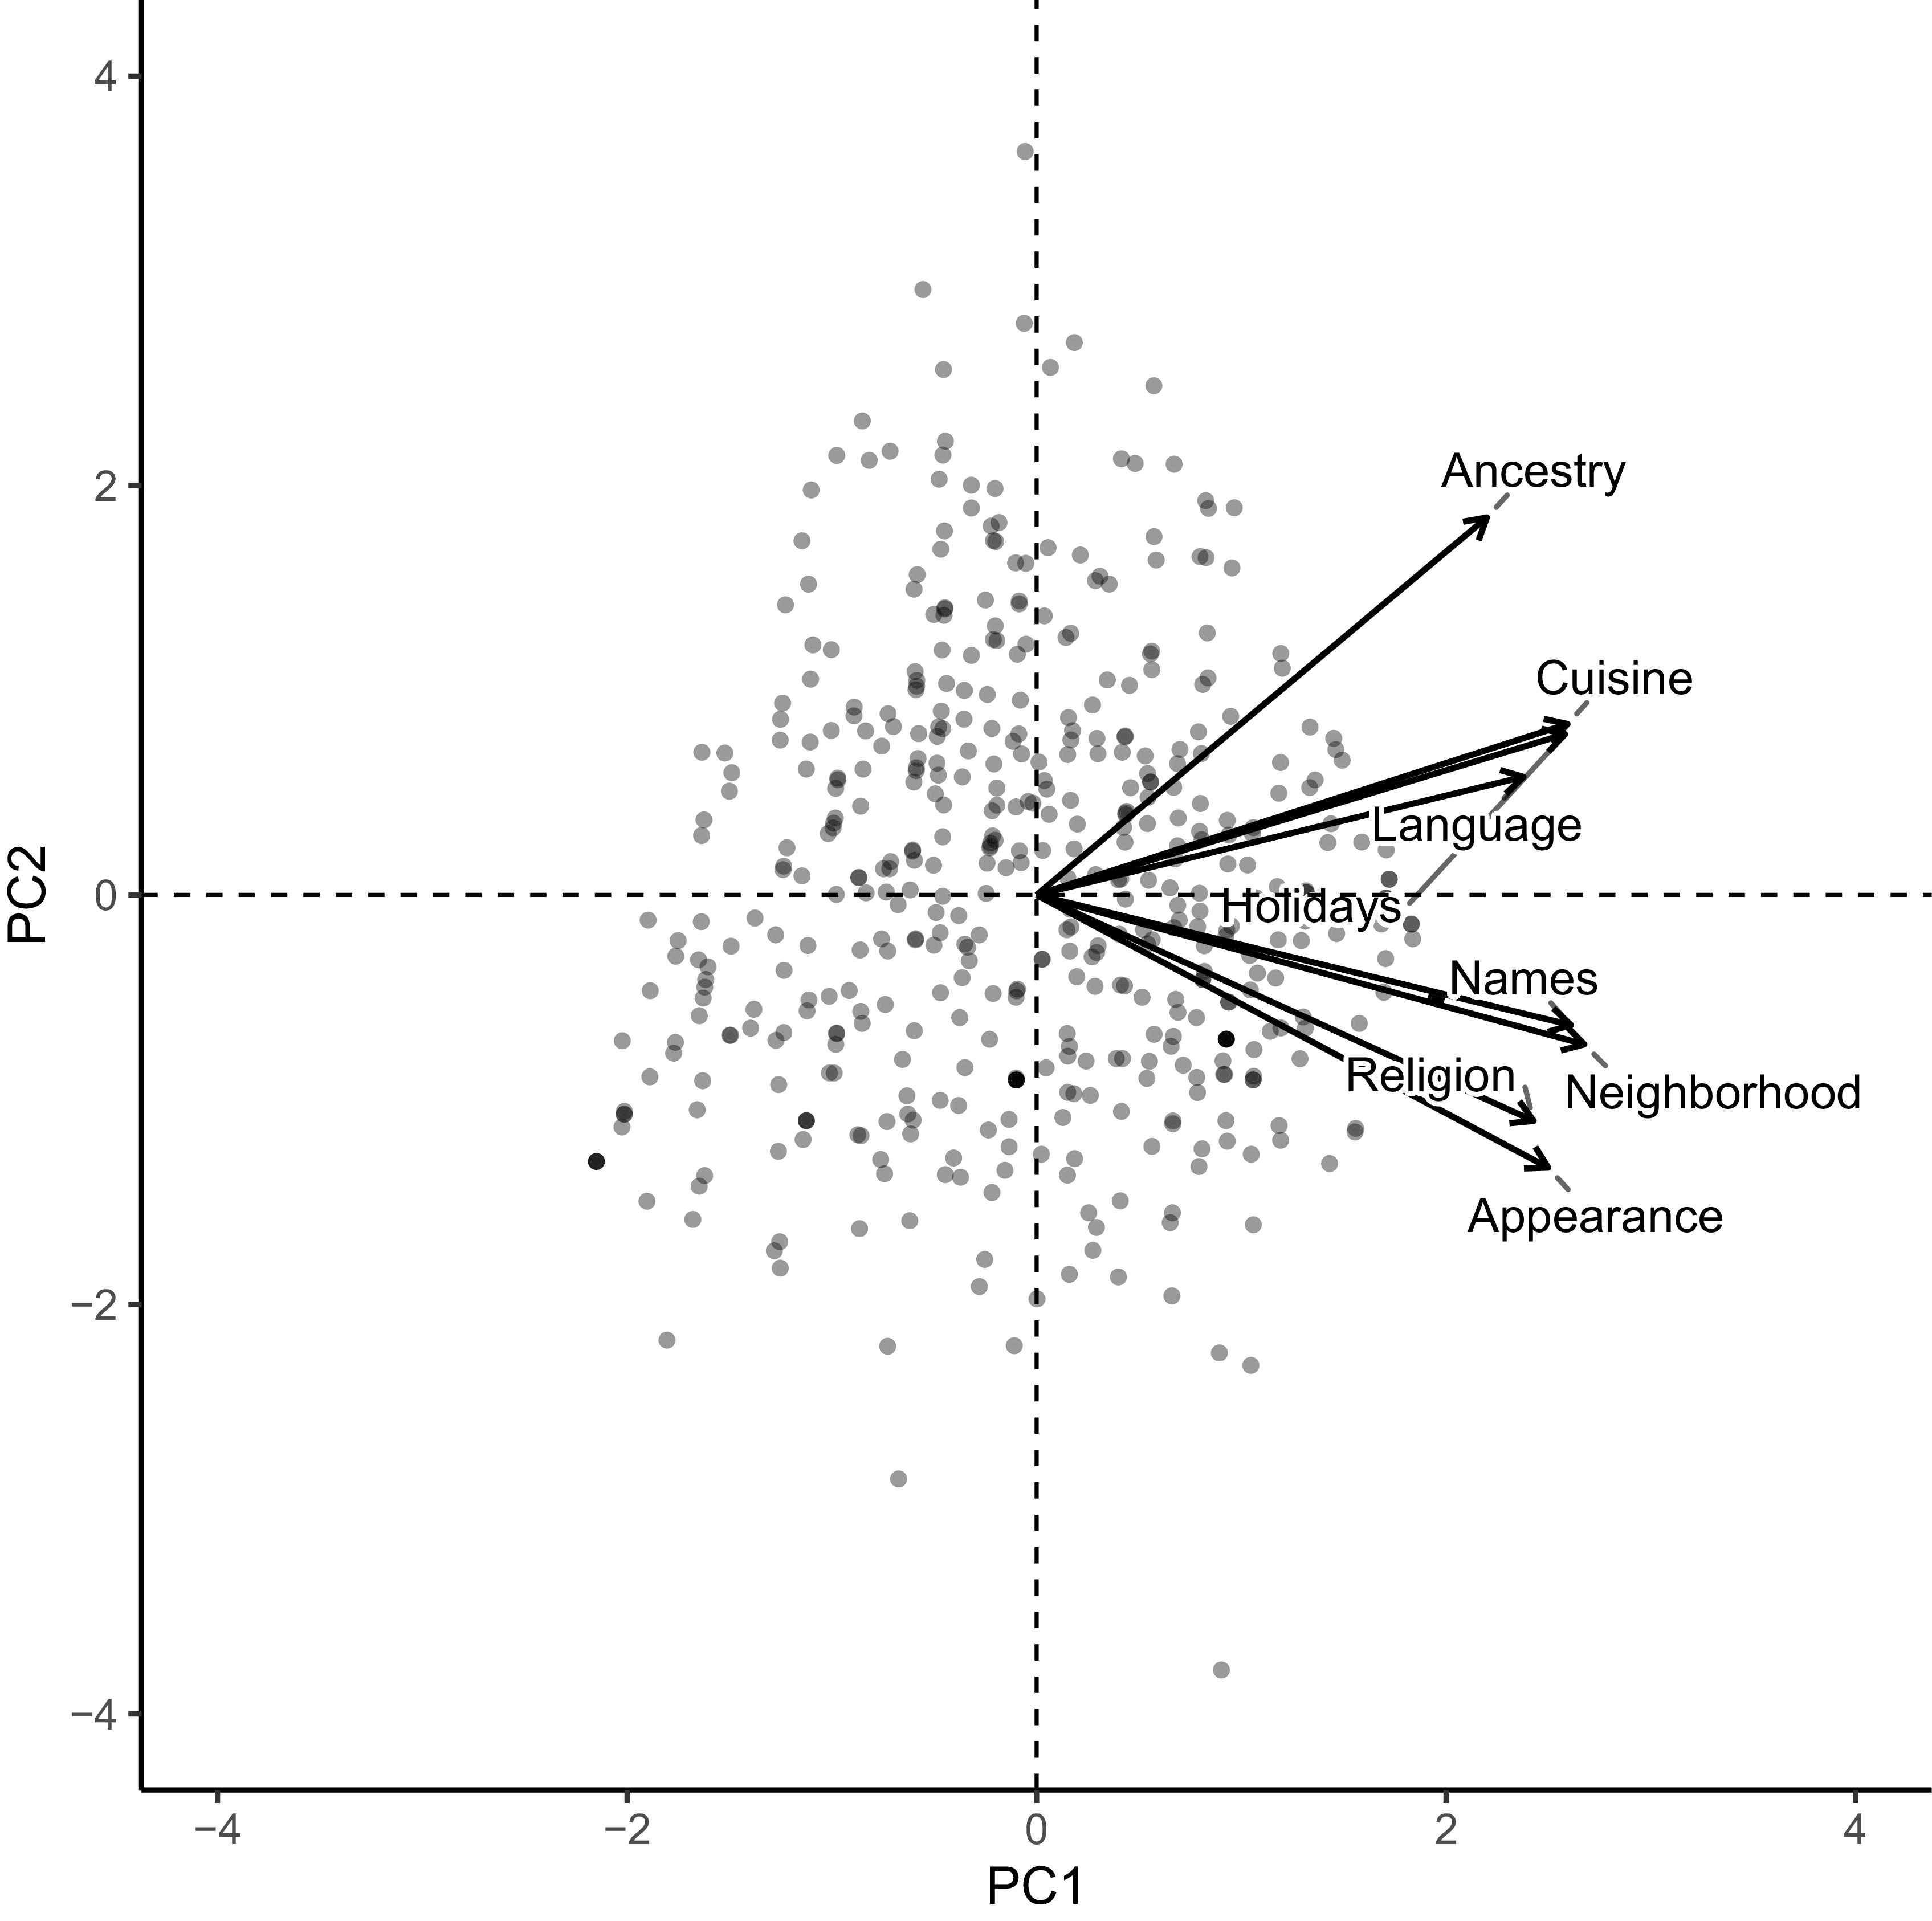
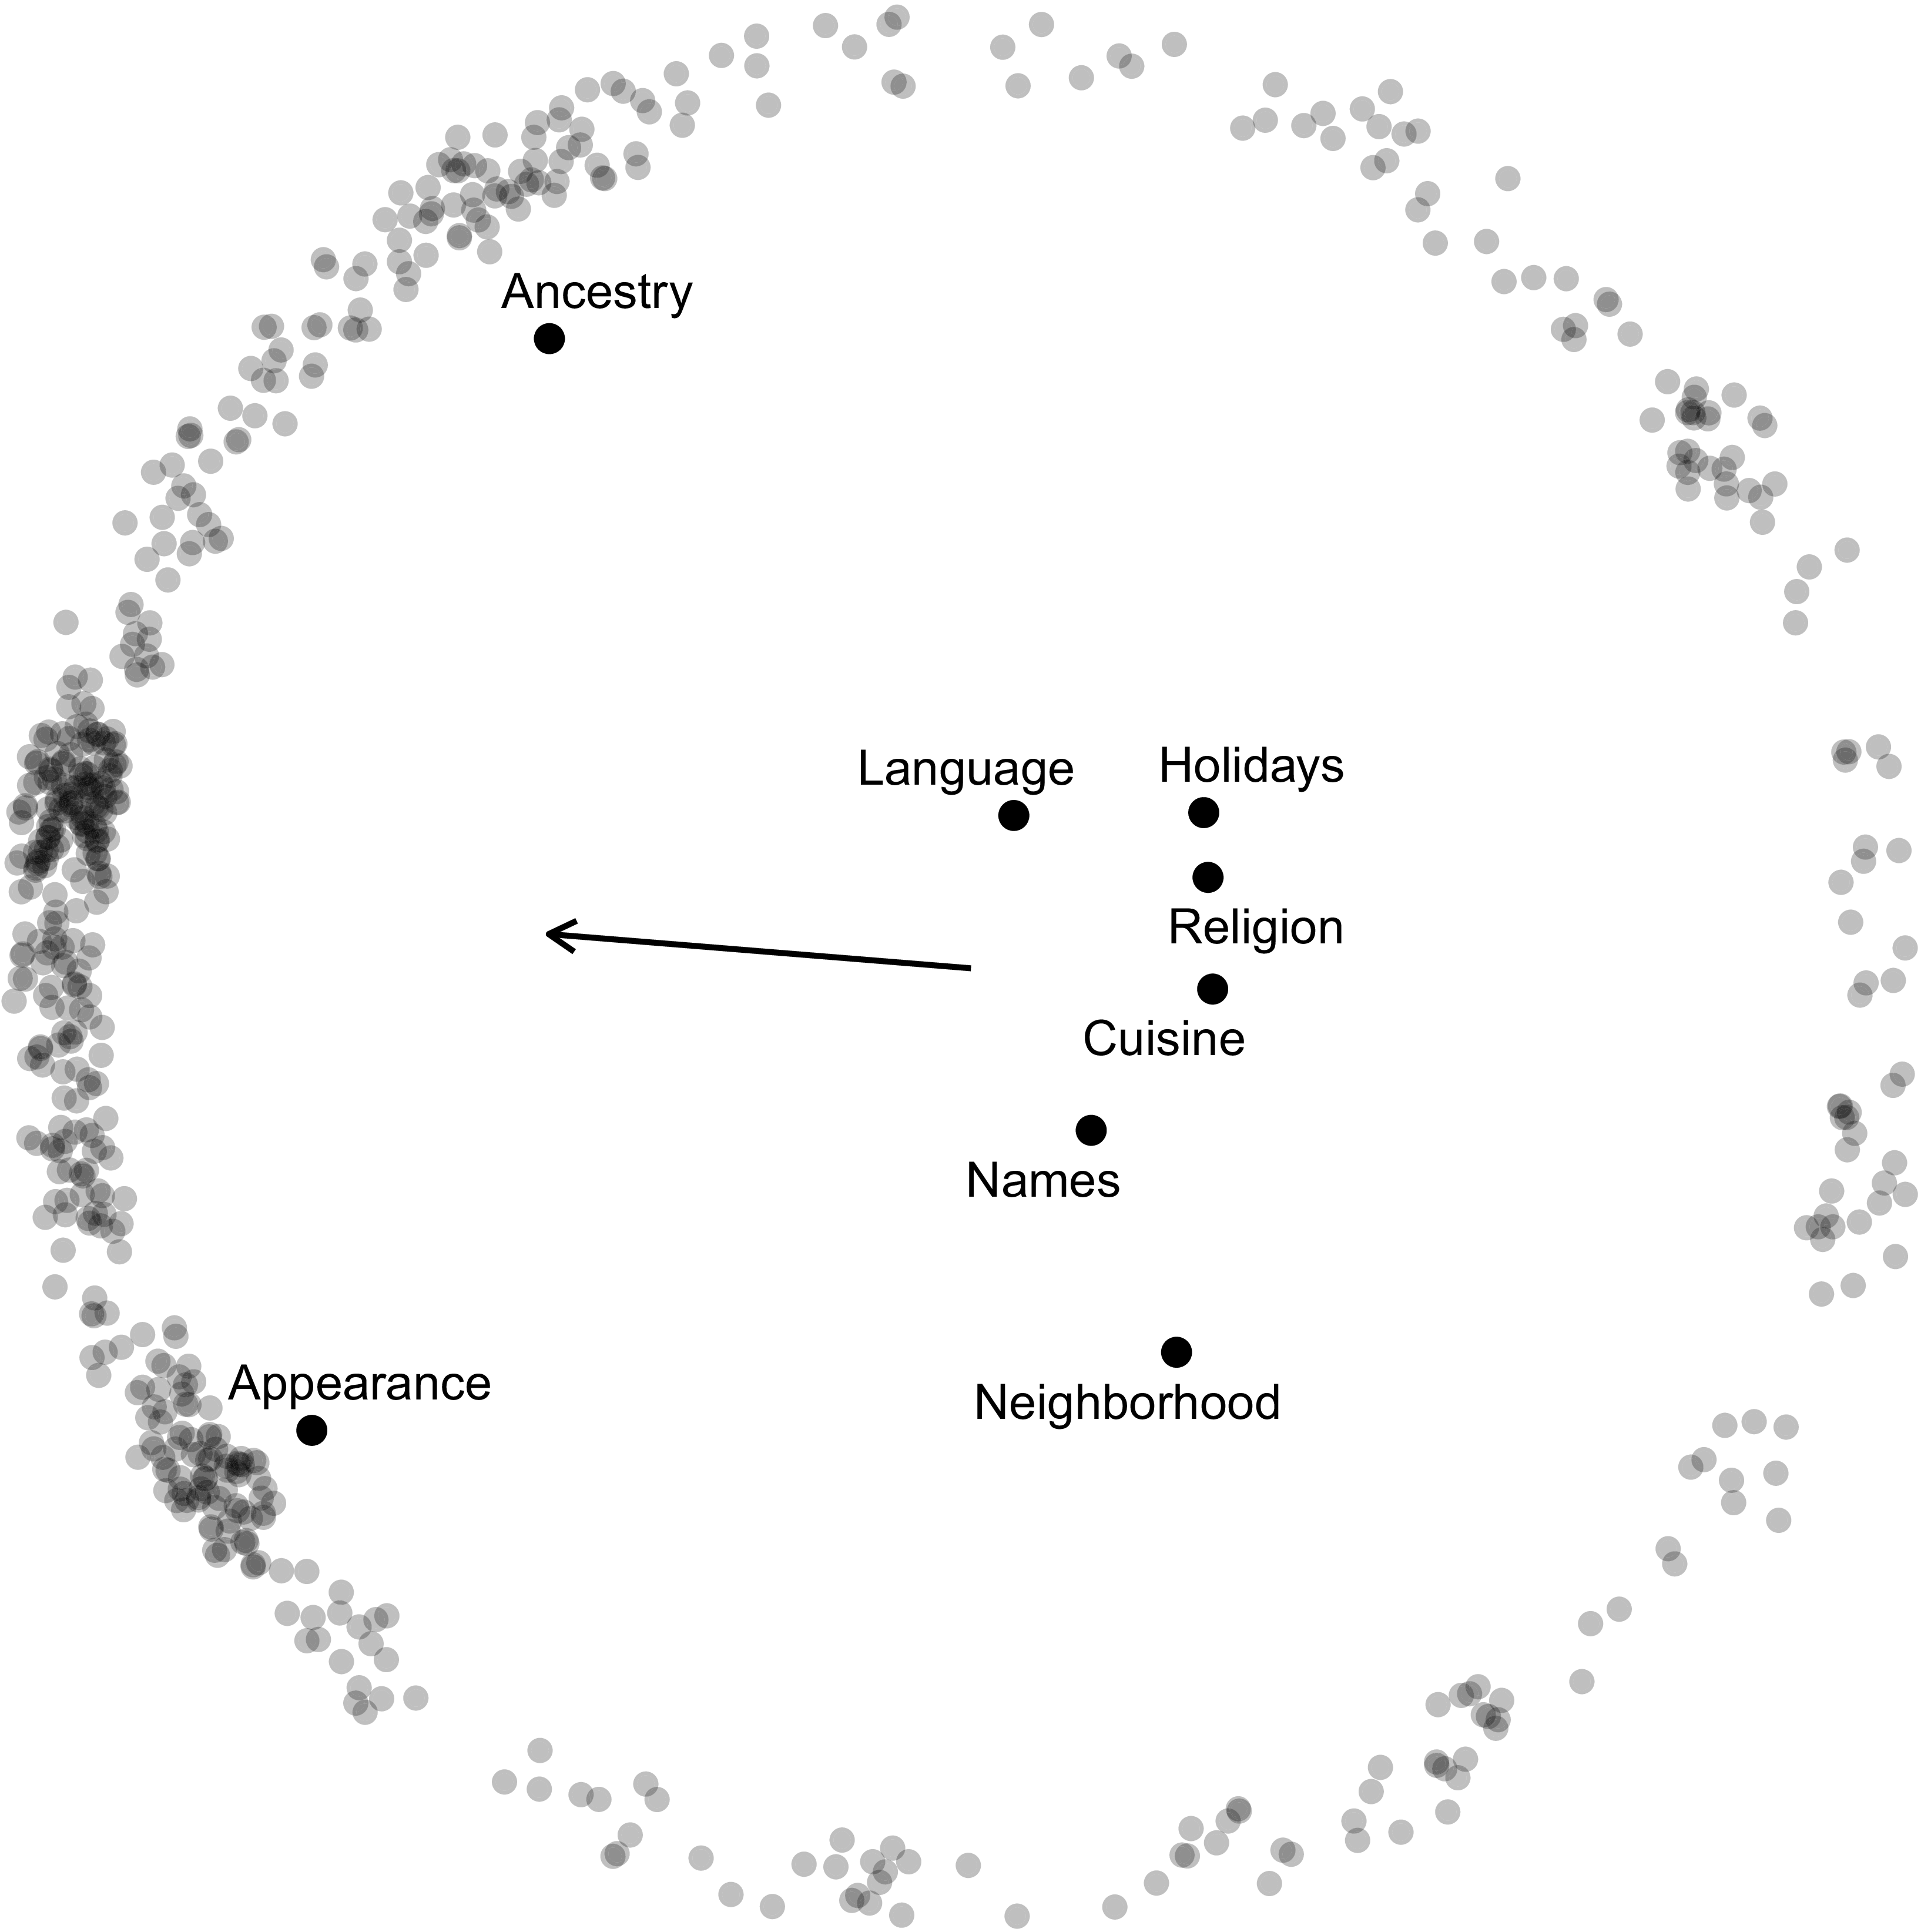
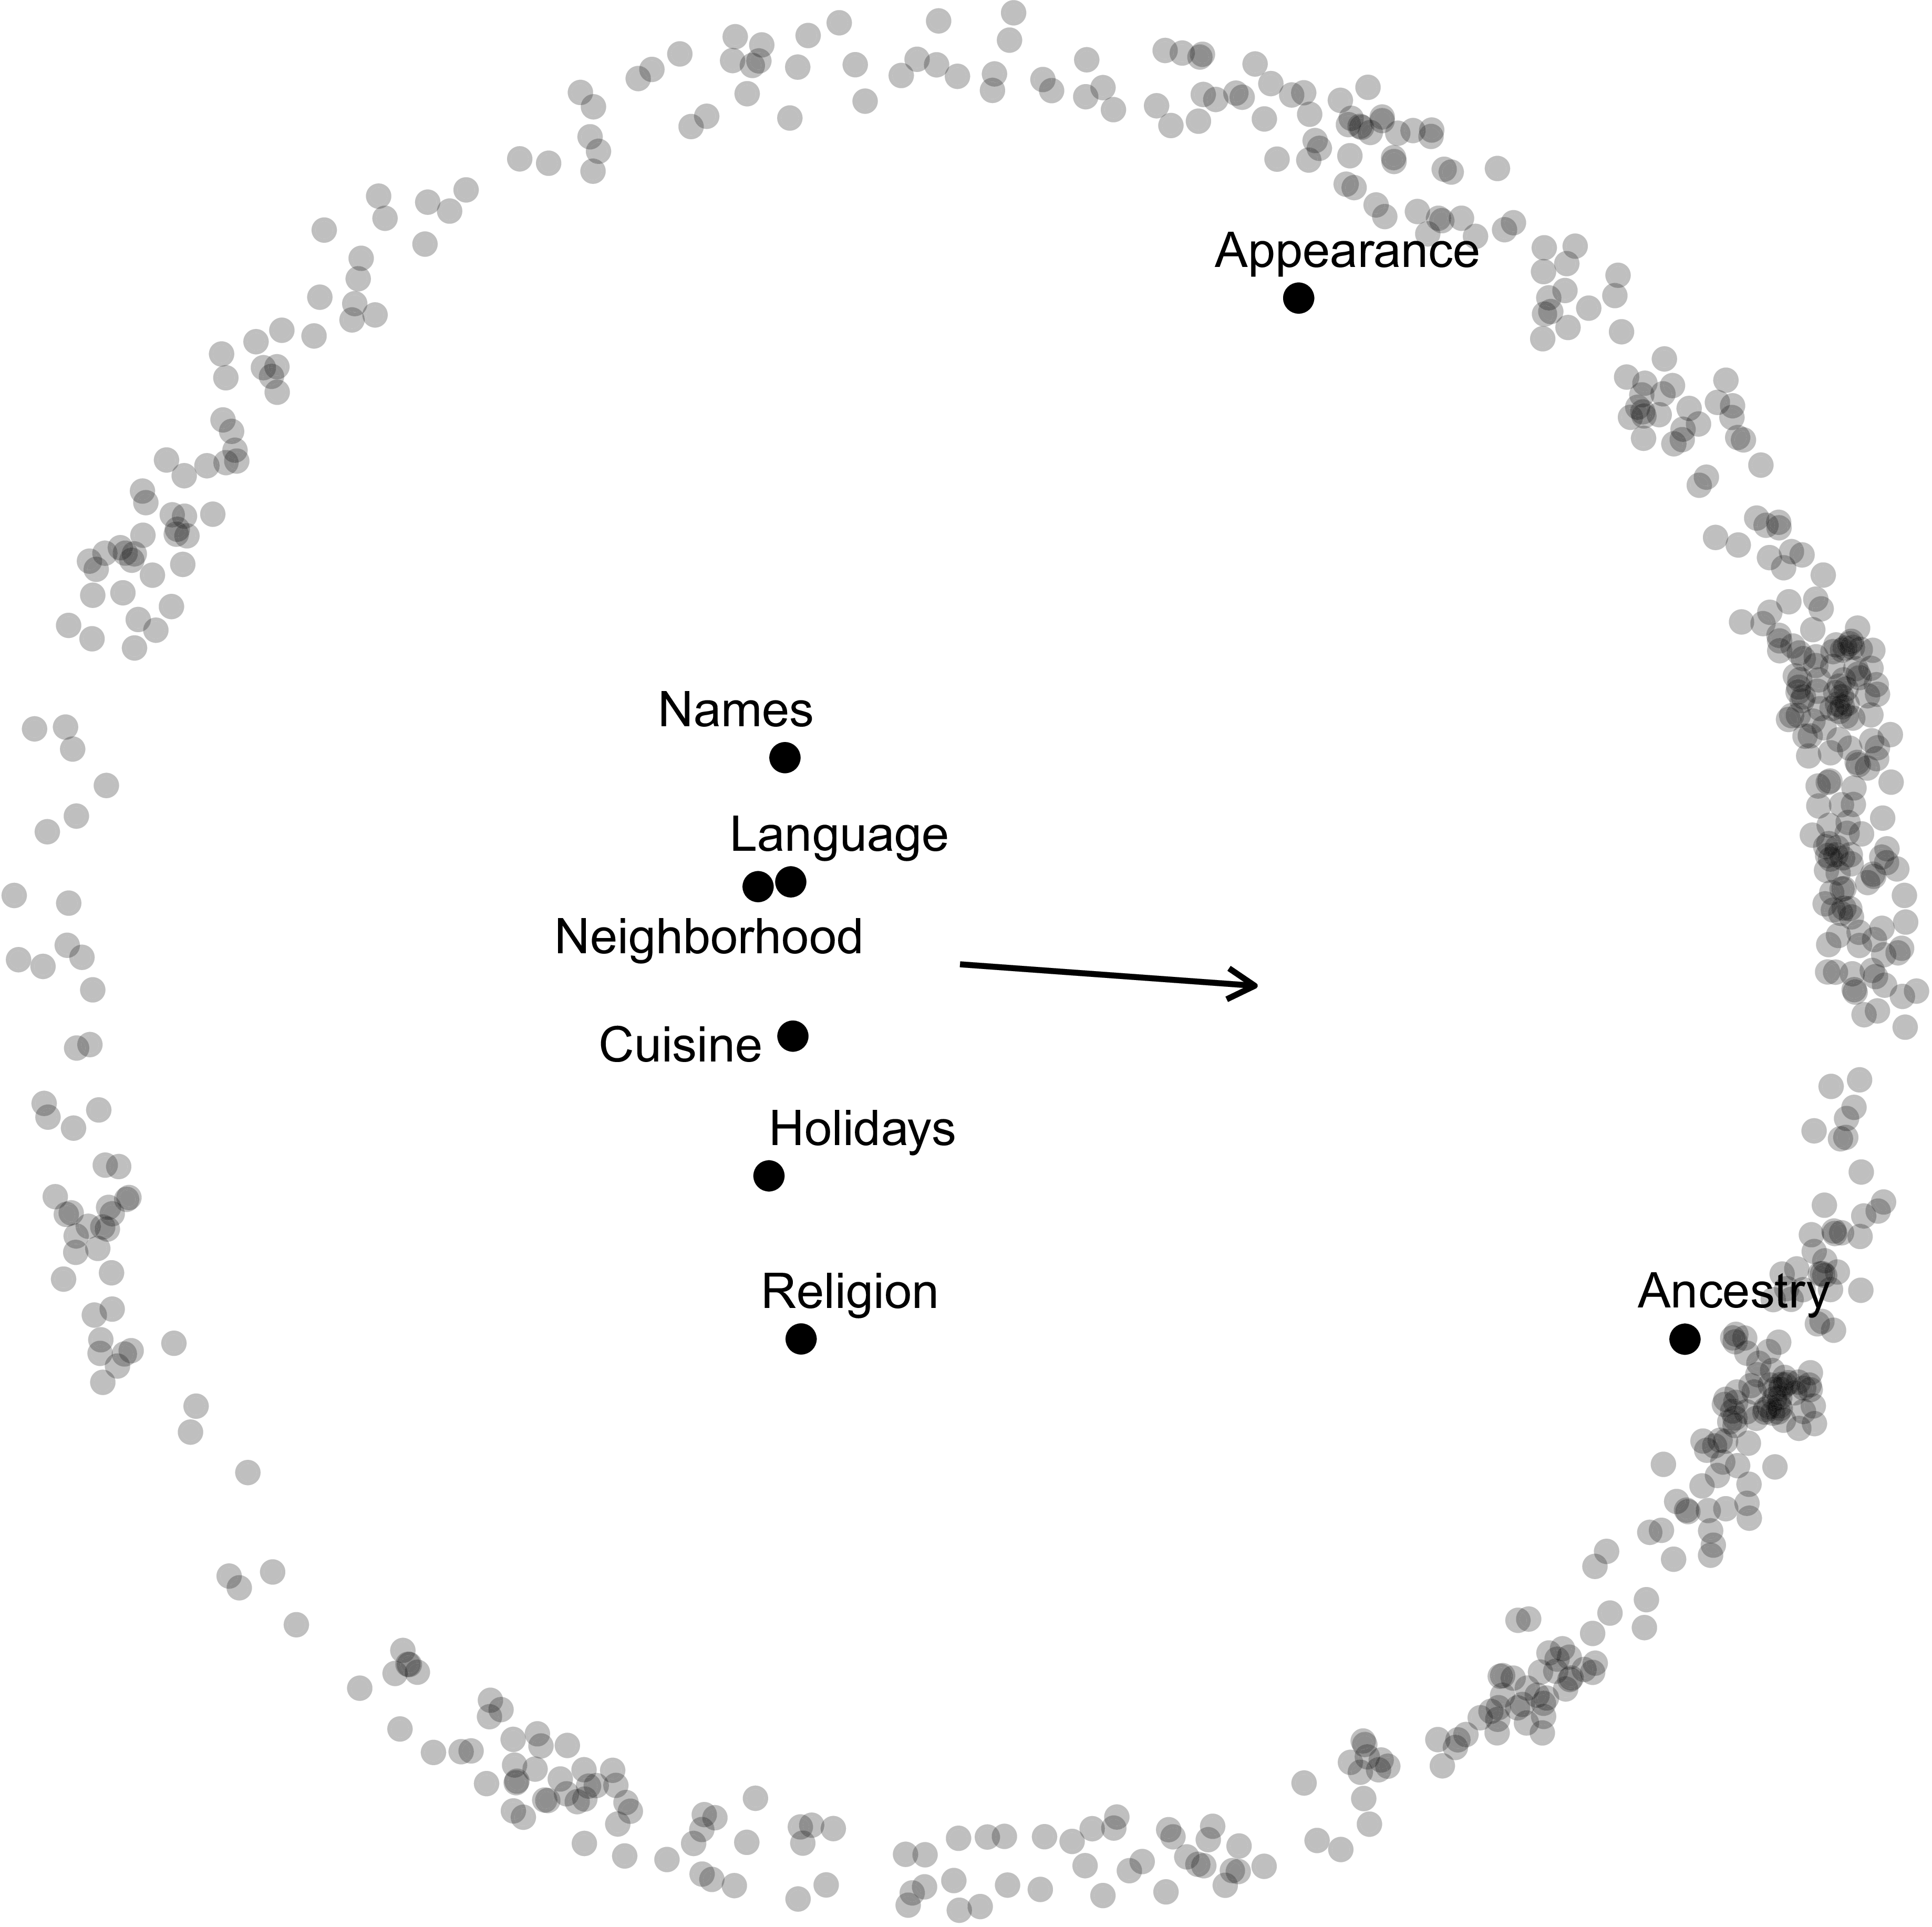
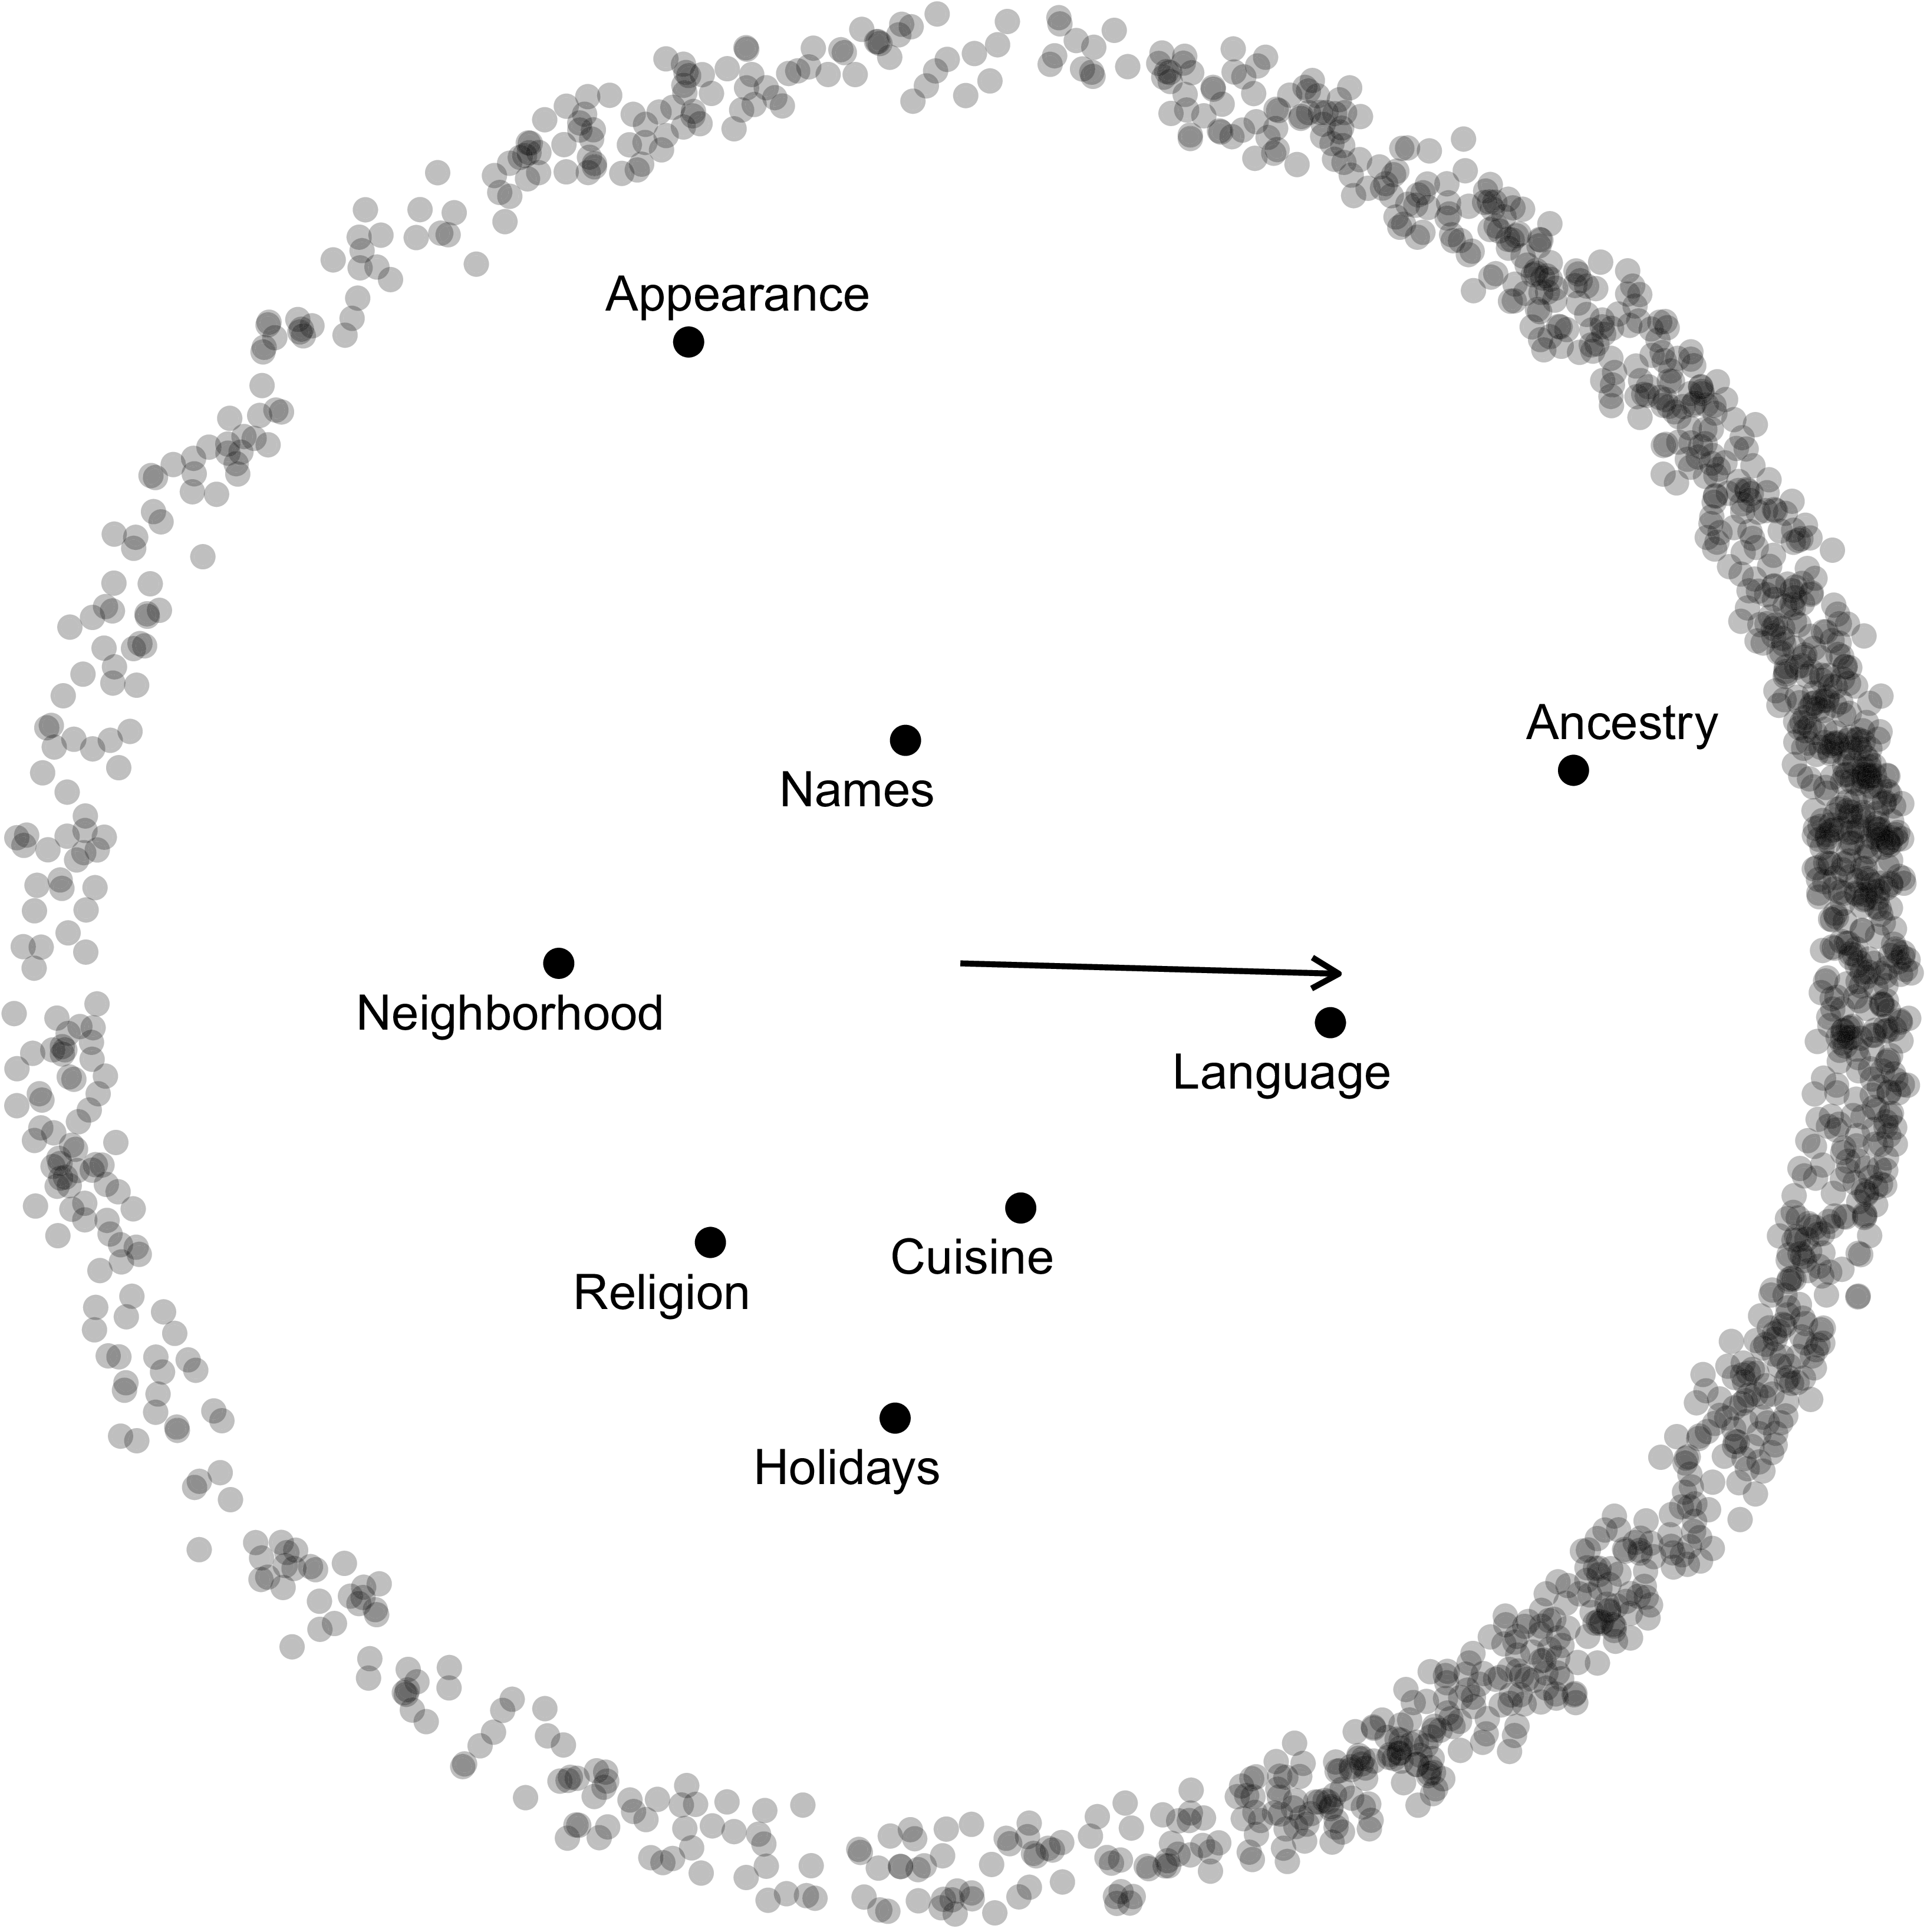
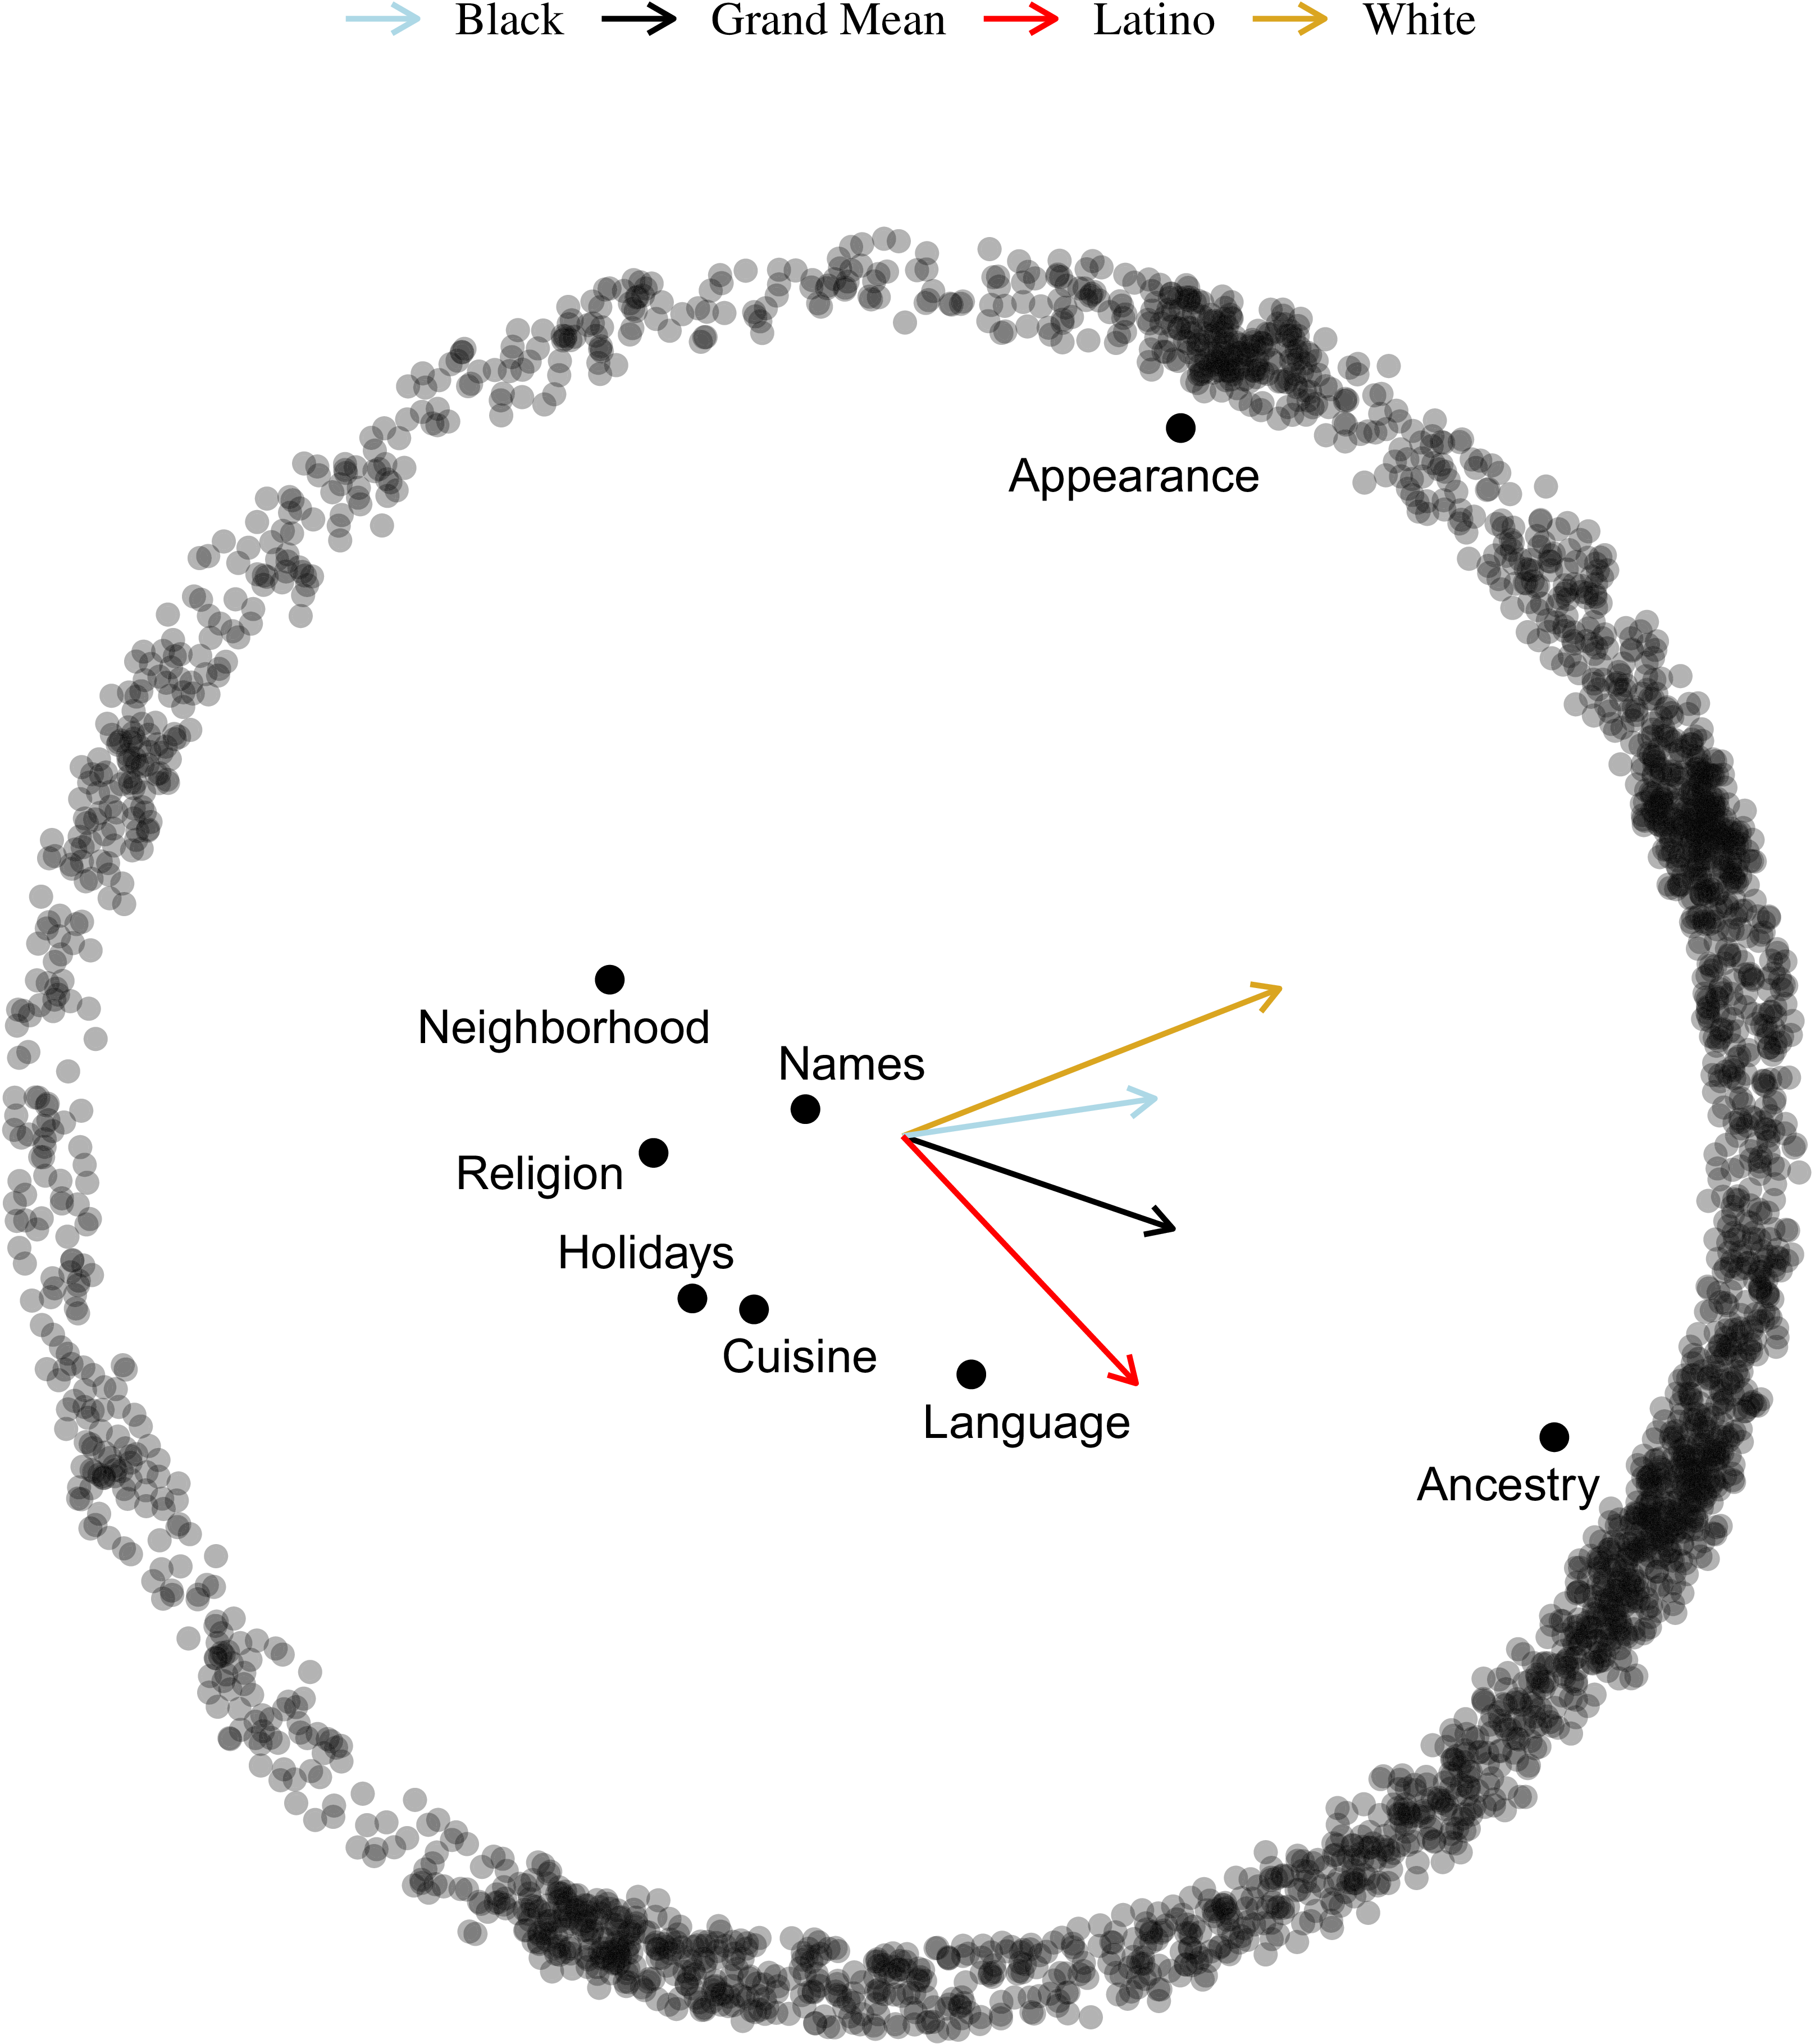
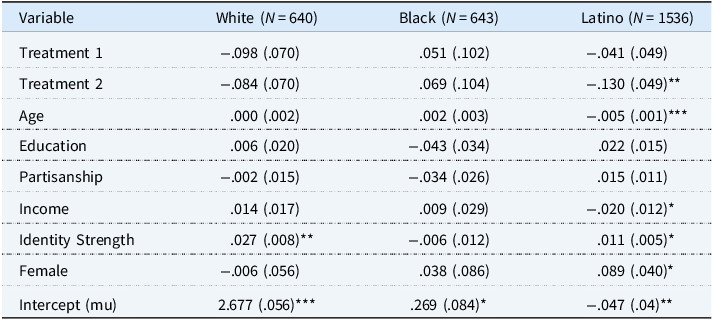
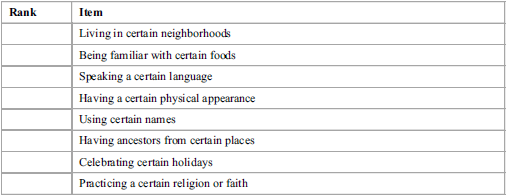
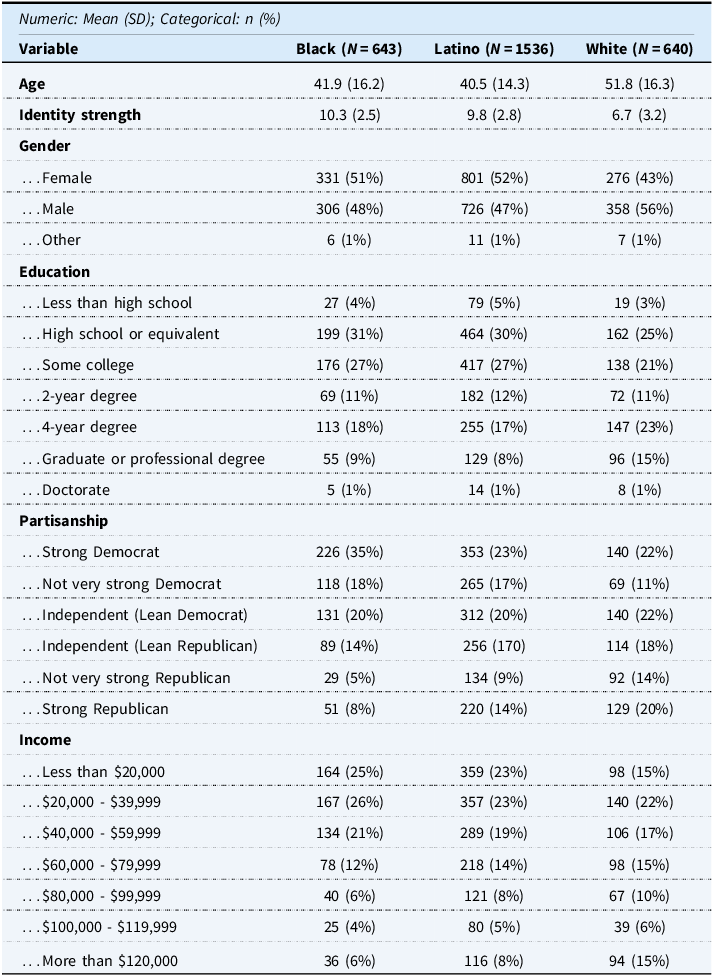
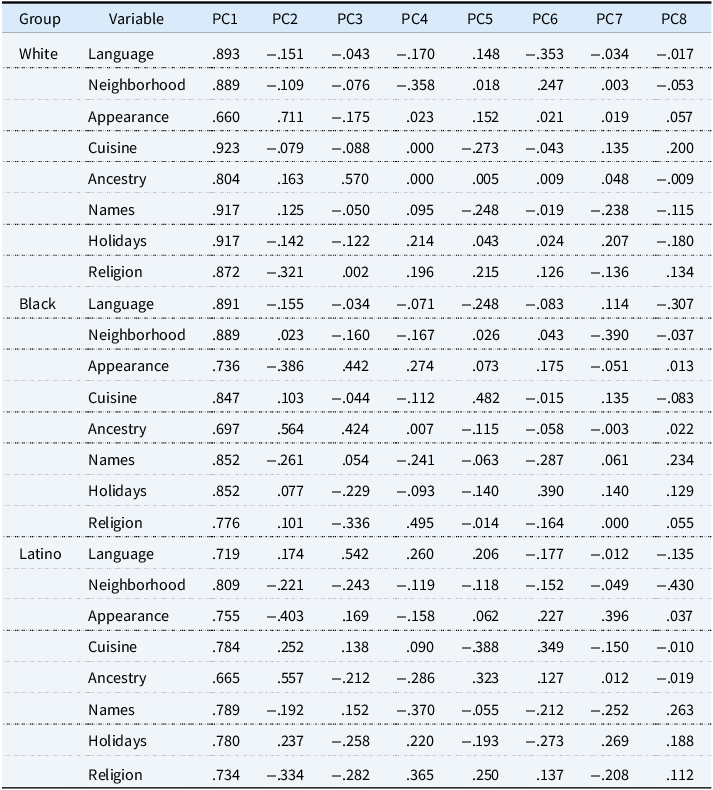

 Open access

