




No CrossRef data available.
Article contents
Interest Groups, Veto Points, and Electricity Infrastructure Deployment
Published online by Cambridge University Press: 04 January 2006
Abstract
In this article we examine the effects of interest group pressure and the structure of political institutions on infrastructure deployment by state-owned electric utilities in a panel of seventy-eight countries during the period 1970–94. We consider two factors that jointly influence the rate of infrastructure deployment: (1) the extent to which the consumer base consists of industrial consumers, which are capable of exerting discipline on political actors whose competing incentives are to construct economically inefficient “white elephants” to satisfy the demands of concentrated geographic interests, labor unions, and national engineering and construction lobbies; and (2) veto points in formal policymaking structures that constrain political actors, thereby reducing these actors' sensitivity to interest group demands. A higher fraction of industrial customers provides political actors with stronger incentives for discipline, reducing the deployment of white elephants and thus the infrastructure growth rate, ceteris paribus. Veto points reduce political actors' sensitivity to interest group demands in general and thus moderate the relationship between industrial interest group pressure and the rate of infrastructure deployment.Both authors contributed equally and list their names alphabetically on this joint work. Both authors acknowledge funding for this research from the University of California Energy Institute. Zelner acknowledges additional funding from the Lynde and Harry Bradley Foundation and the Edgar F. Kaiser Chair at the Haas School of Business, University of California, Berkeley. Henisz acknowledges additional funding from the Reginald H. Jones Center for Management Policy, Strategy, and Organization at the Wharton School, University of Pennsylvania. Thanks to Severin Borenstein, Rachel Croson, José de la Torre, Alexander Dyck, Tom Gilligan, Florencio Lopez-de-Silanes, Edward Mansfield, Mathew McCubbins, Will Mitchell, David Mowery, Jeffrey Nugent, Dennis Quinn, George Tsebelis, Joel Waldfogel, Oliver Williamson, and Jan Zabojnik for their comments on previous drafts. Any errors are the responsibility of the authors.
Information
- Type
- RESEARCH NOTES
- Information
- Copyright
- © 2006 The IO Foundation and Cambridge University Press
In this article we investigate empirically the joint effects of interest group pressure and the veto points in a country's formal political institutions on state-owned electric utilities' infrastructure deployment rates. It is widely accepted that state-owned enterprises (SOEs) invest inefficiently relative to their private-sector counterparts.1
See, for example, Megginson and Netter 2001.
See, for example, Bertero and Rondi 2000; Garrett and Lange 1995; Karp and Perloff 1995; Shleifer and Vishny 1994; Willig 1994.
See, for example, Boycko, Shleifer, and Vishny 1996; Peltzman 1989.
We examine how two elements of the political setting influence the extent to which political actors use SOEs to deliver targeted benefits: the political influence of industrial consumers of electricity, who bear the costs of white elephants without enjoying commensurate gains and who can overcome collective action problems more easily than nonindustrial consumers can; and the extent to which veto points in a nation's formal political institutions raise the costs of policymaking, thereby moderating political actors' sensitivity to interest group demands. Our analysis thus demonstrates the generalizability of work that joins demand-side theories of policymaking—those focusing on interest group pressures—with supply-side theories—those emphasizing formal decision rules and structures in the context of trade4
Rodrik 1994 discusses the need for such a synthesis in the trade policy literature while Lohmann and O'Halloran 1994; Mansfield and Busch 1995; Nollen and Quinn 1994; and Martin 2000 undertake empirical applications in this arena.
See Simmons 1994; Lohmann 1998; and Franzese 1999a.
The worldwide electricity sector before the early 1990s provides an appealing context in which to test our specific hypotheses. Infrastructure investment is inherently political as a result of the large quasi-rents associated with generation assets, the widespread consumption of output, and the common belief that large-scale economies create the potential for monopoly abuse by providers.6
See, for example, Levy and Spiller 1994; Spiller 1993; Williamson 1976.
See, for example, Levy and Spiller 1996.
We examine the infrastructure deployment patterns of state-owned electric utilities using a panel data set covering seventy-eight countries during the period 1970–94. Specifically, we assess the extent to which interest group pressures generated (and organized) by the industrial consumers of electricity combine with the level of veto points in the structure of a nation's formal political institutions to influence the annual rate of deployment of electricity-generating capacity, ceteris paribus.
The results of our analysis are robust and strongly support our hypotheses. We find that an increase in industrial representation among the consumers of electricity reduces the rate of infrastructure deployment, ceteris paribus. As the level of veto points rises, the negative marginal effect of industrial representation declines in absolute magnitude because political actors are less sensitive to interest group demands. However, when industrial representation is negligible and political actors thus predisposed to cater to the demands of the pro–white elephant lobby, an increase in the level of veto points lowers the deployment rate by reducing political actors' sensitivity to this lobby.
Conceptual Development
The arguments that form the basis of our hypotheses derive from three main bodies of literature, those on: (1) the inefficiency of SOEs, (2) interest group politics, and (3) veto points.
Inefficiency of State-Owned Enterprises
White elephants, which provide political benefits to salient constituencies but lack a strong economic rationale, are a particularly attractive vehicle for political actors seeking to maximize their support. These projects provide highly visible benefits stemming from increased employment to constituencies in the immediate regions in which they are built, as well as to national constituencies such as labor unions and engineering and construction lobbies.8
See, for example, Cadot, Roller, and Stephan 1999.
See, for example, Baron 1991, Hird 1991; Shepsle and Weingast 1981.
In the electricity sector, many SOEs constructed plants whose investment or operating costs were too high to justify the economic benefits of the capacity that they added to the system. Such plants were built in uneconomic locations, such as a remote area far the sources of demand; relied on inappropriate technologies, such as a large coal-burning plant built where a smaller gas-fired plant would have been more economic; or were “gold-plated” through the use of lavish materials and architectural designs.
Although the precise costs of white elephants are difficult to measure, the limited evidence is suggestive.10
For more detailed empirical evidence, see Bortolotti, Fantini, and Siniscalco 2000; Bourbakri and Cosset 1997; D'Souza and Megginson 1999; Megginson, Nash, and Van Randenborgh 1994.
See “Power Connections,” Latin Finance, 1 January 1999, 32.
See the reviews by Vining and Boardman 1989; and Megginson and Netter 2001; and, in particular, La Porta and Lopez-de-Silanes 1999; Bertero and Rondi 2000.
The analysis in this article adds to this body of evidence by examining the effects of differences in political—as opposed to market—incentives on SOEs' deployment of white elephants. Following the existing literature on SOEs, we assume that political actors seek to maximize their support by providing policy benefits to constituents and effectively direct SOEs' behavior through the appointment process and budgetary control. We do not observe political actors' incentives or control mechanisms directly, but rather consider the effects of observable sources of political incentives—interest group pressure for more efficient SOE behavior—and constraints—the level of veto points in a nation's formal political institutions—on SOEs' generating capacity deployment rates.
Interest Group Politics
A substantial body of literature in political science14
See, for example, Denzau and Munger 1986; Olson 1965; Rogowski 1989; and Wilson 1980.
See, for example, Peltzman 1976; Stigler 1971.
Work focusing explicitly on nonmarket strategy develops more elaborate models of constituent competition in the political arena. See, for example, Snyder 1992; and Baron 1994, 1999, and 2001.
Antecedents
Empirical support for the interest group politics perspective can be found in studies showing that larger and more profitable firms, which are hypothesized to overcome collective action problems more easily, are more likely to lobby.17
See, for example, Salamon and Sigfried 1977.
See, for example, Yoffie 1988; Rajan and Zingales 2004.
The international relations literature on trade and monetary policy corroborates this empirical support. For example, Simmons emphasizes the relative power of domestic traders and labor in her analysis of the breakdown of the interwar trading system.19
Milner and Milner and Yoffie highlight the role of “export dynamic groups” favoring free trade in overcoming the concentrated lobby for protectionism.20See Milner 1987, 1988; Milner and Yoffie 1989.
The lobby for discipline
In our analysis, the industrial consumers of electricity play an analogous role to that of the free trade lobby in Milner's and Simmon's earlier work. We argue that, as a group, industrial consumers are better able to overcome the collective action problems that impede political organization of the broader, more loosely knit group of electricity consumers incurring net costs from such projects. Therefore, industrial consumers exert greater pressure on the government to exercise discipline in the deployment of white elephants.21
Our argument does not imply that industrial consumers cannot be proponents of government-sponsored inefficiencies in areas other than state-owned electricity. For example, Simmons 1994 highlights the potential for traders to pursue protectionist policies in countries with substantial power in the international trading system. For a broader perspective on the destructive potential of industrial lobbying, see Rajan and Zingales 2004.
Industrial consumers receive a relatively small share of the benefits of white elephant projects, but bear significant costs through taxes and higher prices, as the same populist motives that lead politicians to use SOEs as a vehicle for employment often lead them to create pricing cross-subsidies from industrial to nonindustrial consumers.22
Industrial consumers represent a more stable source of demand than do residential consumers and are consequently less costly to serve. Thus, higher industrial rates are prima facie evidence of cross-subsidization, and lower industrial rates may even reflect cross-subsidization if they do not fully reflect cost differentials.
Faced with such costs, industrial consumers exploit their political organizational advantages to exert concerted pressure on political actors for greater financial discipline of SOEs. These advantages follow from the relative concentration of industrial consumers as a group and their possible preexisting affiliation with one another through industry associations and trade groups.23
Industrial firms represent the quintessential organized interest group in the economic theory of regulation. In contrast to our analysis, both Stigler and Peltzman, in addressing the U.S. private ownership context, conceive of producers exclusively as electric utilities, and “consumers” exclusively as unorganized, residential interests. See Stigler 1971; Peltzman 1976 and 1989.
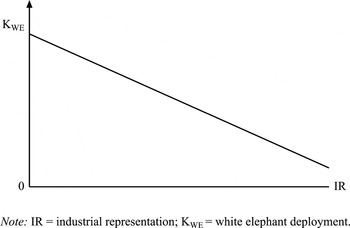
H1. The rate of white elephant deployment (KWE) declines as the level of industrial representation (ir) in the consumer base rises, ceteris paribus. That is,

.
Figure 1 depicts Hypothesis 1 graphically. The relationship between industrial representation (the fraction of electricity consumed by industrial users) and the rate of white elephant deployment is negative, ceteris paribus, as reflected by the downward slope of the schedule.

Industrial representation and white elephant deployment
The lobby for white elephants
The “dual” of Hypothesis 1 would posit a positive relationship between the political strength of the white elephant lobby and the rate of white elephant deployment. We propose no such hypothesis formally because various candidate measures of the former—such as the strength of labor unions and the engineering and construction lobbies—are not widely available enough for use in our empirical application. However, Hypothesis 3 below is a corollary of the hypothesized positive relationship between the political strength of the white elephant lobby and the rate of white elephant deployment.
It is important to recognize that the lack of an explicit measure of the strength of the pro–white elephant lobby does not alter Hypothesis 1. Hypothesis 1 concerns the marginal effect of the strength of the pro-discipline lobby on the rate of white elephant deployment (that is, the effect of an increase in ir on KWE while all other influences are held constant), and not the “net” effect of the offsetting influences of the two competing lobbies.24
We nonetheless assume that the rate of white elephant deployment exceeds zero. This assumption is consistent with the conceptual and empirical research on the inefficiency of state-owned enterprises, as well as a substantial amount of anecdotal evidence. It is also consistent with formal theoretical work in political economy. See Boycko, Shleifer, and Vishny 1996; Laffont and Tirole 1991; Peltzman 1989; Shapiro and Willig 1990; Shleifer and Vishny 1994.
Veto Points
Interest group politics alone do not determine policy outcomes; rather, the formal institutional structure of the policymaking process “condition[s] the extent to which politicians have the capacity and/or the incentive to act on their short-run electoral goals.”25
Broz and Frieden 2001, 334.
Antecedents
Our treatment of formal policymaking institutions is similar in spirit to that of Milner26
in her work on free trade, but our analysis differs in its quantitative empirical orientation and emphasis on veto points in formal policymaking structures,27A country's electoral system—that is, proportional or plurality-based representation—is another broad institution that may influence the degree of political actors' sensitivity to pressure from specific types of interest groups. The literatures on electoral rules and institutional influences on political corruption suggest that electoral institutions may affect the partisan structure and nature of competition among political actors, and therefore the extent to which such actors promote personalistic policies, as opposed to more nationalistic or party-centered ones. See Carey and Shugart 1995; Myerson 1993; Rogowski and Kayser 2002; and Wallack et al. 2003. Electoral rules may also affect the type of benefits that political actors deliver through such rules' effect on party discipline. See Ames 1995; Carey and Shugart 1995.
Although this research warrants consideration in the current context, these studies ultimately imply an indeterminate relationship between electoral institutions and white elephant deployment. As Kunicova and Rose-Ackerman 2003 emphasize, systems that promote broad-based, politically motivated public spending (both legal and illegal) tend not to promote geographically targeted, politically motivated public spending, and vice-versa. Yet, as we discuss, political actors deploy white elephants to benefit both constituents in specific regions (through employment, for example) as well as nationalistic interests (for example, the national construction lobby and labor unions). Thus while electoral institutions may affect the deployment of white elephants, the direction of this relationship is unclear, and it is possible that no relationship will be observed empirically because the contravening effects of system type on geographically targeted and nationalistic spending may offset each other. As discussed in fn. 50, we nonetheless test for the influence of electoral system type.
See, for example, McCubbins, Noll, and Weingast 1987; Weingast and Moran 1983; Tsebelis 1995.
Broz and Frieden 2001 highlight that in the construction of a policy regime, veto points may be associated with greater “logrolling” and politically motivated deviations from efficiency criteria. In our context, however, the regulatory regime and operations of the electricity sector are already in place; thus, the effect of veto players occurs at the level of policy (Broz and Frieden 2001, 333–35) and not the policy regime (Broz and Frieden 2001, 329–31).
Numerous empirical studies linking the stability of different types of policies to a country's number of veto points support these theoretical insights. Hallerberg and Basinger, for example, find that in response to the stimulus of President Ronald Reagan's tax cuts enacted by the United States in the 1980s, OECD countries with fewer de facto veto points lowered their tax rates by a greater amount than did countries with more veto points.31
Kastner and Rector reach similar conclusions about liberalization of capital controls.32 Martin highlights the credibility provided by the checks and balances of a nation's legislative institutions to its international trade commitments.33 Clark and colleagues, as well as Clark and Hallerberg, find that opportunistic political business cycles are less severe in countries that provide their central bank veto player status.34 Franzese and Treisman respectively find that countries with more veto points have more stable levels (either high or low) of government deficits and inflation.35See Franzese 1999b; Treisman 2000.
Current analysis
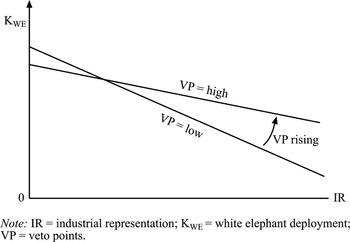
We expect that policymaking structures with more veto points reduce the degree to which political actors are sensitive to interest group pressures relative to structures with fewer veto points. Figure 2 extends Figure 1 by depicting the white elephant deployment schedule under high and low levels of veto points (with all else still held constant, including pressure from the white elephant lobby). An increase in veto points (vp) reduces the magnitude of the negative effect that an increase in the strength of the pro-discipline lobby (measured by ir) has on the rate of white elephant deployment, ceteris paribus. However, in accordance with Hypothesis 1, in no case should the slope of the schedule become nonnegative.

Industrial representation, veto points, and white elephant deployment
H2. As the level of institutional veto points in the policymaking process (vp) increases, the absolute magnitude of the negative relationship between industrial representation (IR) and the rate of white elephant deployment (KWE) declines, ceteris paribus. That is,

.
Our third hypothesis involves the relationship between the vertical intercepts of the white elephant deployment schedules, and is consistent with the proposition that the level of veto points conditions the influence of both lobbies on the rate of white elephant deployment in a symmetric manner. In Figure 2, pressure from the pro–white elephant lobby is held constant. The height of the vertical intercept of each white elephant deployment schedule reflects the rate of deployment that the pro–white elephant lobby attains in the absence of a countervailing pro-discipline lobby, ceteris paribus. The vertical intercept of the white elephant deployment schedule reflecting a lower level of veto points (the one with the steeper negative slope) is greater than that of the deployment schedule reflecting a higher level of veto points (the one with the shallower negative slope). To wit, just as an increase in the level of veto points (vp) more greatly reduces the magnitude of the negative effect that an increase in the strength of the pro-discipline lobby (measured by ir) has on the rate of white elephant deployment, it also more greatly reduces the magnitude of the positive effect that an increase in the strength of the (unobserved) white elephant lobby has on the rate of white elephant deployment, ceteris paribus.38
Hypothesis 3 involves the special case often implicitly examined in the literature on the inefficiency of state-owned enterprises, in which political actors are predisposed to serve the pro–white elephant lobby.
H3. When IR = 0, an increase in the level of veto points reduces the rate of white elephant deployment (KWE), ceteris paribus. That is,

.
Empirical Test
We test the hypotheses developed above on a panel data set covering up to seventy-eight countries during the period 1970—94. The unit of analysis is a country-year. The econometric specification to which the data are applied is derived from the following basic model of investment.

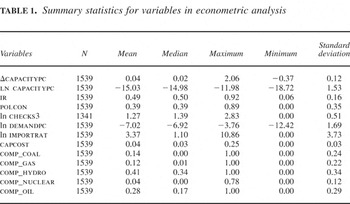
Table 1 provides descriptive statistics for these variables, which we describe at greater length below.
Summary statistics for variables in econometric analysis

Dependent Variable
The dependent variable in the conceptual hypotheses that we advance above is a country's rate of white elephant deployment. Empirically, it is not possible in a wide panel of countries to separate the deployment of white elephant capacity from that of economically “justifiable” deployment without subjectively assessing extremely detailed (and unavailable) data on investment costs and reserve ratios. However, we do not require such a measure to test our hypotheses. Rather, the marginal nature of the hypotheses, noted in their development above, permits us to use objective data on the annual growth rate of total SOE generating capacity (averaging 4.4 percent in the sample) for testing purposes.39
It is important to understand that our model does not imply an assumption about the fraction of SOE generating capacity deployment comprised by white elephant deployment.
Independent Variables
Industrial representation. We measure industrial representation as the one-year lagged ratio of industrial to total electricity consumption (ir). Data used to construct this measure are reported by the International Energy Agency.40
Veto points. We measure the level of veto points affecting political actors (vp) using two indexes that combine information about the number of formal political institutions with veto power and the extent of partisan heterogeneity within and among these institutions. Specifically, we employ one-year lags of the measures developed by Henisz (polcon) and Beck et al. (checks3), respectively.41
See Henisz 2000; Beck et al. 2001.
Existing capacity level. The one-year lagged value of the existing level of capacity per capita (capacitypc) reflects the effect of two influences on the rate of deployment. First, capacitypc measures the economic demand for replacement stock and should therefore be negatively correlated with the rate of new infrastructure deployment.42
Oliner, Rudebusch, and Sichel 1995, in a careful study of alternative empirical investment models, use existing capital stock in an analogous manner, as Lyon and Mayo 2000 do in an empirical study of electric generating capacity investment in the United States.
It is also possible that when existing capacity is low, the new infrastructure deployed is less likely to include white elephants. Because we do not directly observe the fraction of total capacity deployed comprising white elephants, we cannot directly test this explanation of the proposed negative effect of existing capacity. This possibility further suggests the importance of including capacitypc among our independent variables. It does not, however, alter the interpretation of any observed (marginal) effects of the political variables of central interest. Additionally, our results turn put to be inconsistent with this explanation, as we discuss in fn. 51.
As ir rises, the incentives that political actors face to exert discipline grow, implying that political actors will use a given increase in capacitypc to argue for a greater amount of discipline, leading to a lower rate of deployment of new capacity. That is, the negative marginal effect of capacitypc on the deployment rate should decline as ir rises.
Similarly, the magnitude of the negative marginal effect of capacitypc on the rate of deployment should also depend on the level of veto points that political actors face. A political actor's arguments for discipline in the case of a given increase in capacitypc are less likely to result in approval as the number and breadth of interests of the veto players among which agreement must occur grows. Thus, the magnitude of the negative effect of capacitypc on the deployment rate should decline as vp increases.
Demand. It is critical to control for the economic demand for new infrastructure. This demand derives from the expected future demand for electricity. However, actual forecasts of expected demand are unavailable for most countries and time periods and, in any case, pose the issue of endogeneity in a model whose dependent variable is the rate of capacity deployment.
Following accelerator models of investment44
and econometric research on U.S. electricity investment,45 we use recent consumption, measured as the prior year's end-user electricity consumption measured in kilowatt hours per capita (demandpc), as a proxy for the (unobservable) demand for infrastructure. Recent consumption is exogenous to infrastructure deployment choices, and political actors observe this measure when making deployment choices.Financial constraints. Ideally our specification would include a direct measure of a country's cost of capital to reflect differences in the financial cost of capacity expansion. Unfortunately, the data required to construct a comparable measure for SOEs in a panel of countries are not consistently available. We therefore use a proxy for a country's cost of capital using lagged gross annual government capital spending as a percentage of gross domestic product (GDP), measured in real US dollars (capcost). As this variable increases, reflecting a lower cost of capital, we expect to observe a higher rate of capacity deployment.
Availability of foreign supplies. Some governments can buy electricity from abroad rather than generate it domestically.46
For a similar argument applied in the U.S. context, see Lyon and Mayo 2000.
Composition of domestic supplies. Although differences in capacity composition—nuclear, coal, oil, gas, hydroelectric, or others—should not affect total capacity in a steady-state equilibrium, changes in composition may affect the total level of capacity during large-scale transitions to other fuel sources or technology types. We therefore include as a proxy a vector of independent variables measuring the percentage of the prior year's generating capacity stock for each major generating technology type (coal, gas, hydro, nuclear, oil, and the omitted category of “other”).
Country and year dummies. Despite our attempt to include a comprehensive set of independent variables that systematically influence SOE infrastructure deployment, we do not possess a variable measuring the strength of a country's pro–white elephant lobby. Throughout our conceptual discussion, we hold the strength (resulting from the level of political organization) of the white elephant lobby, as well as other country-level characteristics, constant. As discussed above—especially in the development of Hypothesis 3—the strength of a country's white elephant lobby acts as a “shift parameter” that increases or decreases the height of the vertical intercept in Figure 2. The country and year dummy variables play an analogous role in our empirical model by effectively permitting the vertical intercept to vary by country and year, thereby controlling for country-level, time-invariant and sample-wide, intertemporal differences in the strength of the white elephant lobby and other unobserved variables.
Specification
Our econometric specification is

where the subscripts i and t are cross-sectional (country) and time period indices, the notation ΔXt represents the percentage change in the variable X between period t − 1 and period t, and lnX represents the natural logarithm of X.47
We logarithmically transform those variables whose distribution is highly skewed to the left.
The specification includes multiplicative interactions among capacitypc, ir, and vp. The inclusion of the interaction terms permits proper statistical evaluation of the conditional effects hypothesized above.48
The interaction between ir and vp flows directly from Hypotheses 2 and 3. The interactions between capacitypc and ir, and capacitypc and vp, respectively, allow for the conditional effects hypothesized in the discussion of capacitypc. The three-way interaction terms reflect potential higher-order multiplicative effects given the hypothesized two-way effects among ir, vp, and capacitypc.The coefficients are estimated using ordinary least squares. Because the error term is expected to exhibit within-country serial correlation and heteroskedasticity, we employ a robust covariance matrix estimator to correct the standard errors. This covariance matrix estimator is consistent in the presence of within-unit serial correlation up to a specified lag and heteroskedasticity of unknown form, and it also does not rely on an assumption that the different cross-sectional units share a common autocorrelation parameter.49
The robust covariance matrix estimator is based on that developed by Newey and West 1987 for use in a time-series setting. See Driscoll and Kraay 1998; Froot 1989. Thanks to Aart Kraay for sharing his insights on this topic.
Results
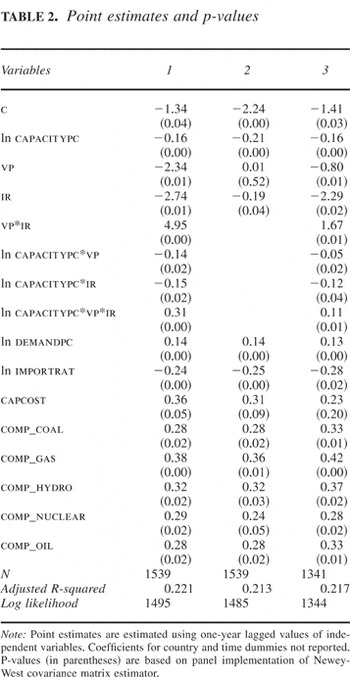
Table 2 reports the estimation results for the core specification described above and several variants that we use to assess the results' robustness. Column one reports results from the core specification using polcon as the veto point measure (vp). Column two reports results from the core specification using polcon as the veto point measure (vp) but without the interaction terms, in order to highlight the importance of the interaction between industrial representation and veto points. Column three reports results from the core specification using checks3 to measure vp.
Point estimates and p-values

Consider the first column. With the exception of certain time period and country dummies (omitted from the table for brevity), the coefficient estimate for each variable or interaction term is individually significant at a p-value of 0.05 or less. However, the individual point estimates of the coefficients for ir and vp, the independent variables of primary interest, do not have a meaningful interpretation as a result of the interaction terms in the model. Rather, proper assessment of the effects of ir and vp (as well as capacitypc) on the capacity growth rate (Δcapacitypc) depends on the respective estimators

and its standard error at different levels of vp; and

and its standard error at different levels of ir.
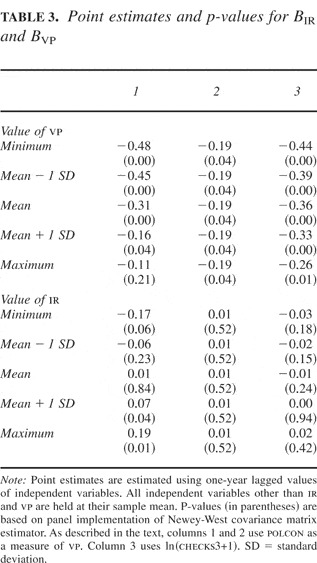
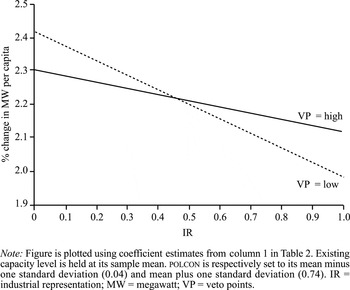
Table 3 reports estimates of BIR along with p-values when the existing capacity variable (capacitypct−1) is set to its sample mean value and vp set to different values, as well as estimates of BVP along with p-values when the existing capacity variable (capacitypct−1) is set to its sample mean value and ir set to different values. Figure 3 (the empirical analogue of Figure 1) illustrates the results graphically by plotting the predicted effect of industrial representation on the annual deployment rate when vp (measured by polcon) is respectively set to its sample mean minus one standard deviation (0.04) and mean plus one standard deviation (0.74).
Point estimates and p-values for BIR and BVP


Marginal effect of IR on capacity deployment rate at high and low levels of VP
Effects of ir and vp
Consider the first column of Table 3. Hypothesis 1 states that the marginal effect of ir should be negative (regardless of the level of vp). Consistent with this hypothesis, the effect of ir on the rate of infrastructure deployment when vp (measured here by polcon) takes any value from its sample minimum to sample maximum is negative and has a p-value of 0.04 or less at all reported values of vp except for the sample maximum (at which p = 0.21).
Hypothesis 2 states that the marginal effect of ir should decline in absolute magnitude as vp increases. When vp is set to its sample mean minus one standard deviation (a low level of veto points), a one standard deviation increase in ir (0.16) yields a predicted decline in the infrastructure deployment rate of 7.2 percentage points (the slope coefficient of −0.45 multiplied by the increase in ir of 0.16), equal to 164 percent of the absolute value of the infrastructure deployment rate's sample mean of 4.4 percentage points (or 58 percent of one standard deviation of the infrastructure deployment rate). When vp rises to its sample mean value (0.39), the effect of an increase in ir of one standard deviation (0.16) declines in absolute magnitude to a predicted reduction of 5.0 percentage points (the slope coefficient of −0.31 multiplied by the increase in ir of 0.16), equal to 136 percent of the absolute value of the infrastructure deployment rate's sample mean (37.5 percent of one standard deviation). The negative marginal effect of pressure exerted by the lobby favoring discipline therefore declines in absolute magnitude as the level of veto points rises. Moreover, when the level of veto points reaches its sample maximum, this effect declines so much in absolute magnitude that is statistically indistinguishable from zero (p = 0.21). These results are consistent with Hypothesis 2: as the level of veto points imposed by formal institutional structures increases, the negative marginal influence of industrial consumers on infrastructure deployment declines.
Hypothesis 3 addresses the effect of veto points (vp) when ir = 0. When ir takes its sample minimum value of 0.06, the marginal effect of vp is negative, with an estimated value of −0.17 and p-value of 0.06. When ir takes the out-of-sample value of zero, the implied marginal effect of vp is −0.18, suggesting that a one standard deviation increase in vp (0.35) would generate a predicted decrease in the infrastructure deployment rate of 6.3 percentage points, equal to 155 percent of the absolute value of the deployment rate's sample mean (or 52 percent of one standard deviation). These results are consistent with Hypothesis 3: when political actors are predisposed to cater to the white elephant lobby's demands for increased deployment, the marginal effect of veto points (vp)—which reduce political actors' sensitivity to interest group pressures—is a reduction in the deployment rate, ceteris paribus.50
Based on the discussion in fn. 27, we also tested our specification on four subsamples, each composed of countries with a specific type of electoral system. The estimates of BIR are qualitatively similar to those reported in Table 3 in all of the subsamples and attain statistical significance in many of the same cases. We attribute the loss of statistical significance in the other cases to the substantially smaller size of the subsamples relative to the entire sample (the subsamples range in size from 238 to 540 country-years), and thus the reduced statistical power of our tests. No discernible pattern emerges when we compare the estimates of BIR and BVP across the subsamples, nor would we expect one to, as discussed in fn. 27. The qualitative consistency of the estimated coefficients even from these small subsamples does, however, bolster our confidence that the estimates from our full sample do not reflect a spurious relationship involving electoral system type.
The remaining independent variables in the first column of Table 2 are all statistically significant. When vp and ir are permitted to vary within one standard deviation around their sample mean, the total effect of existing capacity level ranges from −0.198 to −0.217, with a p-value of 0.008 or less. This effect persists in both sign and statistical significance over almost all feasible combinations of values of the three variables.51
Full results for this variable are available from the authors on request. Our results are consistent with the proposed “political” explanation of the effect of existing capacity level—that it facilitates political arguments for white elephants—and inconsistent with the proposition that a larger fraction of capacity deployed is composed of public goods when ir is low, as discussed in fn. 43. As noted in the text, the effect of capacitypc is negative and statistically significant at all observed values of ir. Moreover, although we do not report them in detail, estimates of BCAPACITYPC actually decline in absolute magnitude as ir rises (from −0.217 at the sample minimum value of ir to −0.198 at the sample maximum value of ir). These results are consistent with the existence of the political mechanism that we posit.
It is informative to compare the economic magnitude of the effect of demandpc with that of the political variables of theoretical interest. While a one standard deviation increase in demandpc leads to a two standard deviation predicted increase in the dependent variable, this effect is more than offset in countries with industrial representation one standard deviation above the mean and political constraints one standard deviation below the mean.
Alternative specifications and robustness
Tables 2 and 3 include results from several additional specifications. Column 2 of each table contains the results from a specification that does not include interaction terms. The effect of industrial representation is once again negative and statistically significant, in accordance with Hypothesis 1. Moreover, vp's lack of statistical significance in this specification is consistent with Hypothesis 3: if the marginal effect of vp is negative where industrial representation (ir) is low and positive where IR is high, then the “average” marginal effect of vp—which is what Specification 2 reflects—might well be close to zero.
The results in column 3 are based on a specification that uses checks3 as the veto point measure.53
Results available from the authors on request also demonstrate robustness to the use of Polity's Executive Constraint Index and an index of democracy (Democracy—Autocracy).
Results available from the authors on request.
Conclusions
A higher level of industrial representation among the consumers of electricity mutes political actors' incentives to satisfy the demands of concentrated geographic interests, labor unions, and the engineering and construction lobbies to build white elephants, reducing the rate of infrastructure deployment. Veto points that constrain political actors moderate the effect of interest group pressures in the hypothesized manner.
Following recent work in the area of trade, monetary, and fiscal policymaking, our results demonstrate the feasibility and importance of combining conceptual perspectives on interest group politics and veto points. Where veto points are high, interest group pressures have a smaller effect on policy outcomes. The same level of interest group pressure may therefore translate into a different level of “success” in different states or jurisdictions, depending on the formal institutional structure. The analysis further demonstrates the feasibility of capturing international variation in sector-level interest group pressure using readily available economic data.
The effects that we find are statistically, economically, and substantively important. Consider the case of Argentina as an example. Prior research finds that the unit cost of investment there fell from $7.2 million/megawatt to $1.9 million/megawatt after the introduction of market-oriented reforms to the electricity industry. This cost reduction translates into an annual average savings of $2.74 billion based on the average 517 megawatts of new capacity that Argentina deployed annually in our data set. For purposes of comparison, suppose that Argentina had not undertaken privatization reforms, but that instead its level of industrial representation had increased from its 1994 value of 41 percent to 57 percent (roughly equivalent to the level found in India and Portugal). Given Argentina's current level of veto points (polcon = 0.54), this increase in industrial representation would result in an annual reduction of 722 megawatts in the rate of generating capacity deployment, saving somewhere up to $5.2 billion annually (depending on whether the unit cost of infrastructure also declined).
Despite the strong empirical support for our hypotheses, we also note several limitations that warrant additional cross-national econometric work in this area. First, we are unable to measure the political organization of the “white elephant” lobby. Empirical contexts in which national policy debates are easily divisible into consumer versus producer interests, or pit one region against another, would aid in the further development of the empirical approach that we follow here. Second, our measure of interest group pressure for discipline on SOE infrastructure deployment does not reflect qualitative factors that may affect preferences about redistributive policies, such as dominant national beliefs about the role of the state, especially in the infrastructure sector. Finally, our measure of institutional constraints does not take into account the structure of the regulatory apparatus or subnational variation in political and regulatory structures. Despite these limitations, we still derive robust results consistent with our hypotheses. Better measures should only increase the statistical and economic significance of related findings.
References
REFERENCES
Ames, Barry.
1995.
Electoral Rules, Constituency Pressures and Pork Barrel: Bases of
Voting in the Brazilian Congress.
Journal of Politics
57 (2):325–43.Google Scholar
Artana, Daniel,
Fernando Navajas, and
Santiago Urbiztondo.
2001.
Regulation Policies Towards Utilities and Competitive Industries:
The Case of Argentina.
Quarterly Review of Economics and Finance
41 (5):585–607.Google Scholar
Baron, David P.
1991.
Majoritarian Incentives, Pork Barrel Programs and Procedural
Control.
American Journal of Political Science
35 (1):57–90.Google Scholar
Baron, David P.
1994.
Electoral Competition with Informed and Uninformed Voters.
American Political Science Review
88 (1):33–45.Google Scholar
Baron, David P.
1999.
Integrated Market and Nonmarket Strategies in Client and Interest
Group Politics.
Business and Politics
1 (1):7–34.Google Scholar
Baron, David P.
2001.
Private Politics, Corporate Social Responsibility and Integrated
Strategy.
Journal of Economics and Management Strategy
10 (1):7–45.Google Scholar
Beck, Thorsten,
George Clarke,
Alberto Groff,
Philip Keefer, and
Patrick Walsh.
2001.
New Tools and New Tests in Comparative Political Economy: The
Database of Political Institutions.
World Bank Economic Review
15 (1):165–76.Google Scholar
Bertero, Elisabetta, and
Laura Rondi.
2000.
Financial Pressure and the Behavior of Public Enterprises under Soft
and Hard Budget Constraints: Evidence from Italian Panel Data.
Journal of Public Economics
75 (1):73–98.Google Scholar
Bortolotti, Bernardo,
Marcella Fantini, and
Domenico Siniscalco.
2000.
Privatization and Institutions: A Cross-Country Analysis.
CESifo Working Paper Series 375.
Munich, Germany:
Center for Economic Studies.
Bourbakri, Narjess, and
Jean-Claude Cosset.
1997.
The Financial and Operating Performance of Newly Privatized Firms:
Evidence from Developing Countries.
Journal of Finance
53 (3):1081–110.Google Scholar
Boycko, Maxim,
Andrei Shleifer, and
Robert W. Vishny.
1996.
A Theory of Privatization.
Economic Journal
106 (435):309–19.Google Scholar
Broz, J. Lawrence, and
Jeffry A. Frieden.
2001.
The Political Economy of International Monetary Relations.
Annual Review of Political Science
4 (1):317–43.Google Scholar
Cadot, Olivier,
Lars-Hendrik Roller, and
Andeas Stephan.
1999.
A Political Economy Model of Infrastructure Allocation: An Empirical
Assessment.
Discussion Paper 99 (15).
Berlin:
Social Science Research Center.
Carey, John M., and
Matthew Soberg Shugart.
1995.
Incentives to Cultivate a Personal Vote: A Rank Ordering of
Electoral Formulas.
Electoral Studies
14 (4):417–39.Google Scholar
Clark, William Roberts, and
Mark Hallerberg.
2000.
Mobile Capital, Domestic Institutions and Electorally Induced
Monetary and Fiscal Policy.
American Political Science Review
94 (2):323–46.Google Scholar
Clark, William Roberts,
Usha Nair Reichert,
Sandra Lynn Lomas, and
Kevin L. Parker.
1998.
International and Domestic Constraints on Political Business Cycles
in OECD Economies.
International Organization
52 (1):87–120.Google Scholar
Denzau, Arthur T., and
Michael C. Munger.
1986.
Legislators and Interest Groups: How Unorganized Interests Get
Represented.
American Political Science Review
80 (1):89–107.Google Scholar
Driscoll, John C., and
Aart C. Kraay.
1998.
Consistent Covariance Matrix Estimation with Spatially-Dependent
Panel Data.
Review of Economic and Statistics
80 (4):549–60.Google Scholar
D'Souza, Juliet, and
William L. Megginson.
1999.
The Financial and Operating Performance of Privatized Firms During
the 1990s.
Journal of Finance
54 (4):1397–438.Google Scholar
Franzese, Robert J., Jr.
1999a.
Partially Independent Central Banks, Politically Responsive
Governments and Inflation.
American Political Science Review
43 (3):681–706.Google Scholar
Franzese, Robert J., Jr.
1999b.
The Positive Political Economy of Public Debt: An Empirical
Examination of the OECD Postwar Debt Experience.
Unpublished,
University of Michigan,
Ann Arbor.
Friedrich, R. J.
1982.
In Defense of Multiplicative Terms in Multiple Regression
Equations.
American Journal of Political Science
26 (4):797–833.Google Scholar
Froot, Kenneth A.
1989.
Consistent Covariance Matrix Estimation with Cross-Sectional
Dependence and Heteroskedasticity in Financial Data.
Journal of Financial and Quantitative Analysis
24 (3):333–55.Google Scholar
Garrett, Geoffrey, and
Peter Lange.
1995.
Internationalization, Institutions and Political Change.
International Organization
49 (4):627–55.Google Scholar
Hallerberg, Mark, and
Scott Basinger.
1998.
Internationalization and Changes in Tax Policy in OECD Countries:
The Importance of Domestic Veto Players.
Comparative Political Studies
31 (3):321–52.Google Scholar
Henisz, Witold Jerzy.
2000.
The Institutional Environment for Economic Growth.
Economics and Politics
12 (1):1–31.Google Scholar
Hird, John A.
1991.
The Political Economy of Pork: Project Selection at the U.S. Army
Corps of Engineers.
American Political Science Review
85 (2):429–56.Google Scholar
International Energy Agency.
1999.
Energy Statistics.
Paris:
Organization for Economic Cooperation and Development.
Jaccard, James,
Robert Turisi, and
Choi K. Wan.
1990.
Interaction Effects in Multiple Regression.
London:
Sage Publications.
Karp, Larry, and
Jeffrey Perloff.
1995.
Why Industrial Policies Fail: Limited Commitment.
International Economic Review
36 (4):887–905.Google Scholar
Kastner, Scott, and
Chad Rector.
2003.
International Regimes, Domestic Veto-Players and Capital Controls
Policy Stability.
International Studies Quarterly
47 (1):1–22.Google Scholar
Kunicova, Jana, and
Susan Rose-Ackerman.
2003.
Electoral Rules as Constraints on Corruption.
Unpublished,
Yale University,
Hartford, Conn. Available at 〈http://lawweb.usc.edu/cslp/conferences/modeling_const_02/kunicova.pdf〉.
Accessed 1 September 2005.
Laffont, Jean-Jacques, and
Jean Tirole.
1991.
Privatization and Incentives.
Journal of Law, Economics and Organization
7 (special
issue):84–103.Google Scholar
La Porta, Rafael, and
Florencio Lopez-de-Silanes.
1999.
The Benefits of Privatization: Evidence from Mexico.
Quarterly Journal of Economics
114 (4):1193–242.Google Scholar
Levy, Brian, and
Pablo T. Spiller.
1994.
The Institutional Foundations of Regulatory Commitment: A
Comparative Analysis of Telecommunications Regulation.
Journal of Law, Economics and Organization
10 (2):201–46.Google Scholar
Levy, Brian, and
Pablo T. Spiller.
1996.
Regulations, Institutions and Commitment.
Cambridge:
Cambridge University Press.
Lohmann, Susanne.
1998.
Federalism and Central Bank Independence: The Politics of German
Monetary Policy, 1957–1992.
World Politics
50 (3):401–46.Google Scholar
Lohmann, Susanne, and
Sharyn O'Halloran.
1994.
Divided Government and U.S. Trade Policy: Theory and
Evidence.
International Organization
48 (4):595–632.Google Scholar
Lyon, Thomas P., and
John W. Mayo.
2000.
Regulatory Opportunism and Investment Behavior.
Unpublished,
University of Michigan,
Ann Arbor.
MacIntyre, Andrew.
2001.
Institutions and Investors: The Politics of the Financial Crisis in
Southeast Asia.
International Organization
55 (1):81–122.Google Scholar
Mansfield, Edward D., and
Marc L. Busch.
1995.
The Political Economy of Nontariff Barriers: A Cross-National
Analysis.
International Organization
49 (4):723–49.Google Scholar
Martin, Lisa L.
2000.
Democratic Commitments: Legislatures and International
Cooperation.
Princeton, N.J.:
Princeton University Press.
McCubbins, Matthew D.,
Roger G. Noll, and
Barry R. Weingast.
1987.
Administrative Procedures as Instruments of Political
Control.
Journal of Law, Economics and Organization
3 (2):243–77.Google Scholar
Megginson, William L.,
Robert C. Nash, and
Matthias Van Randenborgh.
1994.
The Financial and Operating Performance of Newly Privatized Firms:
An International Empirical Analysis.
Journal of Finance
49 (2):403–52.Google Scholar
Megginson, William L., and
Jeffry M. Netter.
2001.
From State to Market: A Survey of Empirical Studies on
Privatization.
Journal of Economic Literature
39 (2):321–89.Google Scholar
Milner, Helen V.
1987.
Resisting the Protectionist Temptation: Industry and the Making of
Trade Policy in France and the United States During the 1970s.
International Organization
41 (4):639–65.Google Scholar
Milner, Helen V.
1988.
Trading Places: Industries for Free Trade.
World Politics
40 (3):350–76.Google Scholar
Milner, Helen V., and
David B. Yoffie.
1989.
Between Free Trade and Protectionism: Strategic Trade Policy and a
Theory of Corporate Trade Demands.
International Organization
43 (2):239–72.Google Scholar
Myerson, R.
1993.
Effectiveness of Electoral Systems for Reducing Government
Corruption: A Game Theoretic Analysis.
Games and Economic Behavior
5 (1):118–32.Google Scholar
Newey, Whitney K., and
Kenneth D. West.
1987.
A Simple, Positive Semi-Definite, Heteroskedasticity and
Autocorrelation Consistent Covariance Matrix.
Econometrica
55 (5):703–8.Google Scholar
Nollen, Stanley D., and
Dennis P. Quinn.
1994.
Endogenous Protection in the United States, 1900–1984.
International Organization
48 (3):491–525.Google Scholar
Oliner, Stephen D.,
Glenn D. Rudebusch, and
Daniel E. Sichel.
1995.
New and Old Models of Business Investment: A Comparison of
Forecasting Performance.
Journal of Money, Credit and Banking
27 (3):806–26.Google Scholar
Olson, Mancur.
1965.
The Logic of Collective Action: Public Goods and the Theory of
Groups.
Cambridge, Mass.:
Harvard University Press.
Peltzman, Sam.
1976.
Toward a More General Theory of Regulation.
Journal of Law and Economics
19 (2):211–48.Google Scholar
Peltzman, Sam.
1989.
The Control and Performance of State-Owned Enterprises. In
Privatization and State-Owned Enterprises, edited by
Paul MacAvoy
et al.
Boston, Mass.:
Kluwer Academic.
Rajan, Raghuram G., and
Luigi Zingales.
2004.
Saving Capitalism from the Capitalists.
Princeton, N.J.:
Princeton University Press.
Rodrik, Dani.
1994.
What Does the Political Economy Literature on Trade Policy (Not)
Tell Us That We Ought to Know.
Working Paper 4870.
Cambridge, Mass.:
National Bureau for Economic Research.
Rogowski, Ronald.
1989.
Commerce and Coalitions: How Trade Affects Domestic Political
Alignments.
Princeton, N.J.:
Princeton University Press.
Rogowski, Ronald, and
Mark Andreas Kayser.
2002.
Majoritarian Electoral Systems and Consumer Power: Price-Level
Evidence from the OECD Countries.
American Journal of Political Science
46 (3):526–39.Google Scholar
Salamon, Lester M., and
John J. Sigfried.
1977.
Economic Power and Political Influence: The Impact of Industry
Structure on Public Policy.
American Political Science Review
71:1026–43.Google Scholar
Shapiro, Carl, and
Robert D. Willig.
1990.
Economic Rationales for the Scope of Privatization. In
The Political Economy of Public Sector Reform and
Privatization, edited by
Ezra Sulieman and
John Waterbury.
San Francisco:
Westview Press.
Shepsle, Kenneth, and
Barry R. Weingast.
1981.
Political Preferences for the Pork Barrel: A Generalization.
American Journal of Political Science
25 (1):96–111.Google Scholar
Shleifer, Andrei, and
Robert W. Vishny.
1994.
Politicians and Firms.
Quarterly Journal of Economics
109 (4):995–1025.Google Scholar
Simmons, Beth.
1994.
Who Adjusts? Domestic Sources of Foreign Economic Policy During the
Interwar Years.
Princeton, N.J.:
Princeton University Press.
Snyder, James M., Jr.
1992.
Committee Power, Structure-Induced Equilibria and Roll Call
Votes.
American Journal of Political Science
36 (1):1–30.Google Scholar
Spiller, Pablo T.
1993.
Institutions and Regulatory Commitment in Utilities'
Privatization.
Industrial and Corporate Change
2 (3):387–450.Google Scholar
Stigler, George J.
1971.
The Theory of Economic Regulation.
Bell Journal of Economic and Management Science
2 (1):3–21.Google Scholar
Treisman, Daniel.
2000.
Decentralization and Inflation: Commitment, Collective Action or
Continuity.
American Political Science Review
94 (4):837–57.Google Scholar
Tsebelis, George.
1995.
Decision-Making in Political Systems: Veto Players in
Presidentialism, Parliamentarism, Multicameralism and
Multipartyism.
British Journal of Political Science
25 (3):289–325.Google Scholar
Tsebelis, George.
2003.
Veto Players: How Political Institutions Work.
Princeton, N.J.:
Princeton University Press and Russell Sage Foundation.
Vining, Aidan R., and
Anthony E. Boardman.
1989.
Ownership and Performance in Competitive Environments: A Comparison
of the Performance of Private, Mixed and State-Owned Enterprises.
Journal of Law & Economics
32 (1):1–33.Google Scholar
Wallack, Jessica Seddon,
Alejandro Gaviria,
Ugo Panizza, and
Ernesto Stein.
2003.
Political Particularism around the World.
World Bank Economic Review
17 (1):133–43.Google Scholar
Weingast, Barry, and
Mark Moran.
1983.
Bureaucratic Discretion or Congressional Control? Regulatory
Policymaking by the Federal Trade Commission.
Journal of Political Economy
91 (5):765–800.Google Scholar
Williamson, Oliver E.
1976.
Franchise Bidding with Respect to CATV and in General.
Bell Journal of Economics
7 (1):73–104.Google Scholar
Willig, Robert D.
1994.
Public Versus Regulated Private Enterprise.
Proceedings of the World Bank Annual Conference on Development
Economics, 1993:155–80.
Wilson, James Q.
1980.
The Politics of Regulation. In
The Politics of Regulation, edited by
James Q. Wilson,
319–36.
New York:
Basic Books.
Yoffie, David B.
1988.
How an Industry Builds Political Advantage.
Harvard Business Review
66 (3):82–89.Google Scholar
Industrial representation and white elephant deployment
Industrial representation, veto points, and white elephant deployment
Summary statistics for variables in econometric analysis
Point estimates and p-values
Point estimates and p-values for BIR and BVP
Marginal effect of IR on capacity deployment rate at high and low levels of VP
 You have
Access
- 59
- Cited by