I. INTRODUCTION
Metallic glasses (MGs) are newcomers of the time-honored alloy family. Reference Inoue1 They are generally fabricated by fast cooling from melt to maintain the structural disorder of the liquid state. Unlike traditional crystalline metals, the microstructure of a MG is completely amorphous, without any crystalline grain and long-range atomic periodicity. Reference Greer, Rutherford and Hutchings2–Reference Wang, Zang and Lu4 As the metallic bond is much weaker than a covalent or an ionic bond, MGs possess the advantage of both glass and metal, demonstrated by their excellent electrical and thermal conductivities, much higher strength than their crystalline counterparts, and superplasticity under an elevated temperature. Reference Chen5,Reference Inoue6 However, the complicated mechanical behavior and the lack of ductility bottleneck the wide application of MGs. At room temperature, MGs are very brittle under tension but can become ductile under compression. Reference Lu, Ravichandran and Johnson7 The strengths are insensitive to a large range of strain rates but reduce if the strain rate is beyond 103 s−1. Reference Liu, Liu, Xia and Wang8 In the supercooled liquid regime, however, MGs demonstrate superplasticity and rheological behavior with strong temperature and strain rate dependence. Reference Lu, Ravichandran and Johnson7,Reference Schuh, Hufnagel and Ramamurty9 It is also noted that the mechanical properties vary pronouncedly in different MG systems. Reference Wang, Zhao, Bai, Pan, Xia, Han, Xi, Wu and Wang10,Reference Schroers and Johnson11 For example, Fe-based MGs possess much higher strength and much lower ductility than Zr-based MGs. Reference Chen5 To understand these phenomena, a deep understanding of their atomistic deformation mechanism is necessary.
The plastic deformation of a MG is neither continuous nor homogenous, Reference Rodney, Tanguy and Vandembroucq12 which is manifested by the sudden bursts of plastic strain and shear banding. Reference Schuh, Hufnagel and Ramamurty9 Their microscopic picture is the localized atomic structural rearrangements, which occur stochastically and swiftly, causing the discrete plasticity events both temporarily and spaciously. From the energetic point of view, the atomic rearrangement can be considered as a process that the atomic system changes from one relatively low-energy configuration to another, crossing an activated configuration at the saddle. Reference Liu, Ruan and Zhang13,Reference Ruan, Zhang and Lu14 At a high temperature, the thermal vibration is large enough to homogenously assist the crossover of configurations over the whole energy landscape, leading to the superplasticity of MG. At a low temperature, however, atomic rearrangements are biased toward the lowest saddle, inducing heterogeneous deformation and finally lead to shear banding failure. Reference Liu, Ruan and Zhang15
The atomic clusters undergoing rearrangement, which is named plastic unit in this article, are of certain size. Based on the classical theory of shear transformation zone (STZ), Reference Argon16 it is generally regarded that the size of the STZ, on the order of hundreds (100–200) of atoms, is the characteristic size of a plastic unit. Therefore, the STZ theory or the subsequent development on cooperative shearing may be applied to quantify the size in an indirect way. Liu et al. Reference Liu, Wang, Peng, Yu and Wang17 indirectly measured the average activation energy and the volume of plastic units of various MGs by a dynamic mechanical analysis (DMA). They found a correlation between the size of the flow units and the Poisson's ratio ν of the material. The MGs with a smaller sized plastic unit have larger values of ν and also better plasticity. Pan et al. Reference Pan, Inoue, Sakurai and Chen18 also evaluated the size of the plastic unit of various MGs through their strain rate sensitivity estimated by the instrumented nanoindentation, but obtained an opposite conclusion. Unlike the aggregated dislocations in crystalline metals, the plasticity events in MG do not leave any structural imprints for measuring them. The problem on the definition of these basic plastic units Reference Dasgupta, Karmakar and Procaccia19 has been poised by the inability in direct experimental characterization. Alternatively, molecular dynamics (MD) analysis has been used due to its simplicity in resolving the structural evolution and dynamics response. Reference Takeuchi and Edagawa20
Chen and Ma. Reference Cheng and Ma21 studied the relationship between atomic structure and mechanical properties and concluded that plasticity events and shear banding are the results of the initial structural heterogeneity. Some structures, e.g., the icosahedra, are particularly stiff and hard to be rearranged. Reference Cheng and Ma21,Reference Cao, Cheng and Ma22 The more are these structures, the less possible is shear banding. Shi and Falk Reference Shi and Falk23 reported that shear band nucleates more easily in glasses produced at the lower cooling rate. Recent atomistic simulations of MGs indicated the length scale of plastic unit Reference Murali, Zhang and Gao24 based on the nanoscale density fluctuations, which are supposed to be the main cause of cavitation and brittle failure. Reference Murali, Narasimhan, Guo, Zhang and Gao25,Reference Murali, Guo, Zhang, Narasimhan, Li and Gao26 However, in these MD analyses, the nucleation of plastic units and their contributions to the deformation of bulk MG remains unclear.
This work uses the MD method to investigate two binary MGs of different ductility, Zr50Cu50 and Fe80P20, subjected to cryogenic deformation. Under such conditions, the effect of thermal fluctuation is minimized and the local atomic rearrangements can be discerned by the concomitant kinetic energy. This approach will allow us to identify the nucleation and evolution of plastic units, and hence to investigate the local strain rate and strain in these units and their influence on the global plastic deformation.
II. METHOD
The binary amorphous systems of Cu50Zr50 and Fe80P20 were constructed via a typical melt-quench process. Reference Liu, Ruan and Zhang13,Reference Liu, Ruan and Zhang15 The many-body embedded atom potential was used to reflect the significance of the electron cloud for the metallic systems. Reference Ackland, Mendelev, Srolovitz, Han and Barashev27,Reference Mendelev, Kramer, Ott, Sordelet, Yagodin and Popel28 In the simulations, the pressure and temperature were kept constant through the Nose–Hover barostat and thermostat (updating every 0.2 ps), respectively. Periodic boundary conditions (PBC) in all directions were enforced. For both MGs, the initial atomic configurations were obtained by randomly distributing 20,000 atoms in a cube (6 nm × 12 nm × 6 nm). These models were then heated and equilibrated at 2000 K for 2 ns. The final specimens subjected to deformation were obtained through quenching the model to 0.1 K with the cooling rate of 100 K/ns. Uniaxial compression tests were performed by changing the height of the simulation box every 1 ps to achieve a strain rate of 7 × 10⁸ s−1. To compare the density and localization of shear band, big MG models of 400,000 atoms were also established by replicating the quenched small model for both MGs. Owing to the PBC, the replicating process does not induce interface mismatches. Reference Schlick29,Reference Rapaport30 In all MD simulations, the simulation time step is 2 fs.
The big models were subjected to simple shear under a shear strain rate of 5 × 10⁸ s−1. All MD simulations were conducted using the MD code, LAMMPS Reference Plimpton31 and were analyzed with the aid of the open visualization tool, Ovitio. Reference Stukowski32 Considering that the random atomic motion in the melt may lead to variation of amorphous structure after quenching, we repeated the simulation of the same material for at least three times. We also confirmed that increasing the sample size by even doubling the dimensions does not change the mechanical behavior.
III. RESULTS AND DISCUSSION
A. High kinetic energy clusters
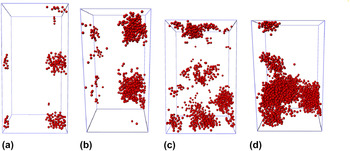
The atoms involved in the plasticity event possess large translational kinetic energy (nonthermal components of kinetic energy) when the potential energy barrier that obstructs structural changes is overcome. This part of kinetic energy is hard to be distinguished at and beyond room temperature but becomes prominent at a sufficiently low temperature. Before loading, the maximum kinetic energies of the atoms in Cu50Zr50 and Fe80P20 induced by the thermal vibration are 1.1 × 10⁻⁴ and 1.2 × 10⁻⁴ eV, respectively. These two values are then set as the cut-off kinetic energies to distinguish fast atoms and slow atoms. In Fig. 1, the atoms with kinetic energy smaller than the cut-off value are removed. It is then noted that the remaining atoms form clusters, which can be considered as plastic units. These high kinetic energy clusters evaluated at every time step provide a direct way to trace the plasticity events in MG. In the Cu50Zr50 specimen, the clusters first emerging at the strain of 0.0154 are shown in Fig. 1(a). The average diameter of these clusters is about 1.5–2 nm, containing more than one hundred of atoms. It should be noted that this size is in line with the experimental results in Ref. Reference Liu, Wang, Peng, Yu and Wang17, where the size of plastic unit was estimated from DMA experiments. In the Fe80P20 specimen, the clusters first appear at the strain of 0.035 with the size of 2–2.5 nm, which is larger than that in Cu50Zr50. This validates the experimental result that the material with lower ductility has relatively larger plastic units. Reference Liu, Wang, Peng, Yu and Wang17 Along with the increasing strain, more and more clusters emerge and interact with each other, as shown in Fig. 1(c) for Cu50Zr50 and Fig. 1(d) for Fe80P20. But the follow-up phenomenon after the transitions occur is different in two MGs. In Zr50Cu50, the plastic units are smaller and more dispersed. On the contrary, the plastic units in Fe80Ni20 coalesce, which easily lead to catastrophic shear band failure (to be more elaborated in Sec. III. E).
The clusters of fast atoms in (a) Zr50Cu50 at strain 0.0154, (b) Fe80P20 at strain 0.035, (c) Zr50Cu50 at strain 0.14, and (d) Fe80P20 at strain 0.14.

In an equilibrium MD, the kinetic energy of atoms follows the same distribution regardless of the bond strength or particle mass. The cut-off kinetic energy we used is the maximum kinetic energy of particles identified in the isothermal relaxation. It can be regarded as a threshold arising from the equilibrium MD for pinpointing the effect of nonequilibrium dynamic process. The larger bond strength in Fe–P material system leads to more energy release when a barrier is crossed and affects a wider area. Therefore, it is rational to see that the rearranging cluster in Fe80P20 is larger than that in Cu50Zr50. It should be noted that we avoid calling them STZ because these clusters are the consequences of local rearrangement instead of the causes. Therefore, the size of the cluster does not directly indicate the size of STZ in a particular atomic system.
B. Variations of stress, potential energy, and kinetic energy
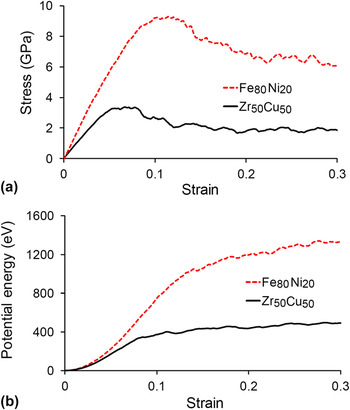
Figure 2(a) presents the uniaxial stress–strain curves of these two MGs. The general shapes of the two curves are very similar, including the initial elastic response, yielding, softening, and, finally, steady plastic flow. The elastic limit and yielding strength of both the MGs are much larger than those obtained in the experiment. The causes could be of 2-fold. First, the realistic samples unavoidably possess microscale imperfections such as surface notches, internal voids, micro-cracks, oxide inclusions, and nonmelted particles, where shear band nucleates more easily owing to stress concentration. Reference Cheng and Ma33 Second, the MD simulation uses an unrealistically high strain rate, which defers the inception of plasticity. It is noted that the first plastic clusters mentioned in Figs. 1(a) and 1(b) actually occur in the elastic regime. The bulk yielding point corresponds to the sudden surge of the number of clusters. After that, the continuous nucleation and annihilation of the clusters lead to the softening and a final steady flow stress. The total potential energies are shown in Fig. 2(b), in which the initial values are set to zero. One can find that the initial increase of potential energy in Fe80Ni20 is much steeper and larger than that in Zr50Cu50, making its yielding stress 2.5 times higher than that of Zr50Cu50. This ratio is in line with experimental results. Reference Chen5 After yielding, the variation rates of the total potential energies reduce in the softening and steady plastic flow regime.
The variation of stress (a) and potential energy (b) with the applied compressive strain for both Zr50Cu50 and Fe80P20 MGs.

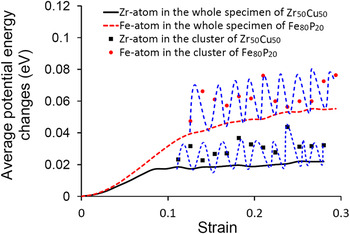
The steady flow regime is a manifestation of the rise and fall of local potential energy in the plastic units, making the total potential energy levels off but the stress is nonzero. To elaborate this conception in detail, the variations of the average potential energies of Zr atoms in the clusters and in the whole specimen of Zr50Cu50 are calculated as shown in Fig. 3. The increase in the average potential energy of all Zr atoms approaches a plateau at large strain. However, the plastic clusters are in the activated state with much higher potential energy than the global average. Although continuous nucleation and annihilation of the plastic units lead to the rise and fall of local potential energy (as indicated by the dashed line in Fig. 3), the average potential energy of the whole specimen remains at the position slightly higher than the minimum point, which therefore gives the nonzero stress. For comparison, the increase in the average potential energies of Fe atoms in the clusters and in the whole specimen of Fe80P20 is also shown, which exhibits the same phenomenon.
The changes of the average potential energy: the black and red lines are the average potential energies of all Zr and Fe atoms in Zr50Cu50 and Fe80P20 specimens, respectively. The circles and squares represent, respectively, the average atomic potential energy of Zr-atom and Fe-atom in the rearranging clusters. They are calculated from a series of snapshots of instantaneous morphology. The blue dashed lines are the schematics of fluctuation (rise and fall) of potential energy within the cluster. They are the conception in understanding why the average potential energy in a cluster is notably larger than the global average one and the energetics of nucleation and disappearance of a rearranging cluster.

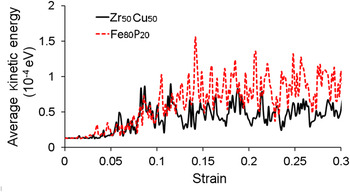
Figure 4 demonstrates the changes of average kinetic energy of atoms with strain of these two MGs, of which the peaks represent the nucleation and subsequent annihilation of plastic units. The small peaks of kinetic energy in the elastic regime indicate that the yielding point discerned from the stress–strain curve is not the incipient point of plastic deformation. Yielding actually indicates two phenomena: a relatively large peak induced by the formation of many plastic units and the stress level that activates the system and induces the continuous formation of many plastic units, manifested by many peaks in the curves of total kinetic energy. Reference Liu, Ruan and Zhang13 It is noted that both the frequency and magnitude of the peaks in the kinetic energy curve of Fe80P20 are much larger than those of Zr50Cu50, corresponding to larger plastic units in Fe80P20 as shown in Fig. 1. The higher peak means that the atoms in rearrangement accumulate more potential energy due to a larger barrier. The higher frequency means that the nucleation and annihilation of plastic units in Fe80P20 are faster than those in Zr50Cu50.
The variation of the average kinetic energy with strain for both Zr50Cu50 and Fe80P20.

C. The distribution of kinetic energy
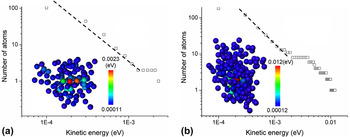
To understand the kinetics of these high kinetic energy clusters, we further analyze their details in the two MGs. Figure 5(a) shows the distribution of kinetic energy in a cluster of Zr50Cu50, in which the empty squares indicate the number of atoms with kinetic energy larger than the value indicated in the abscissa. The total number of atoms involved in the ZrCu cluster is 103, which is in line with the conception in theoretical and experimental works.
Reference Liu, Wang, Peng, Yu and Wang17,Reference Johnson and Samwer34
It is noted that there exists a large gradient of kinetic energy in the plastic unit. The core of the cluster is a Zr-atom and a Cu-atom with the kinetic energy of about 0.002 eV, an order of magnitude larger than that of other atoms in the cluster. It is conceived that the two atoms change their relative position swiftly causing the surrounding atomic structure to deform.
Reference Liu, Ruan and Zhang15
In the surrounding atoms, the distribution of kinetic energy can be fitted by the power law
 $P\left( E \right) \propto {E^{ - {\rm{\beta }}}}$
with β = 1.43. Compared with Zr50Cu50, the plastic unit of Fe80P20 involves more atoms (about 183) as shown in Fig. 5(b). The gradient of the kinetic energy in the Fe80P20 cluster is also much higher than that in Zr50Cu50. The maximum kinetic energy in the Fe80P20 cluster is almost 6 times larger than that of the Zr50Cu50 cluster and there are 8 atoms with the kinetic energy larger than 0.002 eV. Surrounding them, the distribution of kinetic energy in the rest of the atoms also follows the power law with a higher scaling factor β = 1.48. As aforementioned, the additional kinetic energy due to rearranging is owing to the potential energy barrier that is overcome. As the minima of the potential energy landscape (PEL) of Fe80P20 are much deeper than those in the PEL of Zr50Cu50, the resulting kinetic energy is much higher. However, both the Zr50Cu50 and Fe80P20 clusters share the same feature that the core of the plastic unit has several atoms with very large kinetic energy, which causes the reshuffling of the surrounding atomic structures.
Statistical distribution of the atomic kinetic energy and power-law fitting in (a) Zr50Cu50 and (b) Fe80P20 plastic units.

Further information of atomic rearrangement can be obtained by investigating the distribution of kinetic energy in the whole specimen. In an equilibrium isothermal system, the velocity distribution of atoms is Gaussian and the probability density function (PDF) of kinetic energy follows the χ2-distribution:
 $$f(E) = 2\sqrt {{E \over {\rm{\pi }}}} {\left( {{1 \over {kT}}} \right)^{3/2}}\exp \left[ {{{ - E} \over {kT}}} \right]\quad ,$$
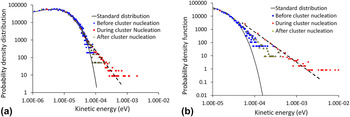
where k, T, and E are the Boltzmann constant, temperature, and kinetic energy of an atom, respectively. With Nose–Hover thermostat, the distribution of the kinetic energy in the MD system should follow this distribution. However, if the rearrangement occurs, the additional kinetic energy, induced by the release of the potential energy to the kinetic energy after crossing an energy barrier, leads to the bifurcation of PDF, as shown in Fig. 6(a) for the case of Zr50Cu50. Before a cluster nucleates, the PDF of kinetic energy follows the standard χ2-distribution. When several clusters nucleate, the distribution of kinetic energy bifurcates from the χ2-distribution to power-law distribution
 $f(E) \propto {E^{ - {\rm{\alpha }}}}$
with α = 1.96. The kinetic energy distribution can return to the χ2-distribution again after the rearrangement accomplishes since the additional heat is removed by the thermostat after some time. This is a process of local heat generation and dissipation due to the local rearrangement, indicating that the atomic rearrangement is dissipative. Similar bifurcation is also found in the case of Fe80P20 as shown in Fig. 6(b). Its scaling factor α = 2.77 is larger than that of Zr50Cu50, corresponding to the larger gradient of kinetic energy in the plastic unit of Fe80P20. The power-law distribution is the signature of self-organized-criticality systems,
Reference Bak, Tang and Wiesenfeld35
to which a MG at low temperature also belongs.
Reference Sun, Yu, Jiao, Bai, Zhao and Wang36
By comparing Fig. 6 with Fig. 5, it is clear that the bifurcation from the χ2-distribution to power law is owing to the rearrangement of atoms in the plastic units. It should be noted that if the nucleation of plastic units is temporally and spaciously homogenous, the two scaling factors α and β should satisfy α − 1 = β. Our results however deviate from this relation, which is probably caused by the dynamic heterogeneity.
Reference Rodney, Tanguy and Vandembroucq12
PDFs of kinetic energy during the nucleation and dispersion of clusters in (a) Zr50Cu50 and (b) Fe80P20.

D. Strain and strain rate of clusters
To quantify the deformation rate of the clusters, we calculate atomic deformation rate L defined by
 $${{\bf{L}}^i} = \left( {\mathop\sum\limits_j {{{\bf{d}}^{ij}} \otimes {{\left( {{{\bf{v}}^{ij}}} \right)}^T}} } \right).\left( {\mathop\sum\limits_j {{{\bf{d}}^{ij}} \otimes {{\left( {{{\bf{d}}^{ij}}} \right)}^T}} } \right)_{{R_{\rm{c}}}}^{ - 1}\quad ,$$
where d and v are the relative position and velocity vectors of the two atoms, respectively; superscripts i and j indicate the atom under consideration and the neighbor atom in the sphere of radius R
c centered at atom i, respectively; superscript T means transpose; and
 $\otimes$
is the dyadic operator. The atomic strain rate tensor is then the symmetric part of L, i.e.,
 ${\dot {\bf {{\tf="PSMP11"\char"65}} }} = {{\left( {{\bf{L}} + {\bf{L}}^T } \right)} \mathord{\left/ {\vphantom {{\left( {{\bf{L}} + {\bf{L}}^T } \right)} 2}} \right. \kern-\nulldelimiterspace} 2}$
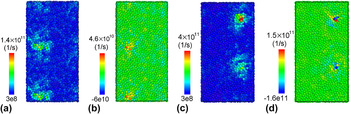
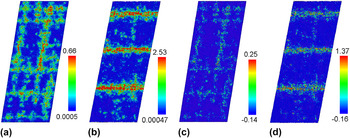
. One can then compare the equivalent shear strain rate and volumetric strain rate for these two MGs. The distribution of the equivalent shear strain rate in Zr50Cu50 with the applied strain being 0.0154 is plotted in Fig. 7(a). It is noted that the high kinetic energy clusters are also high strain rate regions in which the maximum strain rate is about 200 times larger than the applied strain rate. In addition, the positive volumetric strain rate inside the plastic unit is also very large as shown in Fig. 7(b), indicating the significant local expansion. It is noted that both the maximum equivalent shear and volumetric strain rate in Fe80P20 are about 3 times larger than those in Zr50Cu50, as shown in Figs. 7(c) and 7(d), in accordance with the larger gradient of kinetic energy as seen in Fig. 5(b). The comparison of Figs. 7(b) and 7(d) leads to the conclusion that the cavitation rate in Fe80P20 is greater. Since the plastic unit is of a very brief lifetime, this rate difference does not necessarily lead to the conclusion that the probability of cavitation in Fe80P20 is more significant.
Distributions of the equivalent shear strain rate in (a) Zr50Cu50 and (c) Fe80P20 and the volumetric strain rate in (b) Zr50Cu50 and (d) Fe80P20. In these figures, the applied compressive strains are 0.0154 for Zr50Cu50 and 0.035 for Fe80P20.

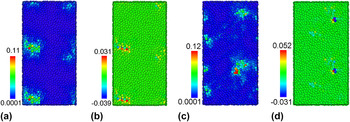
The atomic strain can also be calculated using OVITO Reference Stukowski32 based on the formula proposed by Shimizu et al. Reference Shimizu, Ogata and Li37 In the calculation, the reference configuration is that of the atomic system of 2 ps earlier than the current configuration, which leads to the strain increment in 2 ps. The local deformation gradient tensor F for each atom can be calculated from the relative displacements of the nearest neighbors within the given cut-off radius (0.5 nm). The Green–Lagrangian strain tensor is then obtained from the deformation gradient tensor F. Reference Shimizu, Ogata and Li37 The equivalent shear strain and the volumetric strain were then calculated and plotted, as shown in Fig. 8. Similar to the distribution of strain rate, the atomic strain increment also concentrates inside some plastic units within 2 ps. The difference of the maximum equivalent shear strain increment between the two MGs is less significant than that of the maximum strain rate, owing to the shorter lifetime of the Fe80P20 plastic unit than that of the Cu50Zr50. However, the maximum volumetric expansion in Fe80P20 is still much greater than that in Cu50Zr50, indicating a larger probability of cavitation in Fe80P20.
Distributions of the equivalent shear strain increment in (a) Zr50Cu50 and (c) Fe80P20 and the volumetric strain increment in (b) Zr50Cu50 and (d) Fe80P20. In these figures, the applied compressive strains are 0.0154 for Zr50Cu50 and 0.035 for Fe80P20.

E. Brittleness
Murali et al. Reference Murali, Narasimhan, Guo, Zhang and Gao25 have reported the cavitation phenomena in the shear band under tensile stress in Fe80P20 and ascribed this to the cause of brittleness. Our results indicate that the tendency of cavitation is more significant in Fe80P20 than in Zr50Cu50, even under compression. Defining the ratio of the internal strain rate in the plastic unit to the applied strain rate as a measure of the local velocity disturbance owing to the atomic rearrangement. The larger disturbance renders the larger probability to induce the nucleation and unstable propagation of a shear band. Reference Liu, Ruan and Zhang15 This accounts why Fe80P20 is more brittle than Zr50Cu50. First, the dynamic local rearrangement induces more significant disturbance in the velocity field, causing the more probability in triggering the propagation of shear bands. Second, the rearrangement-induced cavitation is more significant in Fe80P20, causing more alleviation of atoms (or inducing more free volume) in the shear bands.
For a further verification, a simple shear of larger atomic models (6 nm × 24 nm × 60 nm) is simulated for both the MGs. Figure 9(a) exhibits the increment of equivalent shear strain in Zr50Cu50 at the applied shear strain of 0.15. The reference is the configuration of the atomic system 30 ps earlier than the current configuration. It is noted that the plastic deformation is localized in some bands. These bands are the precursors of major shear band since they do not run across the sample. However, in Fe80P20, the catastrophic shear bands with the larger shear strain over the same 30 ps have formed as shown in Fig. 9(b). Figures 9(c) and 9(d) compare the volumetric strain distribution in both materials. It is striking that the cavitation in Fe80P20 is much more significant and is well within the catastrophic shear bands.
Distributions of the equivalent shear strain increment in (a) Zr50Cu50 and (b) Fe80P20 and the volumetric strain increment in (c) Zr50Cu50 and (d) Fe80P20. In these figures, the applied shear strains are 0.15 for Zr50Cu50 and 0.2 for Fe80P20. The difference is owing to the difference in their elastic limits as indicated in Fig. 2(a), which is about 0.05 for the simple shear case.

IV. CONCLUSIONS
In this paper, we have characterized the plastic unit of MG with the aid of MD analysis for two typical MGs: Cu50Zr50, which is macroscopically ductile in compression and Fe80P20, which is brittle. Our simulation results indicate that the size of the plastic unit of the brittle MG, Fe80P20, is much larger than that in Cu50Zr50. This is due to the deeper minimum in the PEL of Fe80P20 and the larger strain rate in the plastic unit. Shear banding can be more easily triggered in Fe80P20, and the subsequent larger cavitation inside shear bands leads to larger brittleness. By investigating the dynamics of atoms in plastic units, this work underpins the fundamental cause of the large variation of ductility of MGs.
Last, it is necessary to point out that MD simulation is rather unrealistic since the cooling rates and the strain rates are unrealistically high and the Nose–Hoover thermostat does not resolve the thermal conduction, particularly electronic conduction, in MG. These effects are hard to assess. Thus, the kinetic energy associated with a rearranging cluster as well as the local strain rate is only meaningful for a qualitative understanding of the mechanisms and should not be considered as realistic scenarios.
ACKNOWLEDGMENTS
The authors appreciate the Australian Research Council for its financial support to this work. This work was also supported by an award under the Merit Allocation Scheme on the NCI National Facility at ANU and computational resources provided by Intersect Australia Ltd.