Medical devices in the United States represent an eighty-billion dollars a year industry. At a time where healthcare costs absorb approximately 13 percent of the gross domestic product, the prospects of large profits and losses are thus substantial. For the U.S. Food and Drug Administration (FDA), the challenge is to regulate that industry both for safety and effectiveness. For the payers, it is to manage the costs as well as the benefits to the patients. FDA reviews devices based, in part, on clinical trial data submitted by manufacturers. FDA's decision to approve or reject a device is based on this statistical base. The medical technology industry thus faces large uncertainties until devices are tested in the actual environment. These could be reduced if firms performed an early technology assessment at the time when major investment and design decisions are made. Information at that stage allows changes that will improve the later performance of the device.
This study presents a quantitative model designed to provide relevant information in the early development stage. It extends the clinical base of evidence to include the fundamental characteristics and properties of the device and the procedures in which it will be used. The focus is on performance parameters including the risk of failure as assessed through engineering risk analysis methods. The model uses systems analysis and Bayesian probability and allows an early comparison of the planned device with alternative solutions, and to assess based on current information the prospects of its effectiveness, safety, and superiority over existing therapies. The first objective is to properly identify the main possible outcomes. The second is to represent the uncertainties unavoidable at that stage to support optimal engineering and financing decisions on the part of the firm, and later to provide useful additional information to the FDA as part of a Bayesian analysis of data (26).
Classic health technology assessment has focused on an economic analysis of the costs of the technology and on the benefits to the patient, either based on life extension or modified to reflect quality of life (for example, see Szczepura and Kankaanpää) (Reference Szczepura, Kankaanpää, Szczepura and Kankaanpää24). Such an analysis has generally been done once device-specific data are available. Only recently have researchers in that area begun to recognize that the analysis needs to be initiated earlier and that prevailing uncertainties in a device need to be analyzed during design and development to obtain optimal future results (5;6;12;13;18:21).
An assessment (risk analysis) at that early stage requires structuring the possible scenarios (costs and performance), computing their probabilities, and assessing their consequences (Reference Pietzsch, Paté-Cornell, Krummel, Spitzer, Schmocker and Dang20;Reference Pietzsch21). The decision analysis that is based on that risk analysis depends on the decision maker's preferences and risk attitude (risk-averse, risk-indifferent, or risk-prone) expressed, in classic economics, through a utility function. The next stage (decision support) is to represent the value of each option through an expected utility function. Classic axioms of rationality (Reference von Neumann and Morgenstern27) dictate the choice of the option that maximizes that expected utility. The method in the medical field was illustrated for instance by Eddy (Reference Eddy11). To support investment and design decisions at an early stage, the analyst must thus (i) identify performance and outcome measures most relevant for later evidence-based assessment, (ii) evaluate the possible spectrum of expected performance of the technology, (iii) identify the main drivers of product performance and of related critical outcome measures, and (iv) identify the optimal strategy for continuation and improvement of the device project given the firm's risk attitude.
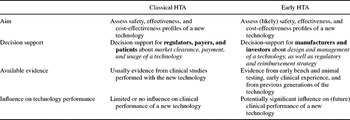
Probabilistic risk analysis (PRA) was developed to permit failure risk analysis, for example, in nuclear power plants, before the system has been operated long enough to provide sufficient statistics for a classic frequentist analysis (Reference Benjamin and Cornell2;Reference Henley and Kumamoto14;25). PRA has been expanded further to include human errors and management factors, which is critical to an analysis of the expected performance of medical devices (Reference Murphy and Paté-Cornell17). The data used in these analyses involve not only direct operational data that may be available for the different subsystems, but also surrogate data (e.g., the subsystems in a different environment), test data, engineering models and expert opinions. Note that FDA approval currently relies mostly on a classic statistical analysis of test results, although Bayesian statistics are beginning to gain acceptance to provide earlier information and reduce study size (26). The complete analysis of performance scenarios (including failures) presented here goes beyond the FDA's framework, data sources, and objectives. As noted earlier, it is designed mostly to support investment and design decisions at an earlier stage than classic health technology assessment (Reference Pietzsch21) (see Table 1).
Similarities and Differences between Classical HTA and Early HTA

GENERAL MODEL AND ATRIALSHAPER ILLUSTRATION
The probabilistic model described further allows computation of the performance of a device of particular characteristics per time unit, per operation, or for the duration of its expected use. To illustrate the concepts, the schematic example of the AtrialShaper is presented in parallel with the model.
The AtrialShaper is a device currently in the preprototype stage designed to reduce the chance of strokes in patients affected by atrial fibrillation (rapid, chaotic heartbeat). This condition increases the chances of formation of a clot in the left atrium of the heart (Reference Barnett, Eliasziw and Meldrum1;Reference Benjamin, Wolf and D'Agostino3). The device is expected to decrease that risk by reducing the size of the left atrial appendage where most clots occur. This size reduction, the primary effect of the technology, is achieved by heating and thereby shrinking the tissue of the appendage (Reference Powell, Riley and Troell23) by applying energy through the device's catheter-based radiofrequency (RF) electrode. The AtrialShaper system has not yet been fully developed and could thus not be clinically tested yet. As a result, there remain uncertainties regarding its future effectiveness, primarily stemming from the degree of tissue shrinkage that is achievable in the human heart in general, and with different possible designs of the device in particular. In a classic statistical context, one would be forced at this early stage to claim complete ignorance about the future performance of the device and, thus, limit the basis for informed decision making about design and management of the technology. Yet, for example, data related to RF-induced shrinkage of tissues are available for other applications in humans and animals. These data can serve as valuable inputs in an early assessment. The principle of the analysis presented here is to aggregate those available data to obtain distributions of key parameters of the overall model and to use these estimations to compute the distribution of expected device performance.
The objectives of the general model are first to assess and analyze a given or intended system, and second, to assess different improvements of that system's design. To perform a complete analysis of the effects of the design on anticipated (and uncertain) market performance requires a decomposition of the physical system into its different parts, for which one may have partial data. It also requires, at a higher level, four submodels: the underlying technical model, a clinical model (eg, representing the patient's characteristics), a managerial model (eg, representing the required degree of training of the technology's users), and a performance model capturing the costs, risks, and benefits of the device in the long run. The problem is thus, first, to structure a set of (exhaustive and mutually exclusive) outcomes of interest. Second, it is to compute their probabilities conditional on the realizations of the different effects (primary, intermediate, and so on) and on the patient's anatomical and physiological parameters, which determine the probability of each outcome scenario. The structure of that model is represented by the influence diagram of Supplementary Figure 1 (available online at http://www.journals.cambridge.org/jid_thc). An influence diagram is a directed graph representing dependencies among decision variables (rectangular nodes), state variables (oval nodes), and outcome variables (diamond-shaped nodes). Each variable is also represented by a table showing its realizations and, when applicable, marginal and conditional probability distributions (Reference Howard, Matheson, Howard and Matheson15).
To support the concepts, consider the influence diagram of Supplementary Figure 2 (available online at http://www.journals.cambridge.org/jid_thc), which represents that model structure for the case of the AtrialShaper. The problem is then to compute the probabilities of the different possible outcomes. The notations are (i) p(.), probability mass (for discrete random variables); (ii) p(x | y), conditional probability of parameter value x given parameter value y; (iii) p(x, y), joint probability of parameter values x and y; (iv) O, outcome of interest (random variable; realizations indexed in i); (v) PE, primary effect (random variable; realizations indexed in j); (vi) IE, intermediate effect (one or several) (random variable; realizations indexed in k); (vii) AN, anatomical parameter of the patient (random variable; realizations indexed in l); and (viii) TP, technology parameter (decision variable; options indexed in n).
For the AtrialShaper, these variables include the actual degree of tissue shrinkage (primary effect), the reduction of the appendage orifice area, the degree of clot formation and embolization with the procedure (intermediate effects), and the risk of atrial fibrillation-related strokes with the procedure (outcome).
The next step is the classic computation of the probability of the different outcomes Oi based on the dependences represented in the influence diagram. In the case where there is no functional relationship among the different random variables, the dependences are simply represented by the conditional probabilities of each variable given the realizations of those that precede them in the influence diagram. Therefore, for a given choice of a technology parameter option TP and for the dependences shown in Supplementary Figure 1, the probability of outcome i is:
![$\begin{eqnarray}
{\rm p}({\rm O}_{\rm i} \,{|}\,{\rm TP}_{\rm n}) &=& \Sigma _{\rm j} \Sigma _{\rm k} \Sigma _{\rm l} \Sigma _{\rm m} [{\rm p}({\rm PE}_{\rm j} \,{|}\,{\rm TP}_{\rm n})\nonumber\\ [5pt]
&&\times\, {\rm p}({\rm AN}_{\rm l}) \times {\rm p}({\rm IE}_{\rm k} \,{|}\,{\rm PE}_{\rm j}, {\rm AN}_{\rm l}) \times {\rm p}({\rm O}_{\rm i} \,{|}\,{\rm IE}_{\rm k})
\end{eqnarray}$](https://static.cambridge.org/binary/version/id/urn:cambridge.org:id:binary:20160921054823092-0741:S0266462307080051:S0266462307080051_eqn1.gif?pub-status=live)
If, as in the case of the AtrialShaper, there exists a functional relationship among the random variables of the problem, the probability distribution of the outcomes depends on that relationship and on the distributions (marginal or conditional) of each of the variables. In that case, the general equation that yields the probability of the outcomes for the considered technological choice one can then write:

For example, in the case of the AtrialShaper, the actual degree of tissue shrinkage (primary effect) can be represented as the product of the achievable degree of tissue shrinkage (TS) and a measure of the effectiveness of the electrode (EE). Other functional relations for that example are presented in the next section. Note that probabilities are represented here by a discrete set of realizations, but that the model can be immediately generalized to the case of continuous variables. These results can be compared to the performance of the status-quo treatment (effectiveness ε in Figure 1 below).
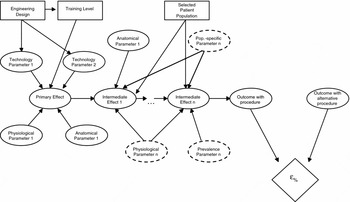
More complete influence diagram representation of AtrialShaper example.

The model can be further developed to include a number of management decisions and their effects on the outcome. Figure 1 represents, in an influence diagram, a more complete decision analysis model that includes engineering design choices, training of the users, and the selection of a population of patients for whom the device is intended.
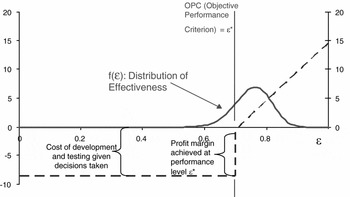
As usual in decision analysis models, the choice of the best alternative (here of a set of engineering and management options) relies on a utility function representing the risk attitude and the value function of the decision makers. From the perspective of a medical device firm, the decisions of the FDA hinge upon thresholds of acceptance that affect the probability of economic performance of the firm's investment in each device (some are known, others can only be educated guesses). The uncertainty is whether or not a device will meet the specific criterion. The probabilities and the consequences of different outcomes (including FDA's actions) and the utility function of the firm for these different outcomes determine the expected utility of the different options and permits identification of the best one. Figure 2 represents on the same graph the distribution of the device effectiveness f(ε) and the financial profit (net present value).
Joint graph of distribution of effectiveness and value function. Note that this graph is illustrative only.

As shown in Figure 2, it is assumed in this illustrative example that the FDA uses a specified objective performance criterion ε* as a threshold of acceptance (based on example in Fig. 2). The cost of development and testing depends on the chosen set of decision alternatives. The profit margin is a random variable, which, as shown in Figure 2, depends on the effectiveness level actually achieved and the criterion used by the FDA. The value of the investment to the firm is its certain equivalent of the “lottery” played when deciding on an investment. Noting u(.) the utility of the firm for any net present value of an investment outcome, and Eu*(Device) the expected utility of the investment outcome with optimal engineering and management choices, that certain equivalent (or value of the investment) is u−1[Eu*(Device)]. Of course, the key issue here is whether or not the device is approved by the FDA. That uncertainty is represented in Figure 2 both by the threshold ε* and by the probability distribution of the device effectiveness (f(ε)). In summary, the complete modeling approach involves several steps serving different purposes to support the main decisions of the firm.
Assessment of the Existing System
Steps 1–4: Construct the initial model structure, decompose the model into submodels to allow the relevant experts to focus on each of them, re-assemble the model for a final assessment of the probability distribution of the different outcomes, and assess the effectiveness of the current proposal for the device.
Evaluation of System Improvements
Steps 5 and 6: Identify the spectrum of engineering and management options and compute the distribution of system's performance outcomes for the different combinations of options. Identify the optimal set of choices that maximizes the expected utility of the firm's decision makers.
Decision to Continue the Project
Step 7: Compare the results for the best choice of project-related alternatives (distribution of losses, certain equivalent of the investment returns) to a threshold of risk acceptable by the firm.
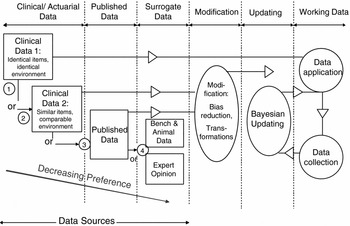
The key to the quality of the results is the use of the existing data, and an accurate description of the limitations of current knowledge. As shown in Figure 3, the data come from three main sources and generally need to be updated to represent the case of interest.
Overview of data sources and schematic application.

Clinical or actuarial data are seldom available in this case for the whole system but may exist for subsystems. They are gathered, wherever possible, from experience with identical items, in identical applications and environments. In addition, there may be published data that have been gathered by other research groups on parts of the problem. Finally, surrogate data including animal testing and expert opinions can be a useful addition to the experience base as part of the firm's decision support.
The next step is to update the existing data to reflect the case of the device evaluated. This step may include data modification to adjust the information from one environment to another, a species to another or to reflect a different application of a technology (for example, later, we use information related to pig tongue tissue as part of the data used to assess the behavior of human heart tissue). In that process, some experts “discount” the data (reduce their effect), for instance by increasing the higher moments of their probability distributions to better represent the uncertainties.
The framework presented here to update and aggregate the data is designated in what follows as Probability Aggregation for Medical Device Assessment (PRAMDA). It is based on a linear formula of aggregation of the different probability distributions gathered from different sources for a given parameter (θ) of the risk assessment model of the medical device as described earlier. A similar procedure is performed, if needed, for each model parameter. The probabilities from the different sources (plus an uninformative, neutral default distribution) are aggregated by a simple linear function based on weights that reflect the quality, applicability, and reliability of the data from different sources. The result is a probability distribution f(θ) representing the best judgment of the analyst regarding the uncertainties about the parameter θ in this initial phase. Later, this distribution can be used as a prior in a Bayesian updating, as new information becomes available. Figure 3 represents this linear aggregation process.
This aggregation formula is supported by experts in the field of decision analysis for several reasons, essentially because it satisfies some basic requirements such as the unanimity property (if sources agree, the result must reflect that) and the marginalization property (the order of data inclusion does not matter) (Reference Clemen7;Reference Clemen and Winkler8). The alternative to this linear aggregation is to perform a true Bayesian updating. This process would require a more complex estimation of the likelihood functions, that is, the probability of obtaining the results of the different statistical data sets conditional on possible hypotheses about the system's true state (or the “true” value of distributions' parameters).
THE CASE OF THE ATRIALSHAPER
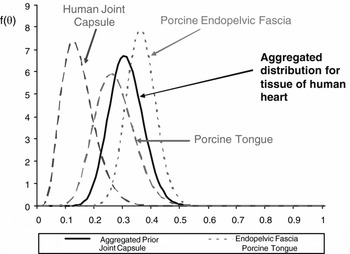
This method of data aggregation and of their use in a risk analysis model can be illustrated by the case of the AtrialShaper described earlier. As indicated earlier, although no results or testing about length reduction of cardiac tissues when exposed to radiofrequency energy have been published yet, there are a number of results available from other applications in human and animal models. One is an extensive study of the effect of radiofrequency energy on the length and temperature properties of the human glenohumeral joint capsule (Reference Pietzsch, Paté-Cornell, Krummel, Spitzer, Schmocker and Dang20). The second is a pilot study that measured the reduction by radiofrequency energy of the length of pig tongues (the objective of that study being to contribute to the treatment of obstructive sleep apnea syndrome) (Reference Powell, Riley and Troell22). The third is a study of the use of radiofrequency energy to shrink the endopelvic fascia in pigs (the objective being to treat stress urinary incontinence in humans) (Reference Dmochowski and Galen10). For each of the three main studies, Beta distributions have been fitted to represent the uncertainties about the achievable degree of tissue shrinkage derived from the study results (see Supplementary Table 1, which is available online at http://www.journals.cambridge.org/jid_thc).
The next question is to decide what weight to apply to each of the input distributions considered in Supplementary Table 1 to obtain a distribution representing the human heart tissue shrinkage expected from the AtrialShaper. This is where the analyst has to decide on the relevance of each data set to the problem at hands. The judgment is made here that given the nature of the tissues involved, the two porcine studies are equally relevant (weights w2 and w3), and more informative for the human heart tissue than the tissues of the human glenohumeral joint capsule (weight w1). Therefore, a possible set of weights is w1 = 0.2, and w2 = w3 = 0.4. The posterior distribution for the achievable tissue shrinkage for the AtrialShaper can thus be assessed as:

with the following indices: aggr, aggregated for human heart; sj, human shoulder joint; pt, porcine tongue; and ef, porcine endopelvic fascia.
Supplementary Figure 3 (available online at http://www.journals.cambridge.org/jid_thc) represents the three data distributions and the aggregated distribution. This distribution (Beta[18.2, 41.9]) is then used in the model presented earlier to describe the shrinkage of the tissue of the human heart.
In the model, the parameter θ represents the tissue shrinkage TS. Other parameter distributions (eg, the EE) are obtained in a similar way, or computed through the functional relationships shown in Supplementary Table 2 (available online at http://www.journals.cambridge.org/jid_thc). The resulting distributions (or constant values) for the parameters of the AtrialShaper base-case model are presented in Supplementary Table 3 (available online at http://www.journals.cambridge.org/jid_thc). Note that, unless directly determined by the aggregation framework or engineering model, the distribution parameters were obtained by least-squares fitting to the source data.
The result of the overall base-case model is obtained by a Monte Carlo simulation involving 100,000 trials. The outcome measure is the difference between the probability of stroke with and without the tissue shrinkage provided by the AtrialShaper. In the base-case, the reduction in stroke risk can be represented by a Beta distribution (distribution parameters 46,38) with an expected value of approximately 55 percent and a standard deviation of 0.062. The distributions of input and output parameters are represented in Supplementary Table 4 (available online at http://www.journals.cambridge.org/jid_thc).
The output of the model is the probability distribution of the reduction of stroke risk for the base-case (current design and technology). Figure 4 shows the results for the base-case of the AtrialShaper technology assessment performed in this study, and for the alternative pharmaceutical treatment options of blood thinners aspirin (Reference Barnett, Eliasziw and Meldrum1) and warfarin (Reference Laupacis, Boysen and Connolly16). This figure also includes demonstration of the effects on the results of changes in the distribution of tissue shrinkage (variations of the weights of the distributions based on available study results), one highly pessimistic (mean shrinkage 13.7 percent) and one highly optimistic (38.8 percent).
Three distributions for the degree of tissue shrinkage and aggregated distribution.

These results can support three decisions. The first is a design decision involving an alternative electrode design. It is less expensive, but it is not considered as effective as the base-case electrode design. The second decision involves the level of training and certification of the practitioners. It is estimated by experts that such improvements could increase the electrode's effectiveness by approximately 10 percent. The third one focuses on the selection of patients with a smaller atrial appendage orifice, which increases the probability of success of the use of the AtrialShaper (while at the same time limiting the eligible patient population). The effects of these decisions on the values of the model parameters are shown in Supplementary Table 5 (available online at http://www.journals.cambridge.org/jid_thc). The model shown earlier in Figure 1 is then used to compute for these new inputs the effectiveness of the device (ie, percentage difference in stroke risk) for the “average” patient.
Finally, the benefits of the technology using a linear value function (risk neutrality) for the utility of the decision maker regarding the outcome are presented in Supplementary Figure 4 (available online at http://www.journals.cambridge.org/jid_thc). It represents on the same graph, the distribution of the reduction in the probability of strokes, and the (linear) value of the profits of the firm for the base-case. Note that all cost figures used here are illustrative. The decision maker can then use the model and relevant cost information to assess alternative technologies and management procedures. One option is the use of different electrode types (design factor), the other the improvement of user training (managerial factor). Supplementary Figure 5 (available online at http://www.journals.cambridge.org/jid_thc) shows the probability distributions of stroke risk for the three considered alternatives. Supplementary Table 6 (available online at http://www.journals.cambridge.org/jid_thc) shows a summary of costs, performance, and the resulting expected value of the three considered alternatives.
The analysis shows that alternative 3, increasing both the electrode effectiveness and the training of the user, results in the maximum expected value of the investment (Supplementary Fig. 6, which is also available online at http://www.journals.cambridge.org/jid_thc). It should be noted that the results are very sensitive to the probability distribution of tissue shrinkage assumed in the model. Supplementary Table 7 (available online at http://www.journals.cambridge.org/jid_thc) shows the results of that sensitivity analysis.
CONCLUSIONS
The process of innovation in medical devices is critical to the improvements in patient care, but it is costly and uncertain. Design and management decisions have to be made by medical device firms and their investors before the clinical performance of the device is actually known. Their assessment of market success is at the heart of these decisions, which hinge upon regulatory approval, reimbursement, physician and providers' acceptance, the competition, and the company's marketing strategy. Device performance and patient outcomes are the primary measures affecting all of these factors and should thus form the core of any model building. Uncertainties about the profit of the firm have been captured here in a risk analysis model based on systems analysis and probability. One key issue is the use of all available information at the time that decision is made. The general model presented allows assessment of the probabilities of the outcomes associated with engineering design and management decisions, and of the benefits of a specific medical device. This analysis is meant to be performed in the early stages of the development phase based on data of different sources. The aggregation of these data is performed through a linear function, which represents their respective relevance and reliability. When additional data become available, the resulting probability distribution can be used as a prior in a Bayesian updating.
POLICY IMPLICATIONS
The overall model, as illustrated in this study, provides an expansion of the evidence base to support the decisions of device manufacturers and investors before comprehensive statistics are available. In the future, these model results may also be helpful to regulators as a complement to (and an extension of) the statistical information available to them. Similarly, current efforts by regulators and industry to create lifecycle risk management models can benefit from the presented approach.
CONTACT INFORMATION
Jan B. Pietzsch, PhD (pietzsch@stanford.edu), Consulting Assistant Professor, Department of Management Science and Engineering, Stanford University, 380 Panama Way, Stanford, California 94305-4026; President and CEO, Wing Tech Inc., 502 San Benito Avenue, Menlo Park, California 94025
M. Elisabeth Paté-Cornell, PhD (mep@stanford.edu), Professor and Chair, Department of Management Science and Engineering, Stanford University, 380 Panama Way, Stanford, California 94305-4026
This work was funded in part by the Pediatric Research Fund of the Stanford University School of Medicine and by the Burt and Deedee McMurtry Fellowship in Stanford University's School of Engineering.