Introduction
Titanium dioxide (TiO2–titania) is one of the most used semiconductors in the photocatalysis field [Reference Li, Zhao, Shindume Lomboleni, Huang and Peng1, Reference Liu, Su, Zhang, Wang, Yang, Shen, Deng, Zhang and Zhang2, Reference Lyu, Liu, Wang and Tian3, Reference Li, Han, Wang, Zheng, Wan and Ni4, Reference Zhang, Wang, Liu and Li5, Reference Li, Yu, Jaroniec and Chen6, Reference Wang, Liu and Nakata7]. Besides exhibiting versatile preparation methods, titania also shows adjustable properties such as specific surface area (SSA), particle size, and photocatalytic activity. Rutile, anatase, and brookite are the main polymorphic phases of titania [Reference Wu, Lo, Song, Vijayan, Li, Gray and Dravid8]. Brookite is barely studied for photocatalytic applications due to its instability under normal conditions of temperature and pressure [Reference Liu, Zhao, Andino and Li9]. Although anatase exhibits a wider band gap than rutile (3.20 versus 3.03 eV), the former displays a larger photoactivity [Reference Xu, Gao, Moreno, Kunst, Muhler, Wang, Idriss and Wöll10]. This behavior seems to be related to several factors. Some authors report that anatase has a higher adsorption capacity, smaller particle size, and larger SSA than rutile [Reference Hanaor and Sorrell11]. Moreover, it has been suggested that anatase exhibits a slower recombination rate of charge carriers when compared to rutile, which increases the concentration of photogenerated electrons and holes on the anatase surface. All these factors account for the enhanced photoactivity of anatase when compared to rutile [Reference Zhang, Zhou, Liu and Yu12]. It is reported that the photoactivity of TiO2 is greatly affected by its crystal structure, particle size, and surface area [Reference Li, Zhao, Shindume Lomboleni, Huang and Peng1, Reference Ji, Qiao, Huang, Zhang, Wu, Miao, Liu, Dong, Zhu and Qiu13].
The sol–gel processing deserves to be highlighted among the techniques commonly used to prepare titania. This wet chemical route allows fabricating samples with tailored composition, pore structure, and surface chemistry [Reference Brinker and Scherer14]. The synthesis conditions of titania have a great influence on its structure. For instance, Xu et al. [Reference Xu, Zheng and Liu15] reported that the solvent type used in the fabrication of SiO2–TiO2 composites has a strong influence on the crystallinity of the prepared materials. They reported that specimens obtained with ethyl alcohol (EtOH) exhibited an improved photoactivity. The authors attributed this finding to the large pore volume and pore size of these samples in addition to the coexistence of anatase and rutile in their structure. Indeed, it was reported that there is an increase in the photoactivity of TiO2 when it contains both rutile and anatase. This behavior is ascribed to an exchange of electrons and holes between these phases, which extends the lifetime of the photogenerated charge carriers [Reference Ohno, Tokieda, Higashida and Matsumura16, Reference Scanlon, Dunnill, Buckeridge, Shevlin, Logsdail, Woodley, Catlow, Powell, Palgrave, Parkin, Watson, Keal, Sherwood, Walsh and Sokol17]. Mahyar and Amani-Ghadim [Reference Mahyar and Amani-Ghadim18] reported that sol–gel–derived TiO2 nanoparticles prepared with isopropyl alcohol (IsoprOH) displayed smaller sizes than samples obtained using either methyl alcohol (MeOH) or EtOH. Nonetheless, they also noticed that specimens prepared with EtOH exhibited the highest photoactivity among the obtained samples. Behnajady et al. [Reference Behnajady, Eskandarloo, Modirshahla and Shokri19] observed that TiO2 samples obtained with titanium(IV) isopropoxide (TIPT) showed higher photocatalytic activity than materials derived from titanium n-butoxide (TBT). Moreover, it was noted that MeOH gave rise to samples with higher photoactivity than either EtOH or IsoprOH. On the other hand, some authors have reported that IsoprOH-derived TiO2 samples may exhibit higher photocatalytic activity than materials obtained with MeOH or EtOH [Reference Alonso, Montequi and Cocero20, Reference Andrés, López, Esperanza, Gómez, Hurtado, Azucena and Duarte21, Reference Wu and Tai22]. Therefore, there is no agreement in the literature regarding which solvent is the most suitable one to obtain TiO2 samples with improved photocatalytic behavior.
Carbon-based materials such as carbon nanotubes and reduced graphene oxide (RGO) have also been usually combined with titania aiming to improve the photocatalytic activity of the latter [Reference Li, Yu, Wageh, Al-Ghamdi and Xie23, Reference Li, Shen, Ma, Chen and Xie24, Reference Ghayoor, Keshavarz and Soltani Rad25, Reference Hu, Yan, Wang, Chai and Li26]. It has been reported that these materials display a highly negative surface, which leads to an efficient exchange of charge carriers between the carbon-based material and TiO2 [Reference Pastrana-Martínez, Morales-Torres, Likodimos, Figueiredo, Faria, Falaras and Silva27, Reference Sher Shah, Park, Zhang, Park and Yoo28]. In this study, we prepared TiO2-RGO nanocomposites by hydrothermal treatment. We used either IsoprOH or EtOH as the solvent in the preparation of TiO2. As far as we know, this is the first time the influence of the solvent type on the structural and photocatalytic properties of TiO2-RGO nanocomposites is investigated. This work is supported by a series of experimental tests, including N2 adsorption, X-ray diffraction (XRD), Raman spectroscopy, ultraviolet–visible (UV-Vis) spectroscopy, transmission electron microscopy (TEM), and selected area electron diffraction (SAED). The photocatalytic activity of the fabricated materials was assessed according to the photodegradation of methylene blue (MB) under ultraviolet (UV) illumination.
Results and discussion
Structural characterization
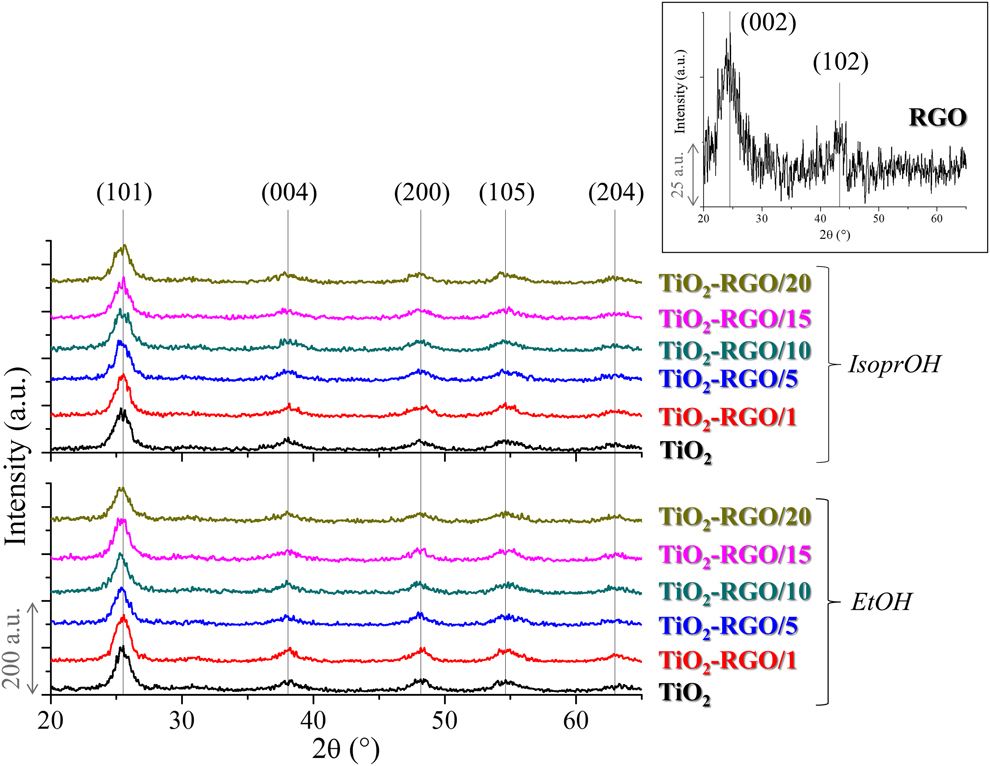
Figure 1 depicts XRD patterns of samples prepared with either EtOH or IsoprOH. The insert shown in this figure depicts the XRD pattern taken for RGO. The broad XRD lines observed in this insert at about 24 and 43° are ascribed to the (002) and (102) crystal planes of RGO [Reference Gupta, Kumar, Panda, Kanan, Joshi and Visoly-Fisher29], indicating the existence of a few monolayered RGO sheets [Reference Pei and Cheng30]. Indeed, previous studies revealed that the RGO sheets prepared herein are well dispersed and show thicknesses below 1 nm [Reference Gonçalves, Palhares, de Souza, de Castro, Silva, Houmard and Nunes31]. The lines highlighted in the XRD patterns of TiO2 and TiO2-RGO are due to crystal planes of anatase, revealing that it was the only crystalline phase observed in these samples. Figure S1 (Supplementary material) displays the crystallite size of TiO2 estimated from the Scherrer equation. It can be observed that samples prepared with EtOH displayed larger crystallite sizes than those obtained with IsoprOH. A similar finding was also reported by Mahyar and Amani-Ghadim for pure TiO2 samples [Reference Mahyar and Amani-Ghadim18]. It was also observed a general tendency of the crystallite size to decrease when the RGO loading is increased, regardless of the solvent used in the fabrication of TiO2. It is well established that the alcohol used in the preparation of TiO2 effectively participates in ligand exchange reactions and influences the diffusion of positively charged Ti(OH)x(OR)yn+ species arising from the hydrolysis of TIPT. As EtOH shows higher polarity, smaller boiling point, and lower viscosity than IsoprOH [Reference Wiranwetchayan, Promnopas, Thongtem, Chaipanich and Thongtem32], the former accelerates the hydrolysis of TIPT and improves the diffusion of Ti(OH)x(OR)yn+ species, which can lead to larger TiO2 particles. Besides, as IsoprOH has a larger molecule size than EtOH, one could hypothesize that the steric hindrance promoted by IsoprOH could keep the TIPT molecules apart, leading to smaller TiO2 crystallites.
XRD patterns of RGO, TiO2, and TiO2-RGO composites. The JCPDS file number 21-1272 was used as the reference for anatase. Please refer to the online version of this article to see this figure in color.

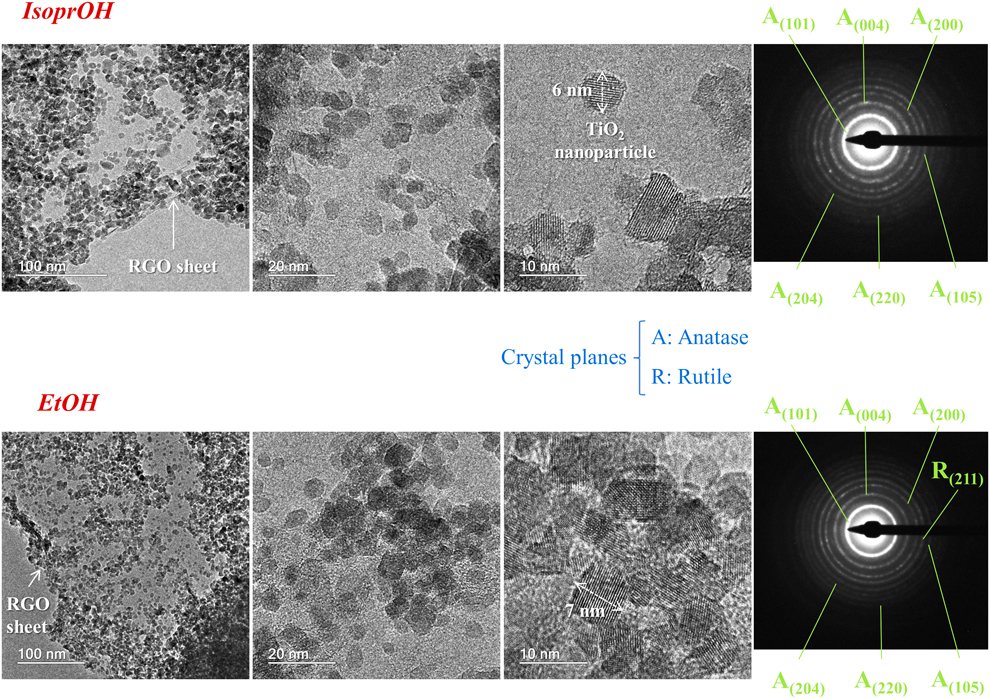
Figure 2 shows TEM micrographs and SAED patterns obtained for IsoprOH- and EtOH-derived TiO2-RGO nanocomposites. Both samples were prepared using an RGO loading of 1 wt%. It can be observed that TiO2 nanoparticles were anchored onto RGO sheets after the hydrothermal treatment. Moreover, TiO2 nanoparticles with sizes of about 6–7 nm are noticed in those micrographs. These values are in accordance with the crystal size assessed from the Scherrer equation (Fig. S1, Supplementary material). The SAED pattern of the IsoprOH-derived sample displayed Debye–Scherrer concentric rings related to the (101), (004), (200), (204), (220), and (105) crystal planes of anatase. On the other hand, the EtOH-derived composite showed an additional Debye–Scherrer ring associated with the (211) crystal plane of rutile. This result reveals that a small concentration of rutile may be present in the lattice of EtOH-derived samples. The diffraction peaks ascribed to rutile could not be resolved in XRD because the detection limit of this technique is around 3–5 wt% [Reference Nasrollahzadeh, Sajadi, Rostami-Vartooni and Khalaj33]. The presence of rutile in the TiO2-RGO composites may be another structural parameter that contributes to the distinct properties exhibited by samples prepared with either IsoprOH or EtOH.
TEM micrographs and SAED patterns of IsoprOH- and EtOH-derived nanocomposites. Both specimens were obtained with an RGO loading of 1 wt%. The scale bars displayed in TEM images correspond to 100, 20, or 10 nm.
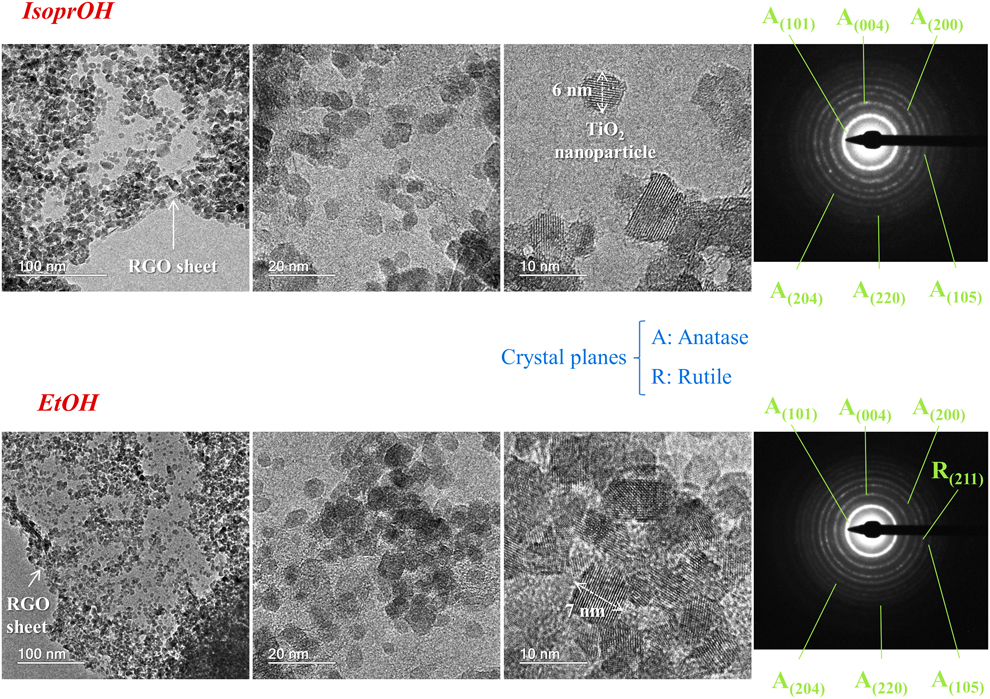
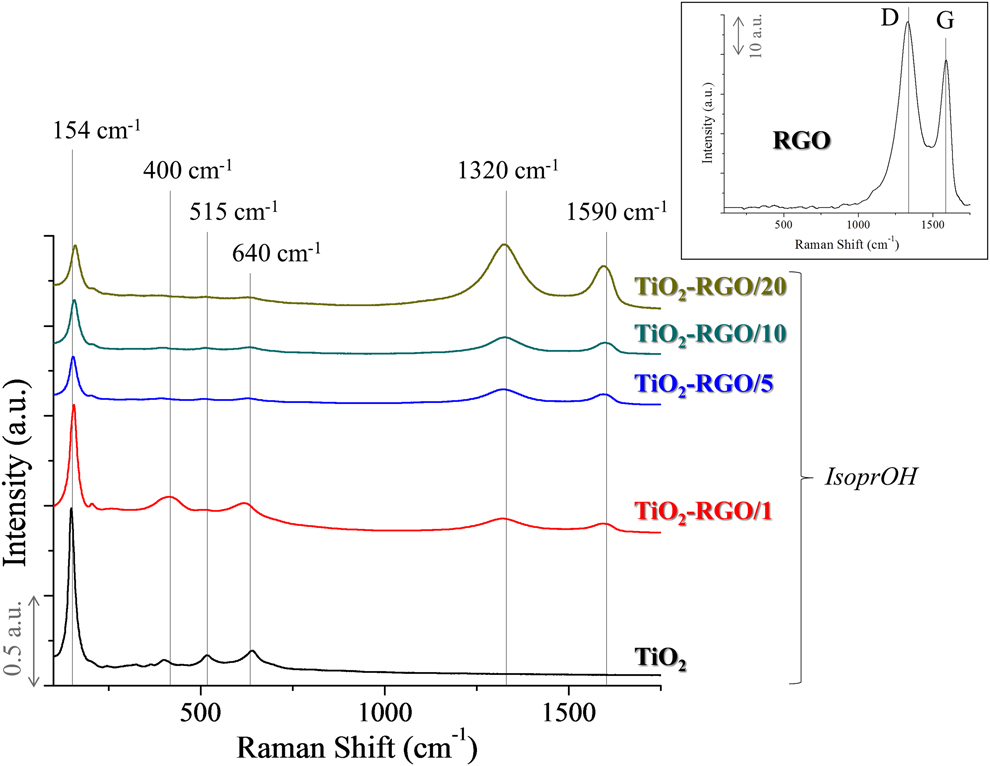
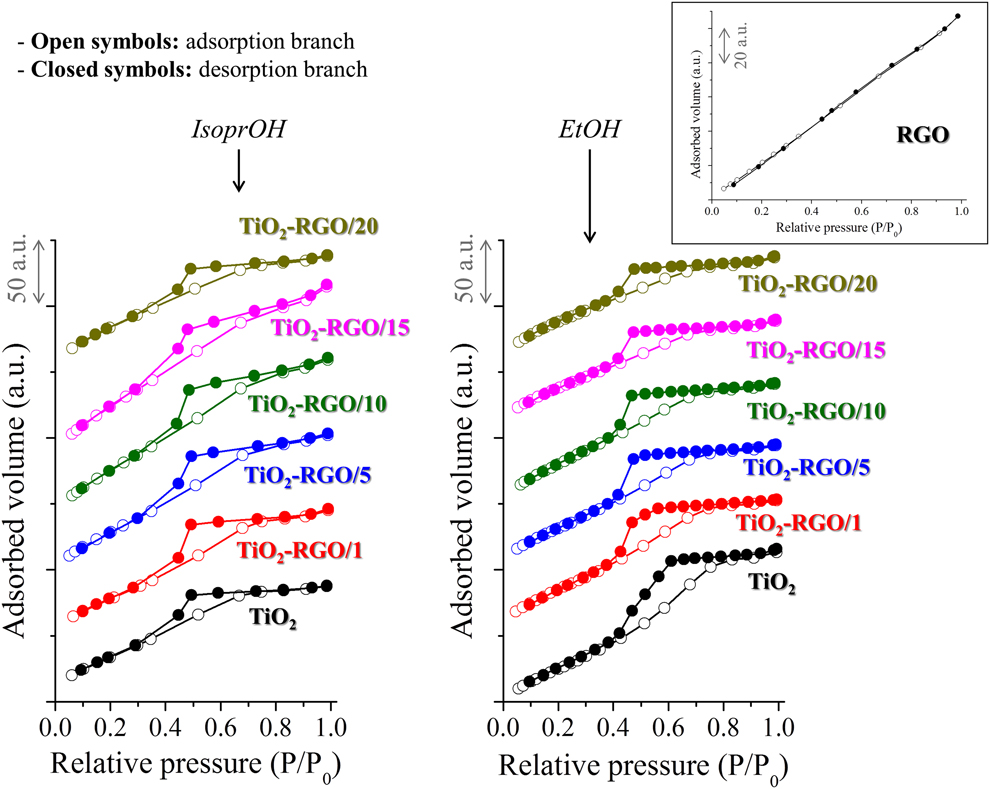
Figure 3 shows the Raman spectra of IsoprOH-derived samples. Similar spectra were also observed for materials prepared with EtOH (not shown in this work). E g, B1g, B1g + A1g, and E g vibration modes of anatase are observed [Reference Zhu, Liu and Ding34, Reference Song, Zhang, Sun, Cui and Lin35] at 154, 400, 515, and 640 cm−1, respectively. The bands at about 1320 and 1590 cm−1 are ascribed to the D and G bands of graphene. The D band is due to defects in the network of graphene, whereas the G band is related to in-plane vibrations of sp 2-bonded carbon atoms [Reference Lucchese, Stavale, Ferreira, Vilani, Moutinho, Capaz, Achete and Jorio36, Reference Zhang, Zhang, Tang and Xu37]. It can be noted that these absorption bands become more noticeable when the loading of RGO in the composite is larger. All examined samples displayed a ratio between the D and G bands above 1, which may suggest the occurrence of fragmentation of sp 2 domains during the hydrothermal treatment [Reference Liang, Cui, Hub, Wang, Xu, Ying, Li, Lu and Shen38]. Figure 4 depicts the N2 adsorption isotherms obtained in this study. Pure TiO2 and TiO2-RGO composites displayed type IV isotherms, for which, it is observed as a wide hysteresis loop related to the capillary condensation of N2. This behavior reveals that these materials exhibit a mesoporous structure [Reference Sing39]. On the other hand, for RGO, a steady increase in the amount of N2 adsorbed throughout the examined pressure range was observed, and no hysteresis loop was noticed. This behavior can be related to the degas step of samples before the N2 adsorption tests, which leads to the stacking of RGO sheets. When RGO is dispersed in water, the RGO sheets are kept deagglomerated due to the presence of functional groups on their surface [Reference Castro, Neves, Pereira, Assis, Montoro and Silva40]. Nonetheless, this effect is no longer observed after drying the RGO aqueous dispersion. The stacking of RGO sheets is less noticeable for nanoparticles-containing materials because they act as a spacer between the RGO sheets, inhibiting the sheets stacking after drying the dispersion [Reference Tancredi, Moscoso Londoño, Rivas Rojas, Knobel and Socolovsky41].
Raman spectra obtained for IsoprOH-derived materials. Inset: Raman spectrum collected for RGO. Please refer to the online version of this article to see this figure in color.

N2 adsorption isotherms obtained for samples prepared with either IsoprOH or EtOH. Inset: adsorption isotherm taken for RGO. Please refer to the online version of this article to see this figure in color.

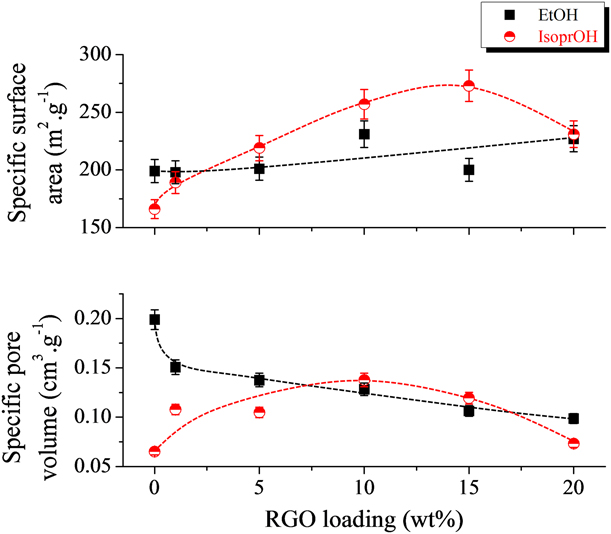
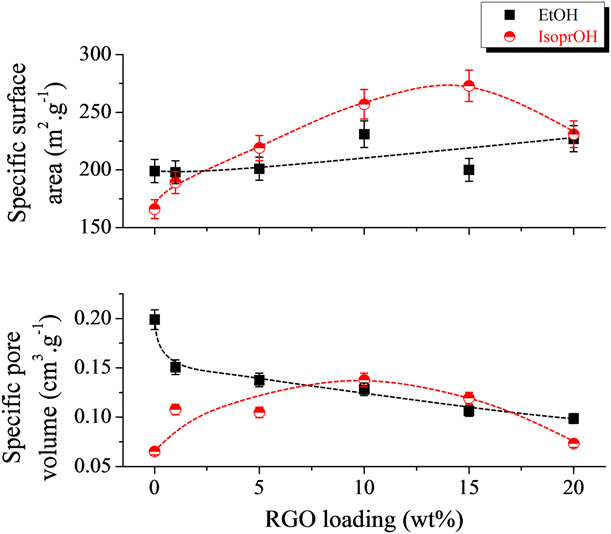
Figure 5 shows the SSA and specific pore volume (SPV) as a function of the RGO loading. Dramatic changes in these parameters are noticed when TiO2 is blended with RGO. Pure TiO2 exhibited smaller SSA and SPV when prepared with IsoprOH. A noticeable increase of SSA was observed for IsoprOH-derived samples when the RGO concentration was increased from 0 (166 ± 8 m2/g) to 1 (189 ± 9 m2/g), 5 (219 ± 11 m2/g), 10 (257 ± 13 m2/g), or 15 (273 ± 12 m2/g) wt%. However, a further increase of the RGO loading to 20 wt% decreased SSA to 231 ± 12 m2/g. A similar trend was observed for SPV in IsoprOH-related samples. Materials prepared with EtOH were also affected by the incorporation of RGO. The increase of the RGO loading from 0 to 20 wt% slightly increased SSA. Nonetheless, SPV tended to decrease for the EtOH-derived samples when the RGO loading was increased. It can be observed that TiO2-RGO composites exhibiting RGO concentrations ranging from 5 to 15 wt% displayed larger SSA than samples prepared with IsoprOH. Nonetheless, composites displaying RGO loadings of either 1 or 20 wt% showed similar values of SSA, regardless of the solvent used in the sol–gel preparation of TiO2. The increase of SSA when RGO is added to titania can be associated with a deagglomeration of the TiO2 nanoparticles. The presence of RGO sheets among these nanoparticles promotes their deagglomeration, which increases SSA. Nonetheless, the stacking of RGO sheets takes place when it is added in excess to the composite, which leads to a decrease in SSA. It can be observed, for instance, that the increase of the RGO loading from 15 to 20 wt% in IsoprOH-derived composites decreased SSA from 273 ± 12 to 231 ± 12 m2/g. As will be discussed further on, the stacking of RGO may decrease the photoactivity of TiO2-RGO composites.
SSA and SPV assessed for materials obtained using either IsoprOH or EtOH. The dotted lines are used as a guide to the eyes only.
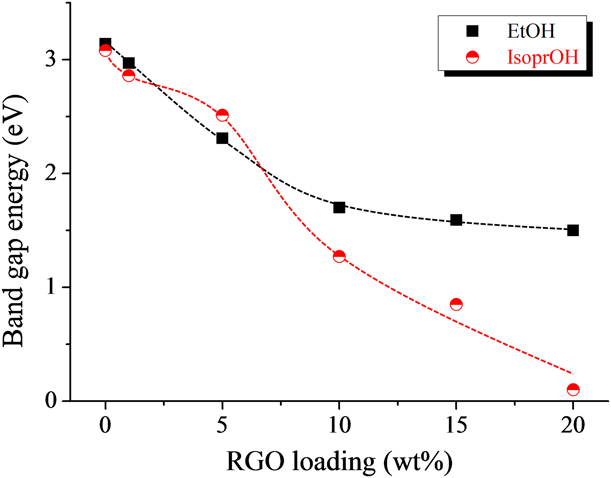
Upon considering an indirect allowed transition for titania, E g can be evaluated by plotting [F(R)hν]1/2 as a function of the photon energy hν, where h and ν are the Planck constant (4.14 × 10⁻¹⁵ eV s) and photon frequency (Hz), respectively [Reference López and Gómez42]. E g is obtained by the intersection of the line tangent to the inflection point of [F(R)hν]1/2 with the x-axis. This calculation is schematically shown in Fig. S2 (Supplementary material). Figure 6 depicts E g for samples prepared with either IsoprOH or EtOH. The obtained values are above the band gap energy commonly observed for bulk anatase (about 3.2 eV) [Reference Zhang, Zhou, Liu and Yu12]. It can be observed from Fig. 6 that in a general way, IsoprOH-derived composites showed a narrower apparent band gap than those obtained with EtOH. Similar findings were also reported by Wiranwetchayan et al. [Reference Wiranwetchayan, Promnopas, Thongtem, Chaipanich and Thongtem32] for pure TiO2 samples. It is been reported that the band gap energy of TiO2 can be associated with textural properties such as crystallinity and particle size. As depicted in Fig. 1, similar crystallinity was observed in the samples prepared in this work regardless of the solvent used: anatase was the only crystalline phase observed for these materials. It is well established that for semiconductor materials, the wider the band gap tends to be the smaller the particle size [Reference Gao and Zhang43, Reference Kočí, Obalová, Matějová, Plachá, Lacný, Jirkovský and Šolcová44]. This behavior was not observed in this work because IsoprOH-derived samples exhibited a lower E g in spite of their smaller particle size (Figs. S1, S2, and S8). It has been reported that for TiO2, the relation between the particle size and E g is not straightforward [Reference Monticone, Tufeu, Kanaev, Scolan and Sanchez45]. According to Lin et al. [Reference Lin, Huang, Li, Ni, Shah and Tseng46], this behavior can be related to both the delocalization of molecular orbitals and quantum size effects.
Apparent band gap energy as a function of the RGO loading for materials obtained with either IsoprOH or EtOH. The dashed lines are used as a guide to the eyes only.
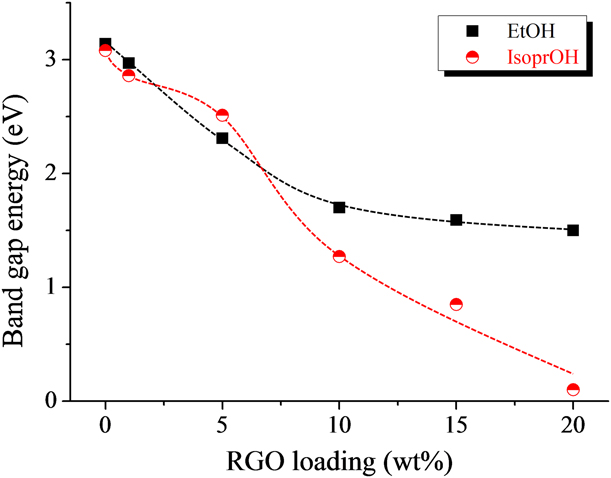
From Fig. 6, it is clear that the addition of RGO promotes the decrease of E g. As RGO shows no band gap [Reference Lian, Ji, Li, Jin, Ding and Luo47], one could expect that the larger its concentration is, the smaller E g its should be. It was reported that this decrease of E g is also associated with both the interaction between TiO2 and RGO and the formation of Ti–O–C bonds. However, those bonds are of difficult resolution by Fourier transform infrared spectroscopy due to their overlapping to strong bands ascribed to Ti–O–Ti bonds [Reference Pan, Zhao, Liu, Korzeniewski, Wang and Fan48].
The zeta potential measurements conducted in this work revealed that pure TiO2 displayed an isoelectric point (IEP) around pH 5.5 and 9.0 when prepared with IsoprOH and EtOH, respectively. The addition of RGO greatly shifted IEP toward smaller pH values, reaching values of about 3.0 and 3.7 for TiO2-RGO/15 composites obtained using IsoprOH and EtOH, respectively. The adsorption degree of MB is strongly influenced by the electrical charge observed on the adsorbent surface, which is in turn related to the solution pH. As MB is a cationic dye, the driving force for adsorption is higher on negatively charged surfaces [Reference Uddin, Rahman, Rukanuzzaman and Islam49]. This condition is observed for pH values above IEP, where the zeta potential is negative. The smaller IEP observed for IsoprOH-derived samples reveals that negative steaming potentials are reached in smaller pH values than for EtOH-related materials. Thus, the lower IEP noticed for materials prepared with IsoprOH could favor the electrostatic attraction between the TiO2 nanoparticles and MB, which increases the driving force for adsorption. Indeed, as will be discussed further on, samples prepared with IsoprOH displayed a larger capacity to adsorb MB than EtOH-derived materials. The decrease of IEP when RGO is added to TiO2 can be related to the negatively charged surface of RGO, which leads to negative streaming potentials at relatively low pH values [Reference Xu and Na50]. Again, the presence of negative charges on the surface of TiO2-RGO composites favors the adsorption of MB, which should also favor its photodegradation.
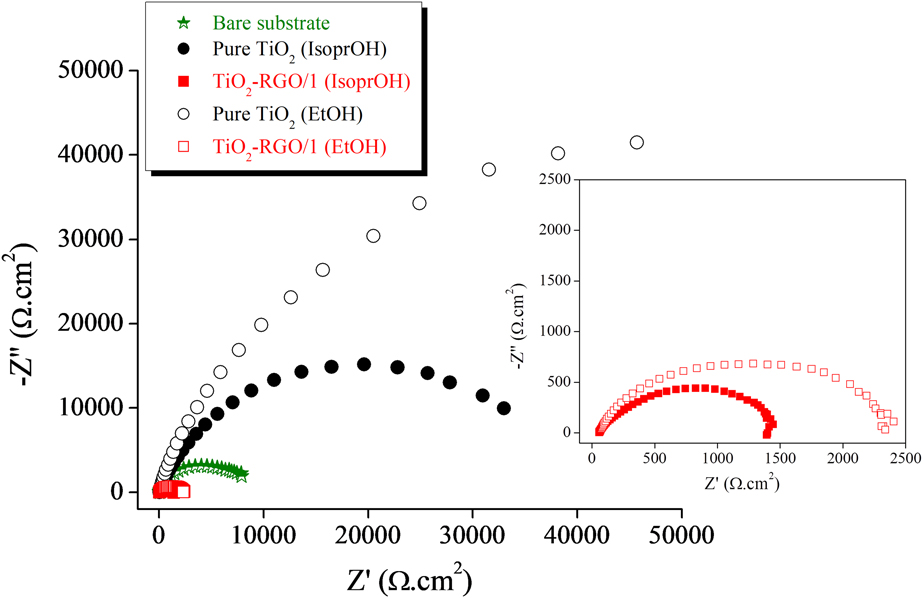
Figure 7 depicts the Nyquist plots obtained from EIS. It can be observed that the bare substrate displayed a semicircle size intermediary between TiO2 and TiO2-RGO/1. It is well known that the larger the semicircle, the lower is the conductivity of the examined sample [Reference Ru, Yang, Li, Jiang, Li, Luo, Yang, Li and Luo51]. This result reveals that the presence of TiO2 on the steel substrate decreased the electrical conductivity of the latter. On the other hand, the deposition of TiO2-RGO/1 particles on the substrate increased its conductivity because these composites exhibited smaller semicircles. This behavior is in line with the smaller E g displayed by the RGO-containing samples (Fig. 6), which reveals that they show increased electron mobility. It can also be noticed from Fig. 7 that samples prepared with IsoprOH showed smaller semicircles than materials obtained with EtOH. It was reported that smaller semicircles are ascribed to more effective separation of electron–hole pairs [Reference Shao, Ren, Tian, Gao, Luo, Shi, Yan, Li and Cui52]. As a consequence, it could be suggested that the separation of the charge carriers created during UV irradiation is more effective in IsoprOH-derived samples. This finding is especially evidenced when TiO2-RGO/1 is taken into consideration.
Nyquist plots obtained from EIS tests.

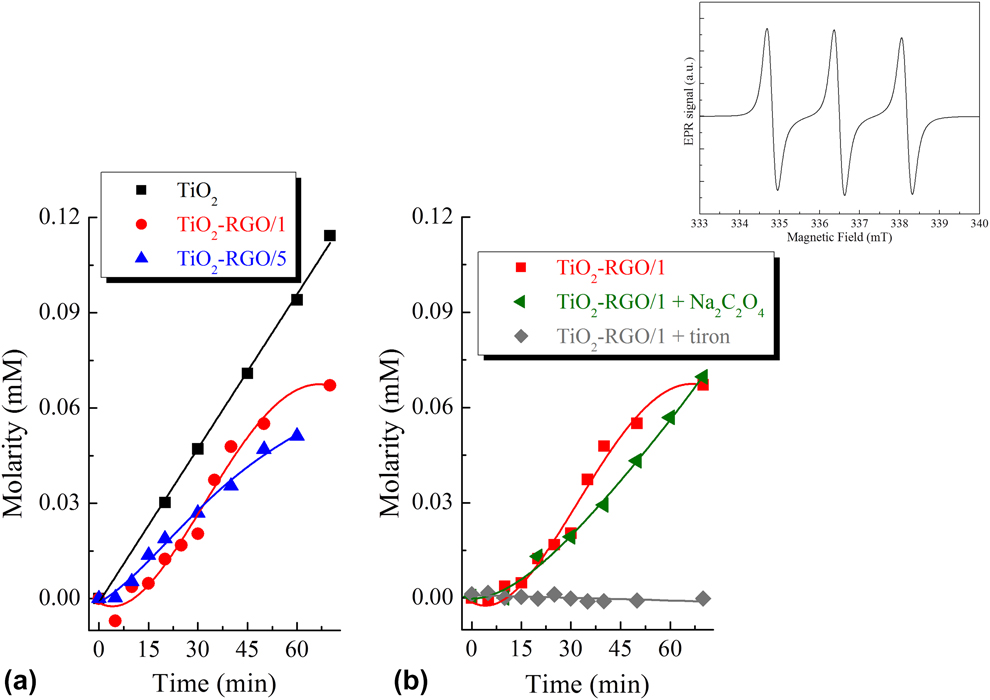
EPR spin trapping conducted with PBN did not display photoresponse, but the experiments conducted using DMPO indicated the formation of hydroxyl adducts. Figure 8(a) shows the time-dependent concentration of TMP adducts (oxygen singlet) when a UV source is used. TiO2 and TiO2-RGO/5 displayed a nearly linear formation of TMP adduct, but the evolution of oxygen singlet was less efficient for the latter. TiO2-RGO/1 displayed a different behavior, exhibiting an S-shaped curve. This composite showed a low efficiency to form TMP adducts in the first 30 min but after this time, the concentration of oxygen singlet increased and reached a level similar to that exhibited by TiO2 and TiO2-RGO/5. From Fig. 8(b), it can be observed that tiron completely removed oxygen singlet, which reveals that superoxide anion plays a key role in the photocatalytic process. Sodium oxalate also displayed some influence on the formation of singlet oxygen but to a lower extent. It is expected that in photocatalytic processes involving semiconductors, reactive oxygen species (ROS) are formed as a result of the charge transfer mechanism observed when electrons are promoted from the valence band to the conduction one, which gives rise to holes in the latter band. It is also reported that the formation of oxygen singlet (1O2) is associated with an energy transfer mechanism where molecular oxygen (3O2) is transformed into 1O2 species. This mechanism can be described by Eqs. (1) and (2) [Reference Konaka, Kasahara, Dunlap, Yamamoto, Chien and Inoue53].
 $${\rm{Ti}}{{\rm{O}}_2} + {}^3{{\rm{O}}_2} \to {\rm{Ti}}{{\rm{O}}_2} + {{\rm{e}}^ - } + {{\rm{h}}^ + } + {}^3{{\rm{O}}_2} \to {\rm{Ti}}{{\rm{O}}_2} + {}^1{{\rm{O}}_2}\quad ,$$
 $${\rm{Ti}}{{\rm{O}}_2} + {}^3{{\rm{O}}_2} \to {\rm{Ti}}{{\rm{O}}_2} + {\rm{O}}_2^ - + {{\rm{h}}^ + } \to {\rm{Ti}}{{\rm{O}}_2} + {}^1{\rm{O}}{}_2\quad .$$
Spin trapping EPR tests conducted with aqueous solutions containing different IsoprOH-derived photocatalysts as a function of the illumination time. (a) Adduct concentration at different time intervals for TiO2, TiO2-RGO/1, and TiO2-RGO/5. (b) Time-dependent concentration of adducts for TiO2-RGO/1 when different scavengers are used. Inset: typical 3-line hyperfine-split EPR spectrum of TMP adducts (oxygen singlet).

In attempting to evaluate the presence of ROS species involved in the formation of TMP adduct, two different suppressors were used in this work, namely sodium oxalate—Na2C2O4 (hole suppressor) and tiron (superoxide radicals suppressor). It is observed in Fig. 8(b) that tiron can completely remove oxygen singlet, which suggests that superoxide radical (O2−) plays a key role in the photocatalytic process. On the other hand, sodium oxalate also displayed some effect on the formation of oxygen singlet but to a lower degree. It seems that a great part of superoxide radicals formed during the photocatalysis is ascribed to Eq. (2).
It is well known that superoxide radicals are of difficult detection by EPR spectroscopy [Reference Brustolon and Giamello54]. PBN does not give rise to adducts with O2−, and DMPO superoxide adducts are not stable, easily transforming into hydroxyl adducts. These adducts present a 4-line hyperfine-split EPR spectrum, which is not observed in the inset of Fig. 8. Thus, the spin trapping tests conducted in this study are in agreement with the results obtained using either TMP (spin trap) or tiron (superoxide scavenger).
Photocatalytic tests
Figure 9 shows the adsorption and photocatalytic behaviors of materials prepared under different conditions. It can be observed that the photolysis of MB (degradation in the absence of photocatalyst) was negligible, the reason why it was not taken into consideration in this study. It is noticed that the adsorption of MB in dark conditions was more pronounced when the concentration of RGO in the composites is larger. This finding can be related to the negatively charged surface of RGO, which increases the driving force for adsorption. Indeed, it has been reported that RGO shows a high adsorption capacity of cationic dyes [Reference Zhu, Wang, Liu and Zhang55, Reference Kim, Kang, Park and Park56]. As discussed before, the incorporation of RGO into TiO2 shifted IEP toward smaller pH values. The initial pH of the MB solution used in the adsorption/photocatalytic tests was 4.2, which is above IEP measured for TiO2-RGO composites regardless of the alcohol used in the synthesis step. This implies that the surface of the composites was negatively charged at the beginning of the adsorption tests, leading to fast adsorption of MB. IsoprOH-derived materials exhibited a larger adsorption capacity than samples prepared with EtOH. IEP was smaller for samples obtained with IsoprOH when compared to EtOH-related materials, which reveals an improved electrostatic interaction between IsoprOH-derived composites and MB. Moreover, specimens prepared with IsoprOH displayed smaller crystallite sizes and larger surface areas than EtOH-related materials (Figs. S1 and S5). These results can reveal more effective contact between the surface of the composites and MB molecules for IsoprOH-derived samples, which also contributes to the adsorption of MB.
Adsorption and photocatalytic behaviors of TiO2 and TiO2-RGO composites obtained in this study.
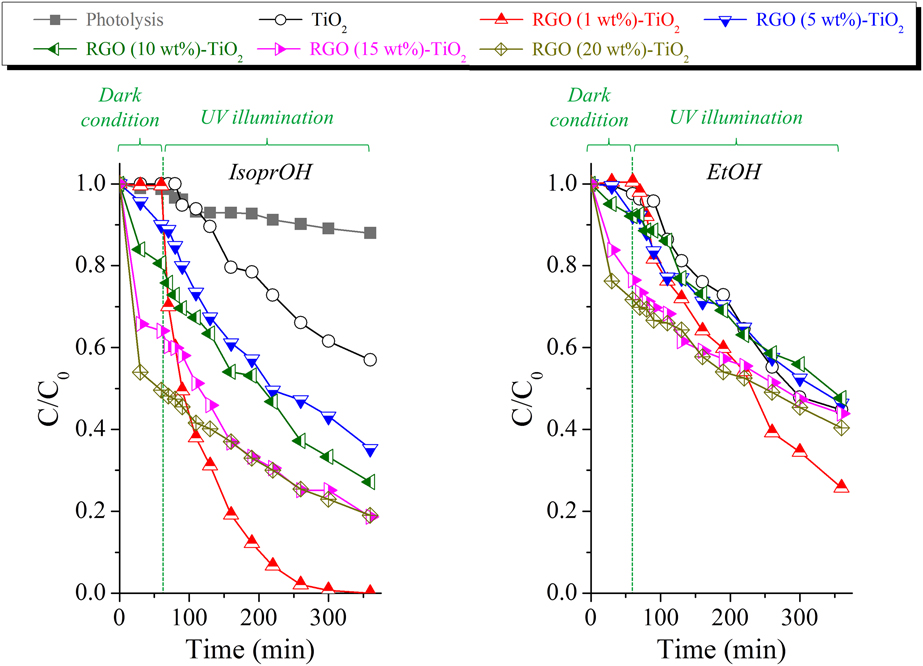
After 60 min of adsorption under dark conditions, the photoreactor was subsequently illuminated with UV light. The kinetic model of Langmuir–Hinshelwood (L–H) was applied to evaluate the photocatalytic behavior of the prepared materials under UV illumination. For highly diluted solutions, the L–H model can be expressed by an apparent first-order expression as follows:
 $${\rm{ln}}\left( {{{{C_0}} \over C}} \right) = - {k_{{\rm{app}}}}t\quad ,$$
where C 0 and C represent the dye concentration at the initial time and at a time t, respectively. k app (min−1) is the apparent first-order rate constant, and it can be evaluated by plotting ln(C 0/C) as a function of time. The value assessed for k app is closely related to the photocatalytic properties of the examined materials. Figure 10 depicts the values measured for k app. Pure TiO2 showed a larger k app when prepared with EtOH. On the other hand, larger values of k app were obtained for IsoprOH-derived TiO2-RGO composites. This behavior can be related to the improved adsorption capacity of the composites prepared with IsoprOH, which allows MB molecules to more easily reach the TiO2 particles during the photocatalytic tests. Moreover, IsoprOH-related samples exhibited narrower apparent band gaps (Fig. 6), revealing that less energy is needed to generate charge carriers. This finding may suggest that a higher concentration of electron–hole pairs is created during UV illumination, which can increase k app. Moreover, it has been reported that IsoprOH gives rise to a high concentration of Ti3+ sites, which are the active sites for water decomposition and greatly favors the photocatalytic process [Reference Loryuenyong, Angamnuaysiri, Sukcharoenpong and Suwannasri57].
Photocatalytic constant rate (k app) evaluated for samples obtained with either IsoprOH or EtOH.
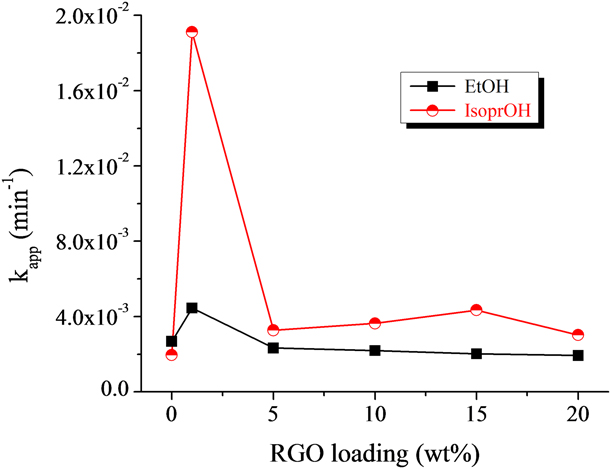
It can be observed from Fig. 10 that 1 wt% was the optimal loading of RGO to prepare composites with enhanced photocatalytic activities. Indeed, TiO2-RGO/1 composites obtained with EtOH and IsoprOH displayed degradation rate constants (k app) about 1.7 and 9.8 times higher than similar TiO2 samples, respectively. This behavior can be related to the stacking of RGO sheets when concentrations above 1 wt% are used, which prevents UV light from reaching the TiO2 surface and adversely impacts the photocatalytic activity of the composites [Reference Wang and Zhang58, Reference Perera, Mariano, Vu, Nour, Seitz, Chabal and Balkus59]. Moreover, composites with RGO loadings above 1 wt% should display a highly negatively charged surface, which decreases the separation of photogenerated excitons and results in faster recombination rates of charge carriers [Reference Xu and Na50, Reference Lv, Pan, Liu, Lu, Zhu, Sun and Sun60].
It can be observed from Fig. 8(b) that pure TiO2 displayed the most intense EPR signal ascribed to singlet oxygen. Nonetheless, this material exhibited low photocatalytic efficiency [Figs. 9 and 10]. This behavior may reveal that Eq. (1) is the dominant process for the formation of oxygen singlet in this material, in which oxygen singlet is derived from the recombination of electron–hole pairs. On the other hand, TiO2-RGO composites showed a high photoactivity, revealing that the separation of electron and holes is more effective in these materials. This result is supported by EIS (Fig. 7). This behavior reveals that there occurs a high transfer of electrons to molecular oxygen of the solvent when RGO-TiO2 composites are used in the photocatalytic tests, which leads to both the formation of superoxide anion radicals and degradation of MB. It is worth highlighting the smaller particle size, larger surface area, narrower apparent band gap, and lower IEP obtained for IsoprOH-derived samples. It appears that these properties allow a close contact between TiO2 and RGO, which favors the adsorption of MB and transference of charge carriers between TiO2 and RGO, besides gives rise to composites with improved photocatalytic activities. Figure S3 (Supplementary material) displays a schematic of the mechanism underlying the photocatalysis of MB by EtOH- and IsoprOH-derived samples.
Conclusions
TiO2 nanoparticles and TiO2-RGO nanocomposites were successfully prepared in this study by one-step hydrothermal synthesis. A titania sol was obtained by the sol–gel process, and GO was prepared after the exfoliation of graphite oxide (GrO). The hydrothermal treatment promoted the crystallization of TiO2 into anatase, reduction of GO into RGO, and anchoring of TiO2 nanoparticles onto the RGO sheets. The influence of using either IsoprOH or EtOH on the structural and photocatalytic properties of the obtained materials was evaluated. The use of IsoprOH led to samples with smaller crystallite size, narrower apparent band gap, smaller IEP, larger adsorption capacity, and higher photocatalytic activity. Moreover, the incorporation of RGO into TiO2 greatly improved the adsorption capacity and photocatalytic activity of the latter, especially when IsoprOH-derived samples are taken into account. It was observed by EIS and EPR that the separation of electron and holes is more effective in TiO2-RGO composites, which also accounts for the larger photoactivity of these materials when compared to pure TiO2. Spin trapping EPR spectroscopy also pointed out an improved formation of superoxide radicals when those composites are exposed to UV light. The optimal loading of RGO to prepare composites with enhanced photocatalytic activities was 1 wt%. This finding can be related to the stacking of RGO sheets when concentrations above 1 wt% are used, which prevents UV light from reaching the TiO2 surface and adversely impacts the photocatalytic activity of the composites. Besides, samples with RGO concentration above 1 wt% should exhibit a highly negatively charged surface, which could decrease the separation of the photogenerated electron–hole pairs and also result in faster recombination rates of charge carriers.
Materials and methods
TiO2 nanoparticles
A polymeric stock solution (mother solution—MS) was initially prepared by mixing TIPT (Aldrich, 97%) with a solution of deionized Milli-Q water, hydrochloric acid (HCl/Aldrich, 37%), and either EtOH (Aldrich, ≥98%) or IsoprOH (Aldrich, 98%). The loading of TIPT in this solution was 0.4 M, and the molar ratio of TIPT:H2O:HCl was kept at 1:0.82:0.13. MS was subsequently aged in air at room temperature for 72 h. Next, Milli-Q water was added to MS to adjust the molar ratio of H2O:TIPT to 90:1.
RGO nanosheets
RGO nanosheets were obtained from the exfoliation of GrO, following the procedure detailed in BR102016005632-2 A2 [Reference Castro, Neves, Pereira, Assis, Montoro and Silva40]. Briefly, a solution of sulfuric acid (Synth, 98%, 360 mL) and potassium permanganate (Neon, 99%, 15 g) was initially prepared under stirring in an ice bath. Graphite powder (CBG Mining, 7.5 g) was then added to this solution. The as-obtained solution was stirred for 10 min in a microwave digestion system (Milestone Start D) at 70 °C and 250 W. Next, the solution was dispersed in deionized water, followed by the addition of an aqueous solution of hydrogen peroxide (35 vol%). The solution was filtered and the obtained solid (GrO) was washed with deionized water. GO was obtained from the ultrasonic exfoliation of GrO in water for 30 min. The as-prepared suspension was centrifuged at 4000 rpm for 20 min. GO was collected as supernatant, and its loading in the prepared suspension was kept constant at 5.3 g/L.
TiO2-RGO nanocomposites
TiO2-RGO nanocomposites were prepared by mixing the GO aqueous suspension with MS. The loading of GO in the prepared composites ranged from 0 to 20 wt%. The as-prepared solutions were initially homogenized by stirring at room temperature. They were then poured into a Teflon-lined stainless steel autoclave and heat treated for 6 h at 180 °C. The hydrothermal treatment promoted the crystallization of TiO2, reduction of GO into RGO, and anchoring of TiO2 nanoparticles on RGO sheets. The obtained material was stirred at room temperature for 1 h, sonicated for 10 min, and air-dried at 80 °C. Figure S4 (Supplementary material) depicts the experimental procedure followed in this work. The obtained samples were designated as TiO2-RGO/X, where X represents the loading of RGO (wt%) in the composite.
Structural characterization and photocatalytic evaluation
XRD was conducted in a Philips/PANalytical apparatus (PW1710) with a scan velocity of 0.06°/s and Cu Kα as the radiation source. The crystallite size of TiO2 anatase was evaluated from the Scherrer equation, considering the XRD peak at about 26°. Raman spectroscopy was performed with a Jobin-Yvon Horiba LabRAM HR 800 system using a 1.1-cm−1 step size and a He–Ne laser (632.82 nm). N2 adsorption was conducted in a Quantachrome apparatus (Nova 1200e) using samples degassed at 130 °C under vacuum. These examinations were performed within an experimental error of 5%. SSA and SPV were evaluated from the BET (Brunauer–Emmett–Teller) and BJH (Barrett–Joyner–Halenda) models. Zeta potential was evaluated with a Zeta-meter 3.0 system in distilled water, using aqueous solutions of NaOH or HCl (1 vol%) for adjusting the solution pH. No background electrolyte was used in these measurements. TEM/SAED was conducted in an FEI microscope (Tecnai G2-20 SuperTwin) at an accelerating voltage of 200 kV. Samples used in these tests were previously dispersed in absolute ethanol and sonicated for 5 min at room temperature. The obtained suspensions were dripped on carbon-coated grids. After the drying step, those grids were used in TEM/SAED. The apparent band gap energy (E g) of the materials obtained in this study was evaluated by UV–Vis diffuse reflectance spectroscopy at a resolution of 1 cm−1 with a Shimadzu system (UV-2600). The Kubelka–Munk and Tauc methods were used in these calculations [Reference López and Gómez42].
The electrochemical experiments were performed in an aqueous solution containing NaCl (3.5%). The open-circuit potential (OCP) was measured for 3600 s. EIS was performed using an Autolab PGSTAT100N potentiostat and samples with a geometric surface of about 1 cm [Reference Liu, Su, Zhang, Wang, Yang, Shen, Deng, Zhang and Zhang2]. Previously polished stainless steel substrates were used in these tests. They were coated with either TiO2 or TiO2-RGO after dripping aqueous suspensions containing these materials on the substrates. The coated substrates were then dried in air at 80 °C for 1 h. A conventional three-electrode cell was used in EIS. A calomel reference electrode saturated with KCl was used as the reference electrode, platinum as the counter electrode, and the stainless steel substrates as the working electrode. The EIS spectra were taken at a potential amplitude of 10 mV and within the frequency range between 5 × 10⁻³ and 104 Hz.
Spin trapping EPR was conducted at room temperature with an X-band (9.4 GHz) spectrometer (Magnettech MiniScope MS400). Typical parameters used in these tests were as follows: center field = 337 mT; scan width = 10 mT; acquisition time = 60 s; field modulation = 100 kHz, and modulation amplitude = 0.2 mT. Aqueous solutions containing PBN (alpha-phenyl N-tertiary-butylnitrone), DMPO (5,5-dimethyl-pyrroline N-oxide), and TMP (2,2,6,6-tetramethylpiperidine) were used as spin traps. The initial concentrations of PBN, DMPO, and TMP in these water-based solutions were 50 mM, 50 mM, and 1 M, respectively. Sodium oxalate (Na2C2O4) and tiron (C6H4Na2O8) were used as scavengers for free holes (h+) and superoxide radicals (O2−), respectively. The concentration of sodium oxalate and tiron used in EPR were kept at 20 and 50 mM, respectively. Solutions of the examined photocatalyst (6 mg) and distilled water were then prepared with different spin traps. The as-prepared suspensions were kept under stirring at room temperature and illuminated with UVA light (366 nm) from a 5-W source. Aliquots of the supernatant (30 μL) were collected at different time intervals and poured into glass capillaries for testing.
The photocatalytic performance of the prepared samples was verified by evaluating the degradation rate of MB (Aldrich) under UV irradiation. The photoreactor used has an Osram Dulux 9W/78 UVA lamp. The solution temperature was kept at 25 °C by means of a cooling system coupled to the reactor. The content of MB in the solutions was fixed at 10 mg/L and their initial pH was 4.2. The loading of TiO2 and TiO2-RGO in the examined solutions was kept at 100 mg/L. The degradation tests were preceded by adsorption tests under dark conditions for 60 min. Photolysis and degradation tests using TiO2 were also conducted for reference purposes. The concentration of MB in the solutions was evaluated in a UV–Vis spectrometer (Cole Parmer 1100 RS). The solutions were previously centrifuged at 1700 rpm for about 10 min to avoid the interference from suspended particles. The supernatant was then filtered with a PVDF filter (Millex®/0.45 μm) and then transferred to poly(methyl methacrylate) (PMMA) cuvettes. These cuvettes were subsequently examined by assessing the absorbance at 665 nm (maximum absorbance wavelength of MB).
Supplementary material
To view supplementary material for this article, please visit https://doi.org/10.1557/jmr.2019.342.
Acknowledgments
We would like to acknowledge the financial support from PRPq-UFMG (05-2016), CNPq (305013/2017-3 and 301423/2018-0), FAPEMIG (APQ-00792-17 and red-00102-16), and CAPES (PROEX). We acknowledge the support from UFMG Microscopy Center and INCT-Acqua. We also thank professors Rodrigo Oréfice, Leandro Soares, and Adriana França for the great support given to this study.