1. INTRODUCTION
When atomic spectral lines coalesce into broad unresolved patterns due to physical broadening mechanisms (Stark effect, auto-ionization, etc.), they can be handled by the so-called statistical methods (Bauche et al., Reference Bauche, Bauche-Arnoult and Klapisch1988). Global characteristics – average energy, variance, asymmetry, and sharpness – of level-energy, absorption, or emission spectra can be useful for their analysis and the investigation of their regularities (Bauche & Bauche-Arnoult, Reference Bauche and Bauche-Arnoult1987; Reference Bauche and Bauche-Arnoult1990). Systematic studies of these average characteristics for transition arrays and applications to the interpretation of experimental spectra of high-temperature plasmas were initiated in (Moszkowski, Reference Moszkowski1962; Bauche et al., Reference Bauche-Arnoult, Bauche and Klapisch1979). The elaboration of the general group-diagrammatic summation method (Ginocchio, Reference Ginocchio1973) and its realization in computer codes (Kucas & Karazija, Reference Kucas and Karazija1993; Reference Kucas and Karazija1995; Kucas et al., Reference Kucas, Jonauskas and Karazija2005; Karazija & Kucas, Reference Karazija and Kucas2013) opened up new possibilities for the use of global properties in atomic spectroscopy. On the other hand, some transition arrays exhibit a small number of lines that must be taken into account individually. Those lines are important for the plasma diagnostics, interpretation of spectroscopy experiments, and for calculating the Rosseland mean κR, important for radiation transport, and defined as
 $$\displaystyle{1 \over {{{\rm \kappa} _R}}} = \int_0^{\infty} \displaystyle{1 \over {{\rm \kappa} (h{\rm \nu} )}}\displaystyle{{{\rm \partial} {B_{\rm T}}(h{\rm \nu} )} \over {{\rm \partial} T}}dh{\rm \nu} /\int_0^{\infty} \displaystyle{{{\rm \partial} {B_{\rm T}}(h{\rm \nu} )} \over {{\rm \partial} T}}dh{\rm \nu}, $$
hv being the incident photon energy, κ(hv) the opacity including stimulated emission, T the temperature and B T(hv) Planck's distribution function. The Rosseland mean is very sensitive to the gaps between lines in the spectrum.
These are the reasons why we developed the hybrid opacity code SCO-RCG (Porcherot et al., Reference Porcherot, Pain, Gilleron and Blenski2011), which combines statistical methods and fine-structure calculations, assuming local thermodynamic equilibrium. The main features of the code are described in Section 2, the extension to the hybrid approach of the partially resolved transition array (PRTA) model (Iglesias & Sonnad, Reference Iglesias and Sonnad2012), which enables one to replace many statistical transition arrays by small-scale detailed line accounting (DLA) calculations, is presented in Section 3 and comparisons with experimental spectra are shown and discussed in Section 4. In Section 5, an approximate modeling of Zeeman effect is proposed together with a fast numerical algorithm for the convolution of a Lorentzian function with Gram–Charlier expansion series, based on a cubic-spline representation of the Gaussian.
2. DESCRIPTION OF THE CODE AND EFFECT OF DETAILED LINES
In order to decide, for each transition array, whether a detailed treatment of lines is necessary or not and to determine the validity of statistical methods, the SCO-RCG code uses criteria to quantify the porosity (localized absence of lines) of transition arrays. The main quantity involved in the decision process is the ratio between the individual line width and the average energy gap between two neighboring lines in a transition array. Data required for the calculation of lines (Slater, spin-orbit, and dipolar integrals) are provided by SCO code (Blenski et al., Reference Blenski, Grimaldi and Perrot2000), which takes into account plasma screening and density effects on the wave-functions. Then, level energies and lines are calculated by an adapted routine (RCG) of Cowan's atomic-structure code (Cowan, Reference Cowan1981) performing the diagonalization of the Hamiltonian matrix. Transition arrays for which a DLA treatment is not required or impossible are described statistically, by unresolved transition array (UTA; Bauche-Arnoult et al., Reference Bauche-Arnoult, Bauche and Klapisch1979), spin-orbit split array (SOSA; Bauche-Arnoult et al., Reference Bauche-Arnoult, Bauche and Klapisch1985) or super transition array (STA; Bar-Shalom et al., Reference Bar-Shalom, Oreg, Goldstein, Shvarts and Zigler1989) formalisms used in SCO. In SCO-RCG, the orbitals are treated individually up to a certain limit, consistent with Inglis-Teller limit (Inglis & Teller, Reference Inglis and Teller1939), beyond which they are gathered in a single super-shell. The grouped orbitals are chosen so that they interact weakly with inner orbitals (this is why we sometimes name that super-shell “Rydberg”). The total opacity is the sum of photo-ionization, inverse Bremsstrahlung, and Thomson scattering spectra calculated by SCO code and a photo-excitation spectrum in the form
 $${\rm \kappa} (h{\rm \nu} )=\displaystyle{1 \over {4{\rm \pi} {{\rm \varepsilon} _0}}}\displaystyle{{\cal N} \over A}\displaystyle{{{\rm \pi} {e^2}h} \over {mc}}\sum\limits_{X \to X^{\prime}} {\,f_{X \to X^{\prime}}}{{\cal P}_X}{\Psi _{X \to X^{\prime}}}(h{\rm \nu} ), $$
where h is Planck's constant,  ${\cal N}$ the Avogadro number, ε0 the vacuum polarizability, m the electron mass, A the atomic number, and c the speed of light.
 ${\cal P}$ is a probability, f an oscillator strength, Ψ(hv) a profile, and the sum X→X′ runs over lines, UTA, SOSA, or STA of all ion charge states present in the plasma. Special care is taken to calculate appropriately the probability of X (which can be either a level αJ, a configuration C, or a superconfiguration S) because it can be the starting point for different transitions (DLA, UTA, SOSA, STA). In order to ensure the normalization of probabilities, we introduce three disjoint ensembles:
 ${\cal D}$ (detailed levels αJ),
 ${\cal C}$ (configurations C too complex to be detailed), and
 ${\cal S}$ (superconfigurations S that do not reduce to ordinary configurations). The total partition function then reads
 $${U_{{\rm tot}}}=U({\cal D})+U({\cal C})+U({\cal S})\quad {\rm with}\quad {\cal D} \cap {\cal C} \cap {\cal S}=\emptyset, $$
where each term is a trace over quantum states of the form 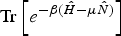 ${\rm Tr}\left[ {{e^{{ - \rm \beta} (\hat H - \mu \hat N)}}} \right]$, where
 $\hat H$ is the Hamiltonian,
 $\hat N$ the number operator, μ the chemical potential, and β = 1/(k BT). The probabilities of the different species of the N-electron ion are
 $${{\cal P}_{{\rm \alpha} J}}=\displaystyle{1 \over {{U_{{\rm tot}}}}}(2J+1){e^{ - {\rm \beta} ({E_{{\rm \alpha} J}} - \mu N)}}, $$
for a level belonging to  ${\cal D}$,
 $${\cal P}_C = \displaystyle{1 \over U_{\rm tot}} \sum\limits_{{\rm \gamma} J \in C} (2J + 1) e^{ - {\rm \beta} (E_{{\rm \alpha} J} - {\rm \mu} N)}, $$
for a configuration that can be detailed,
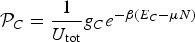 $${{\cal P}_C}=\displaystyle{1 \over {{U_{{\rm tot}}}}}{g_C} {e^{ - {\rm \beta} ({E_C} - {\rm \mu} N)}} $$
for a configuration that can not be detailed (i.e., belonging to  ${\cal C}$) and
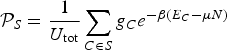 $${{\cal P}_S}=\displaystyle{1 \over {{U_{{\rm tot}}}}}\sum\limits_{C \in S} {g_C} {e^{ - {\rm \beta} ({E_C} - {\rm \mu} N)}} $$
for a superconfiguration.
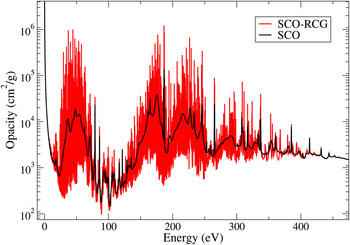
We can see in Figure 1 that fine-structure calculations can have a strong impact on the Rosseland mean. The physical broadening mechanisms are the same for both the calculations (statistical: SCO and detailed: SCO-RCG). The modeling of the (impact) collisional broadening relies on the Baranger formulation (Baranger, Reference Baranger1958) and expressions provided by Dimitrijevic and Konjevic (Dimitrijevic & Konjevic, Reference Dimitrijevic and Konjevic1987) corrected by inelastic Gaunt factors similar, for high energies, to the ones proposed by Griem et al., (Reference Griem, Baranger, Kolb and Oertel1962; Reference Griem1968). Ionic Stark effect is treated in the quasi-static approximation following an approach proposed by Rozsnyai (Reference Rozsnyai1977), corrected in order to reproduce the exact second-order moment of the electric micro-field distribution in the framework of the one-component plasma (OCP) model (Iglesias et al., Reference Iglesias, Lebowitz and Macgowan1983).
Comparison between the SCO-RCG and full-statistical (SCO) calculations for an iron plasma at T = 50 eV and ρ = 10−3 g/cm2. The Rosseland mean is equal to 1691 cm2/g for the SCO calculation and to 1261 cm2/g for SCO-RCG.

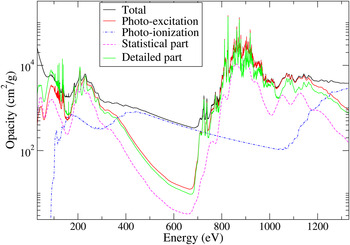
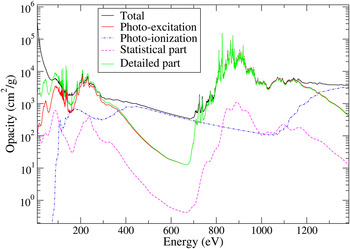
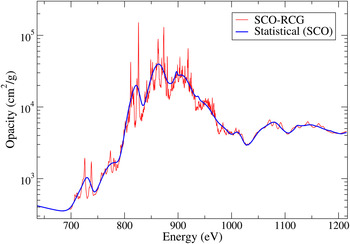
The code can be useful for astrophysical applications (Gilles et al., Reference Gilles, Turck-Chieze, Loisel, Piau, Ducret, Poirier, Blenski, Thais, Blancard, Cosse, Faussurier, Gilleron, Pain, Porcherot, Guzik, Kilcrease, Magee, Harris, Busquet, Delahaye, Zeippen and Bastiani-Ceccotti2011, Turck-Chieze et al., Reference Turck-Chieze, Loisel, Gilles, Piau, Blancard, Blenski, Busquet, Cosse, Delahaye, Faussurier, Gilleron, Guzik, Harris, Kilcrease, Magee, Pain, Porcherot, Poirier, Zeippen, Bastiani-Ceccotti, Reverdin, Silvert and Thais2011). Figures 2–4 represent the different contributions to opacity (DLA, statistical, and PRTA) for an iron plasma in conditions corresponding to the boundary of the convective zone of the Sun, with a maximum imposed number N max of detailed lines per transition array equal to 100 and 800,000, respectively. As expected, when N max increases, the statistical part becomes smaller. In Figure 2, the detailed part is obviously not sufficiently larger than the statistical part around hv = 850 eV.
Different contributions to opacity calculated by SCO-RCG code for an iron plasma at T = 193 eV and ρ = 0.58 g cm−3 (boundary of the convective zone of the Sun). The maximum number of lines potentially detailed per transition array is chosen equal to 100.

Different contributions to opacity calculated by SCO-RCG code for an iron plasma at T = 193 eV and ρ = 0.58 g cm−3 (boundary of the convective zone of the Sun). The maximum number of lines potentially detailed per transition array is chosen equal to 800,000.

Comparison between the full-statistical (SCO) spectrum and SCO-RCG around the maximum of the opacity bump in the conditions of Figure 2 (boundary of the convective zone of the Sun). The maximum number of lines potentially detailed per transition array is chosen equal to 800,000.

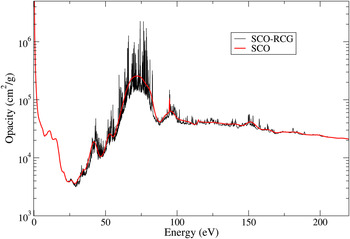
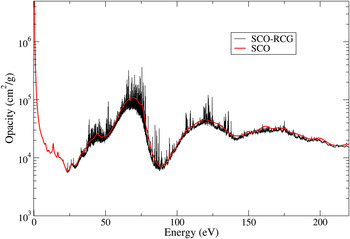
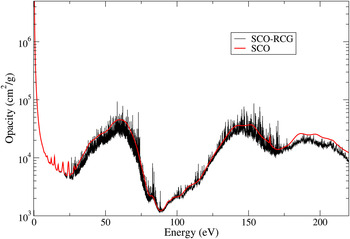
As shown in Figures 5–7, the statistical calculation (SCO) may depart significantly from the detailed one (SCO-RCG), and the differences are essentially the signature of the porosity of transition arrays. The density being quite low (ρ = 4 × 10³ g cm−3), the lines emerge clearly in the spectrum. These conditions are accessible to laser spectroscopy experiments (see Section 4) and we can see that the opacity changes notably with temperature. Therefore, even if the quantity which is measured in absorption point-projection-spectroscopy experiments is not the opacity itself, but the transmission (see Section 4), one may expect to have a reliable idea of the plasma temperature during the measurement.
Iron opacity at T = 15 eV and ρ = 4 × 10⁻³ g cm−3. Comparison between the full-statistical (SCO) and SCO-RCG calculations. The maximum number of lines potentially detailed per transition array is chosen equal to 800,000.

Iron opacity at T = 27 eV and ρ = 4 × 10⁻³ g cm−3. Comparison between the full-statistical (SCO) and SCO-RCG calculations. The maximum number of lines potentially detailed per transition array is chosen equal to 800,000.

Iron opacity at T = 38 eV and ρ = 4 × 10⁻³ g cm−3. Comparison between the full-statistical (SCO) and SCO-RCG calculations. The maximum number of lines potentially detailed per transition array is chosen equal to 800,000.

3. ADAPTATION OF THE PRTA MODEL TO THE HYBRID APPROACH
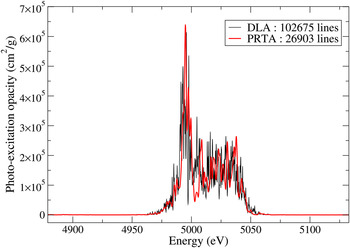
To complement DLA efforts, the code was recently improved (Pain et al., Reference Pain, Gilleron, Porcherot and Blenski2013; Reference Pain, Gilleron, Porcherot and Blenski2015) with the PRTA model (Iglesias & Sonnad, Reference Iglesias and Sonnad2012), which may replace the single feature of a UTA by a small-scale detailed transition array that conserves the known transition-array properties (energy and variance) and yields improved higher-order moments. In the PRTA approach, open subshells are split into two groups. The main group includes the active electrons and those electrons that couple strongly with the active ones. The other subshells are relegated to the secondary group. A small-scale DLA calculation is performed for the main group (assuming therefore that the subshells in the secondary group are closed) and a statistical approach for the secondary group assigns the missing UTA variance to the lines. In the case where the transition C→C′ is a UTA that can be replaced by a PRTA (see Fig. 8), its contribution to the opacity is modified according to
 $${\,f_{C \to C'}} {\cal P}_C {{\rm \Psi} _{C \to C^{\prime}}}(h{\rm \nu} ) \approx \sum\limits_{\bar {\rm \alpha} \bar J \to \bar {\rm \alpha} ^{\prime}\bar J^{\prime}} {\,f_{\bar {\rm \alpha} \bar J \to \bar {\rm \alpha} ^{\prime}\bar J^{\prime}}} {\cal P}_{\bar {\rm \alpha} \bar J} {{\rm \Psi} _{\bar {\rm \alpha} \bar J \to \bar {\rm \alpha} '\bar J'}}(h{\rm \nu} ), $$
where the sum runs over PRTA lines  $\bar {\rm \alpha} \bar J \to \bar {\rm \alpha} '\bar J'$ between pseudo-levels of the reduced configurations,
 ${\,f_{\bar {\rm \alpha} \bar J \to \bar {\rm \alpha} ^{\prime}\bar J^{\prime}}}$ is the corresponding oscillator strength and
 ${{\rm \Psi} _{\bar {\rm \alpha} \bar J \to \bar {\rm \alpha} ^{\prime}\bar J^{\prime}}}$ is the line profile augmented with the statistical width due to the other (non-included) spectator subshells. The probability of the pseudo-level
 $\bar {\rm \alpha} \bar J$ of configuration
 $\bar C$ reads
 $${\cal P}_{\bar{{\rm \alpha}} \bar{J}} = \displaystyle{(2\bar{J} + 1)e^{ - {\rm \beta} (E_{\bar{{\rm \alpha}} \bar{J}} - {\rm \mu} N)} \over \sum\nolimits_{\bar{{\rm \alpha}} \bar{J} \in \bar{C}} (2\bar{J} + 1) e^{ - {\rm \beta} (E_{\bar{{\rm \alpha}} \bar{J}} - {\rm \mu} N)}} \times {\cal P}_C $$
with ensures that  $\sum\nolimits_{\bar {\rm \alpha} \bar J \in \bar C} {{\cal P}_{\bar {\rm \alpha} \bar J}}={{\cal P}_C}$, where
 ${\cal P}_C$ is the probability of the genuine configuration given in Eq. (4).
Comparison between two SCO-RCG calculations relying respectively on DLA and PRTA treatments of lines for transition arrays 3p 3/2→5s in a Hg plasma at T = 600 eV and ρ = 0.01 g/cm3. The DLA calculation contains 102,675 lines and the PRTA 26,903 lines.

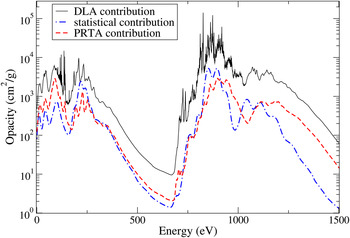
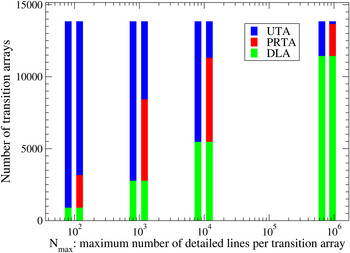
Figure 9 represents the different contributions to opacity (DLA, statistical, and PRTA) for an iron plasma in conditions corresponding to the boundary of the convective zone of the Sun. We can see that the PRTA contribution is of the same order of magnitude here as the statistical one. The calculation was performed with a maximum imposed of 10,000 detailed lines per transition arrays. We can see in Figure 10 that for each value of the maximum number of lines that can be detailed (N max), some UTA are replaced by PRTA transition arrays. Of course, the number of remaining UTA decreases with N max.
The three independent contributions to photo-excitation calculated by SCO-RCG code for an iron plasma at T = 193 eV and ρ = 0.58 g cm−3 (boundary of the convective zone of the Sun).

Number of DLA, PRTA, and UTA for different values of the maximum number of detailed lines imposed: 102, 103, 104, and 106. For each case, two histograms are displayed: In the first one, the detailed calculations are only pure DLA and in the second one they can be either DLA or PRTA.

4. INTERPRETATION OF EXPERIMENTAL SPECTRA
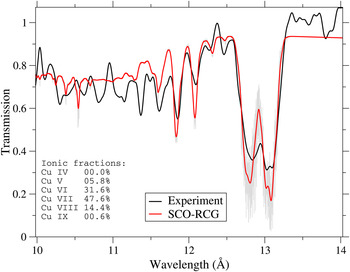
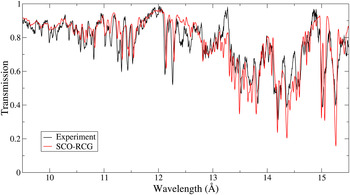
The SCO-RCG code has been successfully compared with several absorption and emission experimental spectra, measured in experiments at several laser (Fig. 11) or Z-pinch facilities (Fig. 12). The comparisons show the relevance of the hybrid model and the necessity to carry out detailed calculations instead of full statistical calculations. As mentioned in Section 2, the quantity which is measured experimentally is the transmission, related to the opacity by Beer–Lambert–Bouguer's law:
 $$T(h{\rm \nu} ) = {e^{ - {\rm \rho} L{\rm \kappa} (h{\rm \nu} )}}, $$
where L is the thickness of the sample. The relation (10) between transmission and opacity is valid under the assumption that the material is optically thin and that re-absorption processes are neglected.
Interpretation with SCO-RCG code of the copper spectrum (2p→3d transitions) measured by Loisel et al. (Loisel et al., Reference Loisel, Arnault, Bastiani-Ceccotti, Blenski, Caillaud, Fariaut, Foelsner, Gilleron, Pain, Poirier, Reverdin, Silvert, Thais, Turck-Chieze and Villette2009; Blenski et al., Reference Blenski, Loisel, Poirier, Thais, Arnault, Caillaud, Fariaut, Gilleron, Pain, Porcherot, Reverdin, Silvert, Villette, Bastiani-Ceccotti, Turck-Chieze, Foelsner and De Gaufridy De Dortan2011a; Reference Blenski, Loisel, Poirier, Thais, Arnault, Caillaud, Fariaut, Gilleron, Pain, Porcherot, Reverdin, Silvert, Villette, Bastiani-Ceccotti, Turck-Chieze, Foelsner and De Gaufridy De Dortan2011b). The temperature is T = 16 eV and the density ρ = 5 × 10⁻³ g cm3.

Interpretation with SCO-RCG code of the iron spectrum (2p→3d transitions) measured by Bailey et al. (Reference Bailey, Rochau, Iglesias, Abdallah, Macfarlane, Golovkin, Wang, Mancini, Lake, Moore, Bump, Garcia and Mazevet2007). The temperature is T = 150 eV and the density ρ = 0.058 g cm3.

In SCO-RCG, configuration interaction is limited to electrostatic one between relativistic sub-configurations ( $n\ell j$ orbitals) belonging to a non-relativistic configuration (
 $n\ell $ orbitals), namely “relativistic configuration interaction”. That effect has a strong impact on the ratio of the two relativistic substructures of the 2p→3d transition on Figure 11.
5. STATISTICAL MODELING OF ZEEMAN EFFECT
5.1. Determination of the Moments
Quantifying the impact of a magnetic field on spectral line shapes is important in astrophysics, in inertial confinement fusion (ICF) or for Z-pinch experiments. Because the line computation becomes even more tedious in that case, we propose, to avoid the diagonalization of the Zeeman Hamiltonian, to describe Zeeman patterns in a statistical way. This is also justified by the fact that in a hot plasma, the number of lines is huge, and therefore the number of Zeeman transitions, arising from the splitting of spectral lines, is even greater, which makes the coalescence of the spectral features more important. Due to the other physical broadening mechanisms, the Zeeman components can not be resolved (Doron et al., Reference Doron, Mikitchuk, Stollberg, Rosenzweig, Stambulchik, Kroupp, Maron and Hammer2014).
In the presence of a magnetic field B, a level αJ 1 (energy E 1) splits into 2J 1 + 1 states M 1 (−J 1 ≤ M 1 ≤ J 1) of energy E 1+μBg 1M 1, μB being the Bohr magneton and g 1 the Landé factor in intermediate coupling (provided by RCG routine). Each line splits into three components associated with the selection rule ΔM = q, where q = 0 for a π component and ± 1 for a σ± component. The intensity of a component can be characterized by the strength-weighted moments of the energy distribution. The nth-order moment reads
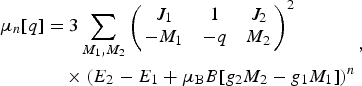 $$\eqalign{{{\rm \mu} _n}[q] &= 3\sum\limits_{{M_1},{M_2}} \left(\matrix{J_1 & 1 &J_2 \cr - M_1 & - q &M_2} \right)^2 \cr &\quad \times (E_2 - E_1 + {\rm \mu}_{\rm B} B[g_2 M_2 - g_1 M_1])^n}, $$
which can be evaluated analytically (Pain & Gilleron, Reference Pain and Gilleron2012a; Reference Pain and Gilleron2012b), using graphical representation of Racah algebra or Bernoulli polynomials (Mathys & Stenflo, Reference Mathys and Stenflo1987).
5.2. Gram–Charlier Distribution
Gram–Charlier expansions are useful to model densities which are deviations from the normal one. The expansion is named after the Danish mathematician Jorgen P. Gram (1850–1916) and the Swedish astronomer Carl V. L. Charlier (1862–1934). Historical accounts of the origin of the Gram–Charlier expansion are given in Hald (Reference Hald2000) and Davis (Reference Davis2005). This expansion, that finds applications in many areas, including finance (Jondeau & Rockinger, Reference Jondeau and Rockinger2001), analytical chemistry (Di Marco & Bombi, Reference Di Marco and Bombi2001), spectroscopy (O'Brien, Reference O'brien1992), and astrophysics and cosmology (Blinnikov & Moessner, Reference Blinnikov and Moessner1998) reads
 $$GC(u) = \displaystyle{1 \over {\sqrt {2{\rm \pi} v}}} {e^{ - {u^2}/2}}\left[ {\sum\limits_{k = 0}^{\infty} {c_k}{\rm H}{{\rm e}_k}\left( {\displaystyle{u \over {\sqrt 2}}} \right){2^{ - k/2}}} \right], $$
where  $u = (h{\rm \nu} - {{\rm \mu} _1})/\sqrt v $,
 $v = {{\rm \mu} _2} - {({{\rm \mu} _1})^2}$ being the variance. The polynomials Hek(x) can be expressed as
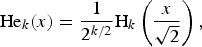 $${\rm H}{{\rm e}_k}(x) = \displaystyle{1 \over {{2^{k/2}}}}{{\rm H}_k}\left( {\displaystyle{x \over {\sqrt 2}}} \right), $$
where Hk(x) are the usual Hermite polynomials obeying the recurrence relation (Szego, Reference Szego1939):
 $${{\rm H}_{k + 1}}(x) = 2x{{\rm H}_k}(x) - 2k{{\rm H}_{k - 1}}(x) $$
initialized with H 0(x) = 1 and H 1(x) = 2x. The coefficients c k are given by
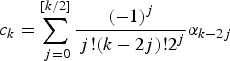 $${c_k} = \sum\limits_{\,j = 0}^{\left[ {k/2} \right]} \displaystyle{{{{( - 1)}^j}} \over {\,j!(k - 2j{{)!2}^j}}}{{\rm \alpha} _{k - 2j}} $$
where [.] denotes the integer part and αk is the dimensionless centered k-order moment of the distribution
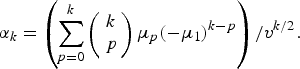 $${{\rm \alpha} _k} = \left( {\sum\limits_{p = 0}^k \left( {\matrix{ {k} \cr {\,p} \cr}} \right){{\rm \mu} _p}{{\left( { - {{\rm \mu} _1}} \right)}^{k - p}}} \right)/{v^{k/2}}. $$
A good representation of the Zeeman profile is obtained using, for each component, the fourth-order Gram–Charlier expansion series:
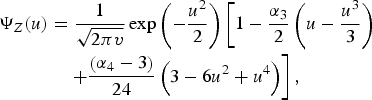 $$\eqalign{{\rm \Psi}_Z (u) &= \displaystyle{1 \over \sqrt{2{\rm \pi} v}} \exp \left( - \displaystyle{u^2 \over 2} \right)\left[1 - \displaystyle{{\rm \alpha}_3 \over 2} \left(u - \displaystyle{u^3 \over 3} \right) \right. \cr &\left. \quad + \displaystyle{\left({\rm \alpha}_4 - 3 \right) \over 24} \left(3 - 6 u^2 + u^4 \right) \right],} $$
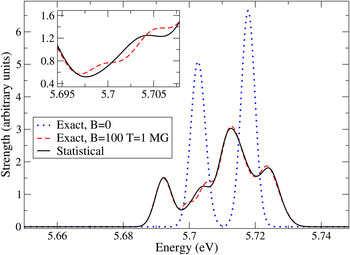
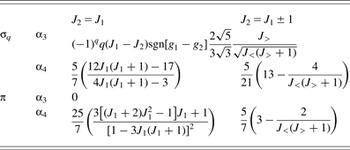
where α3 (skewness) and α4 (kurtosis) quantify respectively the asymmetry and the sharpness of the component (see Table 1) (Kendall & Stuart, Reference Kendall and Stuart1969). This approximate method was shown to provide quite a good description (see Fig. 13) of the effect of a strong magnetic field on spectral lines (Pain & Gilleron, Reference Pain and Gilleron2012a; Reference Pain and Gilleron2012b). The contribution of a magnetic field to an UTA can be taken into account roughly by adding a contribution 2/3(μBB)2 ≈ 3.35 × 10 −5 [B(MG)]2 eV2 to the statistical variance.
Effect of a 1 MG magnetic field on triplet transition 1s2s 3S→1s2p 3P of carbon ion C4+ with a convolution width (full width at half maximum) of 0.005 eV. The observation angle θ is such that cos2(θ) = 1/3.

Values of α3 and α4 of the Zeeman components. J < = min(J 1,J 2) and J > = min(J 1,J 2). sgn[x] is the sign of x.

When all the other broadening mechanisms (statistical, Doppler, and ionic Stark) are described by a Gaussian, the resulting profile (convolution of a Gaussian by Gram–Charlier) remains a Gram–Charlier function with modified moments. However, electron collisional broadening is usually modeled by a Lorentzian function
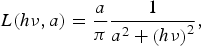 $$L(h{\rm \nu},a) = \displaystyle{a \over {\rm \pi}} \displaystyle{1 \over {{a^2} + {{\left( {h{\rm \nu}} \right)}^2}}}, $$
as well as natural width. The convolution of a Gaussian by a Lorentzian leads to a Voigt profile (Voigt, Reference Voigt1912; Matveev, Reference Matveev1972; Reference Matveev1981; Ida et al., Reference Ida, Ando and Toraya2000) but in the presence of a magnetic field, the problem is more complicated, since the numerical cost of the direct numerical convolution of a Lorentzian with Gram–Charlier function is prohibitive, due to the huge number of lines involved in the computation. It reads
 $$C(t) = \left( {GC \otimes L} \right)(t) = \int_{ - {\infty}} ^{\infty} GC\left( u \right)L(t - u,{\rm \lambda} )du, $$
where t = hv/σ,  $\sigma = \sqrt v $ being the standard deviation of the distribution and λ = a/σ.
5.3. Convolution of a Lorentzian function with Gram–Charlier Expansion Series
The convolution product (19) requires the evaluation of a cumbersome integral which reads
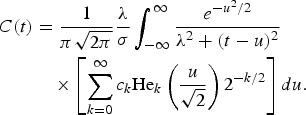 $$\eqalign{C(t) &= \displaystyle{1 \over {\rm \pi} \sqrt{2{\rm \pi}}} \displaystyle{{\rm \lambda} \over {\rm \sigma}} \int_{- {\infty}}^{{\infty}} \displaystyle{e^{- u^2/2} \over {\rm \lambda}^2 + (t - u)^2} \cr &\quad \times \left[\sum\limits_{k = 0}^{{\infty}} c_k {\rm H} {\rm e}_k \left(\displaystyle{u \over \sqrt{2}} \right) 2^{- k/2} \right]du.} $$
In order to fasten the calculation, the Gaussian is sampled at the points  $u = - m, - m + 1, \ldots, 0, \ldots, m - 1,m$ (in practice we use m = 6) and interpolated using cubic splines (de Boor, Reference De Boor1978) on each interval [k,k+1] by the formula
 $${e^{ - {u^2}/2}} = {a_k} + {b_k} u + {c_k} {u^2} + {d_k} {u^3}. $$
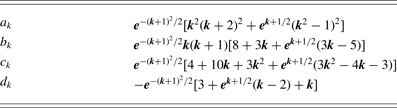
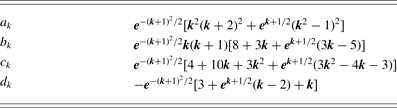
The coefficients a k, bk, ck, and d k in the interval [k,k+1] are determined by the continuity of the function and its derivative at the points u = k and u = k+1. The resulting expressions are given in Table 2. The Gaussian is assumed to be zero for  $\vert u\vert \gt m$. Limiting Gram–Charlier expansion series to fourth order [see Eq. (17)], one now has to deal with the convolution of a Lorentzian by a polynomial of order 7. This can be writtenFootnote 1
 $$C(t) = \displaystyle{1 \over {{\rm \pi} \sqrt {2{\rm \pi}} {\rm \sigma}}} \sum\limits_{\,p = - m}^{m - 1} \sum\limits_{k = 0}^7 {{\rm \gamma} _{\,p,k}} {S_{\,p,k}}(t), $$
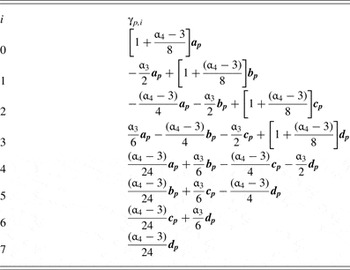
where the coefficients γp,k of the polynomial are given in Table 3, and
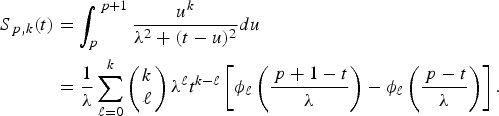 $$\eqalign{S_{\,p,k}(t) &= \int_p^{\,p + 1} \displaystyle{u^k \over {\rm \lambda} ^2 + (t - u)^2}du \cr &= \displaystyle{1 \over {\rm \lambda}} \sum\limits_{\ell = 0}^k \left(\matrix{k \cr \ell} \right) {\rm \lambda}^{\ell} t^{k - \ell} \left[{\rm \phi}_{\ell} \left(\displaystyle{\,p + 1 - t \over {\rm \lambda}} \right) - {\rm \phi}_{\ell} \left(\displaystyle{\,p - t \over {\rm \lambda}} \right) \right].} $$
The function  ${{\rm \phi} _\ell} (w)$ is equal to
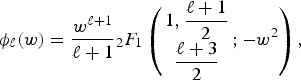 $${\rm \phi}_{\ell} (w) = \displaystyle{{{w^{\ell + 1}}} \over {\ell + 1}}{ _2}{F_1}\left( {\matrix{ {1,\displaystyle{{\ell + 1} \over 2}} \cr {\displaystyle{{\ell + 3} \over 2}} \cr} ; - {w^2}} \right), $$
where 2F 1 is a hypergeometric function, but can be efficiently obtained using the recurrence relation
 $${{\rm \phi} _\ell} (w) = {w^{\ell - 2}} - {{\rm \phi} _{\ell - 2}}(w) $$
with
 $${{\rm \phi} _0}(w) = \arctan (w)\quad {\rm and}\quad {{\rm \phi} _1}(w) = \displaystyle{1 \over 2}\ln [1 + {w^2}]. $$
Expression of the coefficients a k, bk, ck, and d k involved in the cubic-spline representation of the Gaussian [Eq. (21)] for k ≤ u ≤ k+1
Coefficients γp,i involved in Eq. (22).

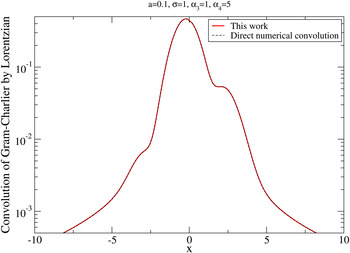
Such a method provides fast and accurate results, even for very asymmetrical and sharp Gram–Charlier distribution (see Fig. 14). The total line profile results from the convolution of ΨZ with other broadening mechanisms. If σ≤a/10, we take only the Lorentzian L(hv,a). On the other hand, if a ≤ σ/150, we keep the Gaussian. If one has to convolve C(t) by an additional Gaussian of variance σ′ (representing Doppler broadening for instance), σ, α3, and α4 must be replaced,
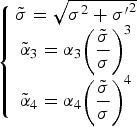 $$\left\{ {\matrix{ {\tilde {\rm \sigma} = \sqrt {{{\rm \sigma} ^2} + {{{\rm \sigma} '}^2}}} \cr {{{\tilde {\rm \alpha}} _3} = {{\rm \alpha} _3}{{\left( {\displaystyle{{\tilde {\rm \sigma}} \over {\rm \sigma}}} \right)}^3}} \cr {{{\tilde {\rm \alpha}} _4} = {{\rm \alpha} _4}{{\left( {\displaystyle{{\tilde {\rm \sigma}} \over {\rm \sigma}}} \right)}^4}} \cr}} \right. $$
Convolution of Gram-Charlier expansion series with a Lorentzian. The parameters are a = 0.1, σ = 1, α3 = 1, and α4 = 5. The present approach (red curve) relying on a cubic-spline representation of the Gaussian and the direct numerical convolution (dashed black curve) are superimposed.

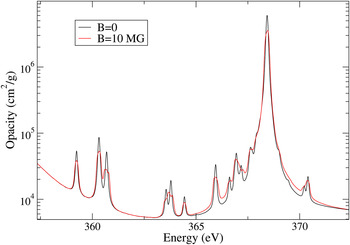
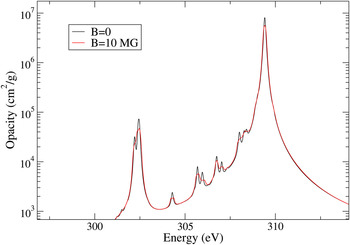
Figures 15 and 16 illustrate the impact of a 10 MG magnetic field (typical of ICF) in the XUV range for a carbon plasma at T = 50 eV and ρ = 0.01 g/cm3.
SCO-RCG calculations (transitions 1s→2p) with and without magnetic field for a carbon plasma at T = 50 eV and ρ = 10−2 g cm−3 (conditions typical to ICF).

SCO-RCG calculations (transitions 1s→2p) with and without magnetic field for a carbon plasma at T = 50 eV and ρ = 10−2 g cm−3 (conditions typical to ICF) in a spectral range close to the one of Figure 15.

6. CONCLUSION
By combining different degrees of approximation of the atomic structure (levels, configurations, and superconfigurations), the SCO-RCG code allows us to explore a wide range of applications, such as the calculation of Rosseland means, the generation of opacity tables, or the spectroscopic interpretation of high-resolution spectra. The PRTA model was recently adapted to the hybrid statistical/detailed approach in order to reduce the statistical part and speed up the calculations. An approximate approach providing a fast and quite accurate estimate of the effect of an intense magnetic field on opacity was also implemented. The formalism requires the moments of the Zeeman components of a line αJ→α′J′, which can be obtained analytically in terms of the quantum numbers and Landé factors and the profile is modeled by the fourth-order A-type Gram–Charlier expansion series. We also proposed a fast and accurate method to perform the convolution of this Gram–Charlier series with a Lorentzian function. Such an algorithm is useful in order to account for distorsions of the Voigt profile, since the direct numerical evaluation of the integral becomes rapidly prohibitive. More generally, it can be helpful for models relying on the theory of moments (Bancewicz & Karwowski, Reference Bancewicz and Karwowski1987), used in most opacity and emissivity codes. In the future, we plan to extend the statistical modeling of Zeeman effect using temperature-dependent moments (see Appendix) and to improve the treatment of Stark broadening in order to increase the capability of the code as concerns K-shell spectroscopy.
Appendix A: Temperature-Dependent Moments of Zeeman Hamiltonian
Polarized synchrotron radiation can be used to determine the magnitude, the orientation and the temperature and magnetic-field dependence of the local rare-earth magnetic moment in magnetically ordered materials. Thole et al. (Reference Thole, Van Der Laan and Sawatzky1985) proposed a theory which predicts an anomalously large magnetic dichroïsm in the M 4,5 X-ray absorption-edge structure. The square of the matrix element of an optical dipole transition from a state αJM to a final state α′J′M′ is, according to the Wigner–Eckart theorem, proportional to the square of the 3j symbol times the reduced matrix element (line strength in the absence of a magnetic field):
 $${S_{{\rm \alpha} JM,{\rm \alpha} 'J'M'}} = {\left( {\matrix{ J & 1 & {J'} \cr M & q & { - M'} \cr}} \right)^2}\vert \langle {\rm \alpha} J\vert \vert {C^{(1)}}\vert \vert {\rm \alpha} 'J'\rangle {\vert ^2}, $$
where α labels different levels of equal J and q = 0 for light polarized in the field direction, q = ±1 for right- or left-circularly polarized light perpendicular to the field direction. The partition function associated to a particular level αJ reads
 $${Z_{{\rm \alpha} J}} = \sum\limits_{M = - J}^J {e^{ - {C_{{\rm \alpha} J}}M}} = \displaystyle{{\sinh \left[ {{C_{{\rm \alpha} J}}(J + 1/2)} \right]} \over {\sinh ({C_{{\rm \alpha} J}}/2)}}, $$
where C αJ = μBBg αJ/(k BT), μB being the Bohr magneton, B the intensity of the magnetic field, and g αJ the Landé factor of level αJ in intermediate coupling. The first-order moment can be expressed as
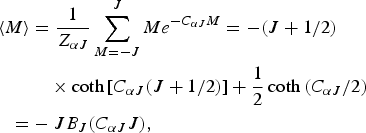 $$\eqalign{\langle M\rangle &= \displaystyle{1 \over Z_{{\rm \alpha} J}} \sum\limits_{M = - J}^J Me^{ - C_{{\rm \alpha} J}M} = - (J + 1/2) \cr &\quad \times \coth \left[C_{{\rm \alpha} J}(J + 1/2) \right] + \displaystyle{1 \over 2}\coth \,(C_{{\rm \alpha} J}/2) \cr = & - J B_J (C_{{\rm \alpha} J}J),} $$
where B J denotes Brillouin's function (Darby, Reference Darby1967; Subramanian, Reference Subramanian1986):
 $${B_J}(x) = \displaystyle{{2J + 1} \over {2J}}\coth \left( {\displaystyle{{2J + 1} \over {2J}}x} \right) - \displaystyle{1 \over {2J}}\coth \left( {\displaystyle{x \over {2J}}} \right). $$
For <M 2>, one has
 $$\langle {M^2}\rangle = \displaystyle{1 \over {{Z_{{\rm \alpha} J}}}}\sum\limits_{M = - J}^J {M^2}{e^{ - {C_{{\rm \alpha} J}}M}} = J(J + 1) + \langle M\rangle \coth ({C_{{\rm \alpha} J}}/2) $$
and the higher-order moments can be obtained using the following relation:
 $$\langle {M^n}\rangle = \displaystyle{{{{( - 1)}^n}} \over {{Z_{{\rm \alpha} J}}}}\displaystyle{{{{\rm \partial} ^n}{Z_{{\rm \alpha} J}}} \over {{\rm \partial} C_{{\rm \alpha} J}^n}} = \langle M\rangle \langle {M^{n - 1}}\rangle - \displaystyle{{\rm \partial} \over {{\rm \partial} {C_{{\rm \alpha} J}}}}\langle {M^{n - 1}}\rangle, $$
where  $n \in {\open N}$.
ACKNOWLEDGMENT
The authors have presented their paper in Proceedings of the 33rd ECLIM (European Conference on Laser Interaction with Matter), 30th August– 5th September 2014, Paris, France.