1. Investment needs in the Europe Union
Europe faces substantial challenges in the near future. In addition to the security threats, which necessitate an increase in defence capabilities, the continent must significantly boost its investments in climate-neutral technologies to achieve its goal of reaching net-zero CO2 emissions by 2050. This commitment is vital for Europe to take its share of responsibility in preventing global temperatures from rising further, with severe economic and social consequences of the resulting global climate crisis (Copernicus Climate Change Service and World Meteorological Organization, 2025). Beyond decarbonization and defence, Europe also needs to invest in its digital infrastructure.
Europe’s investment gap is widely acknowledged and scientifically reasonably well documented (Draghi, Reference Draghi2024; European Central Bank, 2024b; Heimberger and Lichtenberger, Reference Heimberger and Lichtenberger2023; Institut Rousseau, 2024; Koch et al., Reference Koch, Biegon, Fleckenstein, Krüger, Rohde, Korinek, Bertram, Mühlbach, Wiese, Schuster and Carvalho2024). To close the investment gap, it is estimated that ~850 bn EUR, or around 5% of European gross domestic product (EU GDP), is needed in additional investments each year for the period 2027–2034. Around one-fifth to one-quarter of this amount is expected to be public investment. In other words, additional public investment of the order of 1% of EU GDP, or ~170 bn EUR, is needed every year during this period. The bulk of these additional public investments is needed to decarbonize our economies (around 80 %), followed by defence and digital investments (each accounting for ~10%) (European Central Bank, 2024b).Footnote 1
While recent political debates have understandably focused on increasing investments for defence, we instead examine the macroeconomic effects of decarbonising Europe’s economies. Recent studies suggest that the economic damages caused by climate change may be even higher than previously assumed (Bilal and Känzig, Reference Bilal and Känzig2026; Burke et al., Reference Burke, Zahid, Diffenbaugh and Hsiang2026).
Against the backdrop of last year’s reformed EU fiscal rules, the European Commission’s debt sustainability analysis, which has now moved to the centre of the framework, indicates that many member states will face significant fiscal consolidation efforts in the coming years (Paetz and Watzka, Reference Paetz and Watzka2024). In the context of limited national fiscal space, it will be extremely challenging for member states to prioritize public investment in a manner that not only protects it but also stimulates it to the necessary extent described above.
Particularly in the provision of European public goods—where climate policy is included alongside, for instance, research and development expenditure, as well as foreign and security policy—an EU investment fund has the advantage of financing the necessary transformation expenditures more efficiently than most member states could achieve individually. The Recovery and Resilience Facility (RRF), the debt-financed EU investment capacity developed in recent years and the principal instrument of Next Generation EU (NGEU), can be seen as a blueprint for organizing a public investment programme at the European level. The RRF has had a sizeable positive impact on overall EU GDP growth and the potential output of member states (Bańkowski et al., Reference Bańkowski, Benalal, Bouabdallah, de Stefani, Dorrucci, Huber, Jacquinot, Modery, Nerlich, Rodríguez Vives, Szörfi, Zorell and Zwick2024; Michels et al., Reference Michels, Ciriaci, Rueda-Cantuche, Pedauga, Ferreira, Kattami, Schulz and Pilati2025; Millard, Reference Millard2025; Watzka and Watt, Reference Watzka and Watt2020).
To simulate the macroeconomic effects of a debt-financed EU investment fund, we utilize the National Institute Global Econometric Model (NiGEM)— a model of the National Institute of Economic and Social Research (NIESR). The next section abstracts from climate change and presents the results using the standard version of NiGEM. The following section then takes climate change into account and employs the climate version of NiGEM, along with input from the Network for Greening the Financial System (NGFS). Four NGFS climate policy scenarios are compared, and simulation results are shown under various considerations: (i) transitional CO2-tax effects only, (ii) transitional CO2-tax effects together with GDP damages arising from climate change and (iii) accounting in addition for an EU investment fund. A final section focuses on a scenario with an EU investment fund, but in which only the EU adheres to its net-zero by 2050 climate goal, while other world regions continue with their nationally determined contributions.
Our results show considerable negative GDP effects, along with inflationary pressures resulting from CO2 taxation alone. However, when accounting for climate change and the corresponding long-term damage to GDP, our findings show that not acting on climate change now will lead to far more severe damage in the future. An EU investment fund would help—apart from faster promoting the greening of the European economies—by cushioning the negative transitory GDP effects in the next 10 years. Finally, our results highlight the importance of cooperation to ensure that climate change policies are implemented on a global level.
2. Macroeconomic effects of an EU investment fund in a standard macroeconometric model
We simulate the macroeconomic effects of an EU investment fund using the widely recognized multi-country macroeconometric model NiGEM, developed by NIESR and employed by institutions such as the IMF, OECD and various central banks.Footnote 2 NiGEM is a comprehensive simulation and forecasting model for the global economy that incorporates typical New Keynesian elements, including the expectations of economic agents, as well as price and wage rigidities. This model allows for an examination of both the short- and long-term effects of such an economic policy on key macroeconomic variables, including GDP, private investment, inflation and the public debt ratio. Additionally, NiGEM distinguishes between public spending on investment and consumption, making it particularly suitable for analysing a long-term public investment programme. The model encompasses 18 EU member states, which collectively account for 94% of the EU population and 96% of total EU GDP. Furthermore, it includes all OECD countries, as well as numerous emerging economies, allowing our simulations to account for spillover effects resulting from international trade.
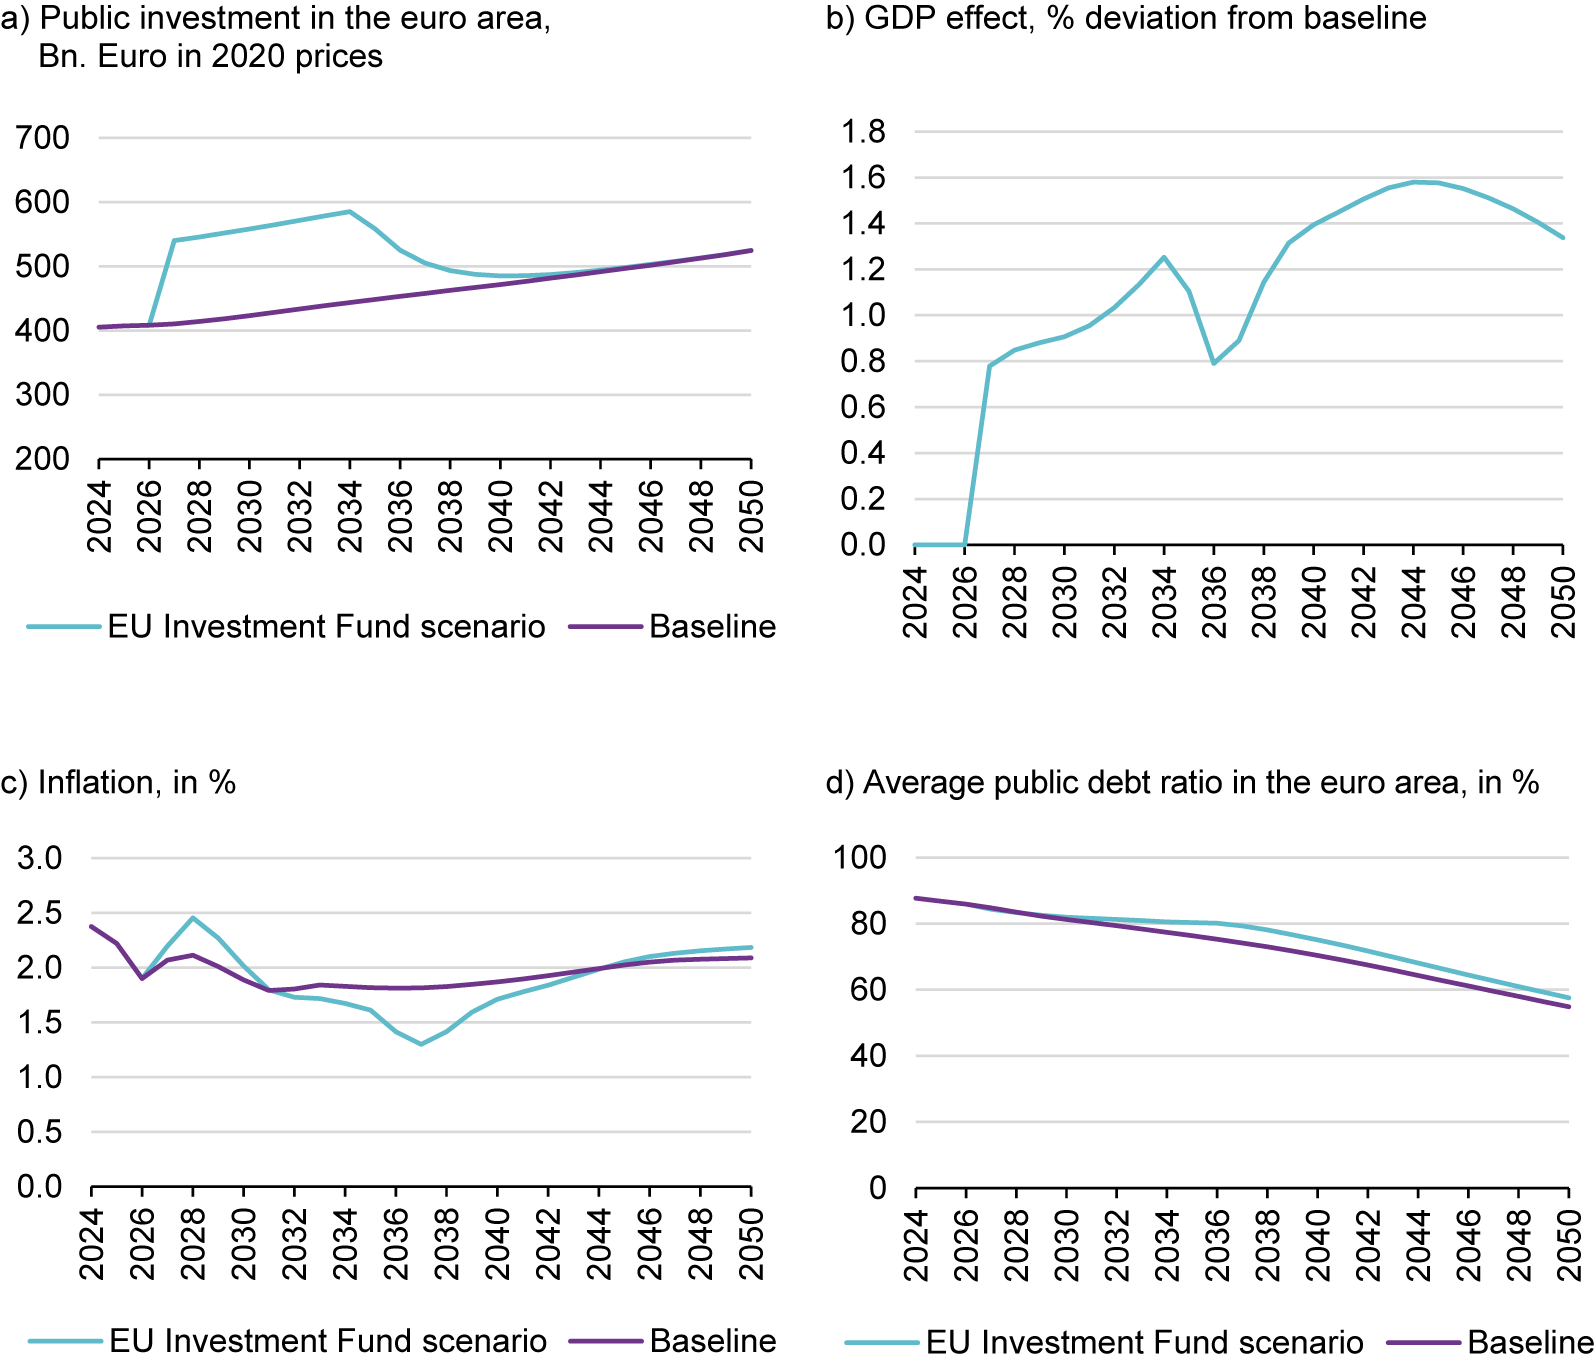
We use the aforementioned investment gap of 1% of GDP and feed it into the model by raising public investment in the EU by 1% of GDP per year. This translates to ~130 billion euros in 2020 prices in additional annual government investment in the euro area (Figure 1a). The fund is projected to cover the entire duration of the next multiannual financial framework; to be precise, it is assumed to last from 2027 to 2034. This time span helps to prevent potential cuts in public investment related to necessary adjustments due to the new fiscal rules and the expiration of existing EU programmes (NGEU). While we simulate the EU investment fund using public investment in all 18 EU member states included in NiGEM, we show results only for the euro area. This is due to variable availability in NiGEM.
Macroeconomic effects of an EU Investment Fund for the euro area.
Source: Authors’ simulations using NiGEM.

Figure 1. Long description
Panel a, Public investment in the euro area, Bn. Euro in 2020 prices. The X axis ranges from 2024 to 2050. The Y axis ranges from 200 to 700. The baseline shows a steady linear increase from 400 to approximately 525. The E U Investment Fund scenario spikes sharply in 2026 to 550, peaks near 600 in 2034, then declines to converge with the baseline by 2044.
Panel b, G D P effect, percent deviation from baseline. The X axis ranges from 2024 to 2050. The Y axis ranges from 0.0 to 1.8. The scenario line remains at 0 until 2026, then rises sharply to 0.8 in 2027. It fluctuates with a peak at 1.25 in 2034, a dip to 0.8 in 2036, and a final peak near 1.6 in 2044 before a slight decline.
Panel c, Inflation, in percent. The X axis ranges from 2024 to 2050. The Y axis ranges from 0.0 to 3.0. The baseline starts at 2.4, drops to 1.9 in 2026, and stabilizes around 2.0. The scenario line follows the baseline until 2027, peaks at 2.5 in 2028, then drops below the baseline to a trough of 1.3 in 2037 before returning to 2.2 by 2050.
Panel d, Average public debt ratio in the euro area, in percent. The X axis ranges from 2024 to 2050. The Y axis ranges from 0 to 100. Both lines show a downward trend. The baseline falls from 88 to 55. The scenario line stays slightly above the baseline from 2032 onwards, ending at approximately 58 in 2050.
It is assumed that the investments will be entirely financed by debt raised jointly by the EU member states, and which will be repaid by the member states collectively. Each member state is allocated 1% of its GDP for additional national public investment, which is accounted for by a corresponding increase in its national public debt. We reflect these assumptions in our simulation by increasing public investment of each member state by 1% of GDP and not endogenously increasing tax rates during the simulation period.Footnote 3
We assume that the European Central Bank (ECB) will support the EU’s investment initiative and will refrain from any additional interest rate reaction during the programme period (in other words, monetary policy is technically assumed to be fixed on base). Once the fund expires in 2035, we assume that monetary policy will become endogenous. The simulation results extend to 2050.
2.1. GDP effects
Figure 1b illustrates the impact on euro area GDP. The additional annual GDP compared to the baseline scenario increases from ~0.8% as an immediate response to the public investment shock to around 1.2% by the end of the programme. Subsequently, the GDP effect peaks slightly higher at 1.6% by the mid-2040s before slowly returning to 1.2% compared to the baseline at the end of the simulation horizon in 2050. The increase in public investment influences economic growth in the model through two distinct channels. First, it boosts aggregate demand. Second, public investment enhances the economy’s production potential by increasing the public capital stock. While aggregate demand rises immediately at the start of the investment programme, potential output grows with a time lag due to the gradual increase in capital stock. This supply-side enhancement simultaneously causes inflation to fall relative to the baseline, prompting the central bank to lower interest rates in the long run despite a temporary spike immediately when the programme ends.
2.2. Private investment
The public investment initiative also stimulates private investment in the euro area.Footnote 4 Due to the positive effects on aggregate demand and GDP, the investment programme encourages greater business investment activity. Private investment is projected to be ~1.1% higher immediately at the start of the programme and around 2.4% higher by the end of the investment fund. Consequently, the additional public investment will significantly contribute to mobilizing the private investment necessary for the transformation.
2.3. Inflation
Looking at the inflationary effects of the EU investment fund (Figure 1c), we find that the additional economic activity in the first years of the programme generates some upward pressure on prices in the euro area, albeit temporarily and to a limited extent only. After a few years, the increase in the capital stock has increased the economy’s production capacity, allowing companies to produce more goods and services at lower costs. This increase in supply then exerts downward pressure on prices. Given the limited inflationary effects during the programme’s duration, we believe it is reasonable to assume that the ECB will adopt an accommodating stance and maintain interest rates at the baseline. This is particularly relevant since we also assume that the ECB will not respond to the above-mentioned price-dampening effects with interest rate cuts during the final years of the programme.
2.4. Debt-to-GDP ratio
Finally, we look at the effect of the investment fund on the average public debt ratio in the euro area. Since the fund is fully debt-financed in this simulation, we observe a temporary increase in the public debt ratio in the eurozone, as shown in Figure 1d. Concerns about the potential dangers of higher public debt resulting from a credit-financed investment initiative often overlook the fact that these investments will, in part, finance themselves through higher economic growth and, consequently, increased tax revenues in the future. Therefore, the debt-to-output ratio is expected to decline as a result of the economic growth associated with the additional investments. In our simulation, the sustainability of public debt is not at risk. Instead, the public debt ratio remains on an overall downward trajectory, even if it may stagnate during the programme period. In the long run, due to the positive macroeconomic effects, the debt ratio is projected to settle very close to—and only slightly above—the baseline scenario, which excludes the public investment programme. This result indicates substantial macroeconomic benefits deriving from the fund, even when analysed within the standard model.
3. Taking climate change into account
To investigate the effects of an EU investment fund that is primarily targeted towards green investment, it is important to take economic damages arising from climate change into account. Although the uncertainty around the estimates of economic damages from climate change is huge, it seems that they have—if anything—only become bigger recently (Bilal and Känzig, Reference Bilal and Känzig2026; Burke et al., Reference Burke, Zahid, Diffenbaugh and Hsiang2026). As such, when investigating the effects of an investment fund on the greening of the European economies, one needs to take a stance on the counterfactual if preventive action is in fact not taken. This is the approach we will carry out in the following.
With the European Green Deal, the EU set itself the goal to become climate neutral by 2050. Net CO2 emissions are to be reduced to zero by then (European Commission, 2019). To facilitate this achievement, the EU set itself an interim target (‘Fit-for-55’) of reducing 55 % of CO2 emissions by 2030 (compared to the level of emissions in 1990).
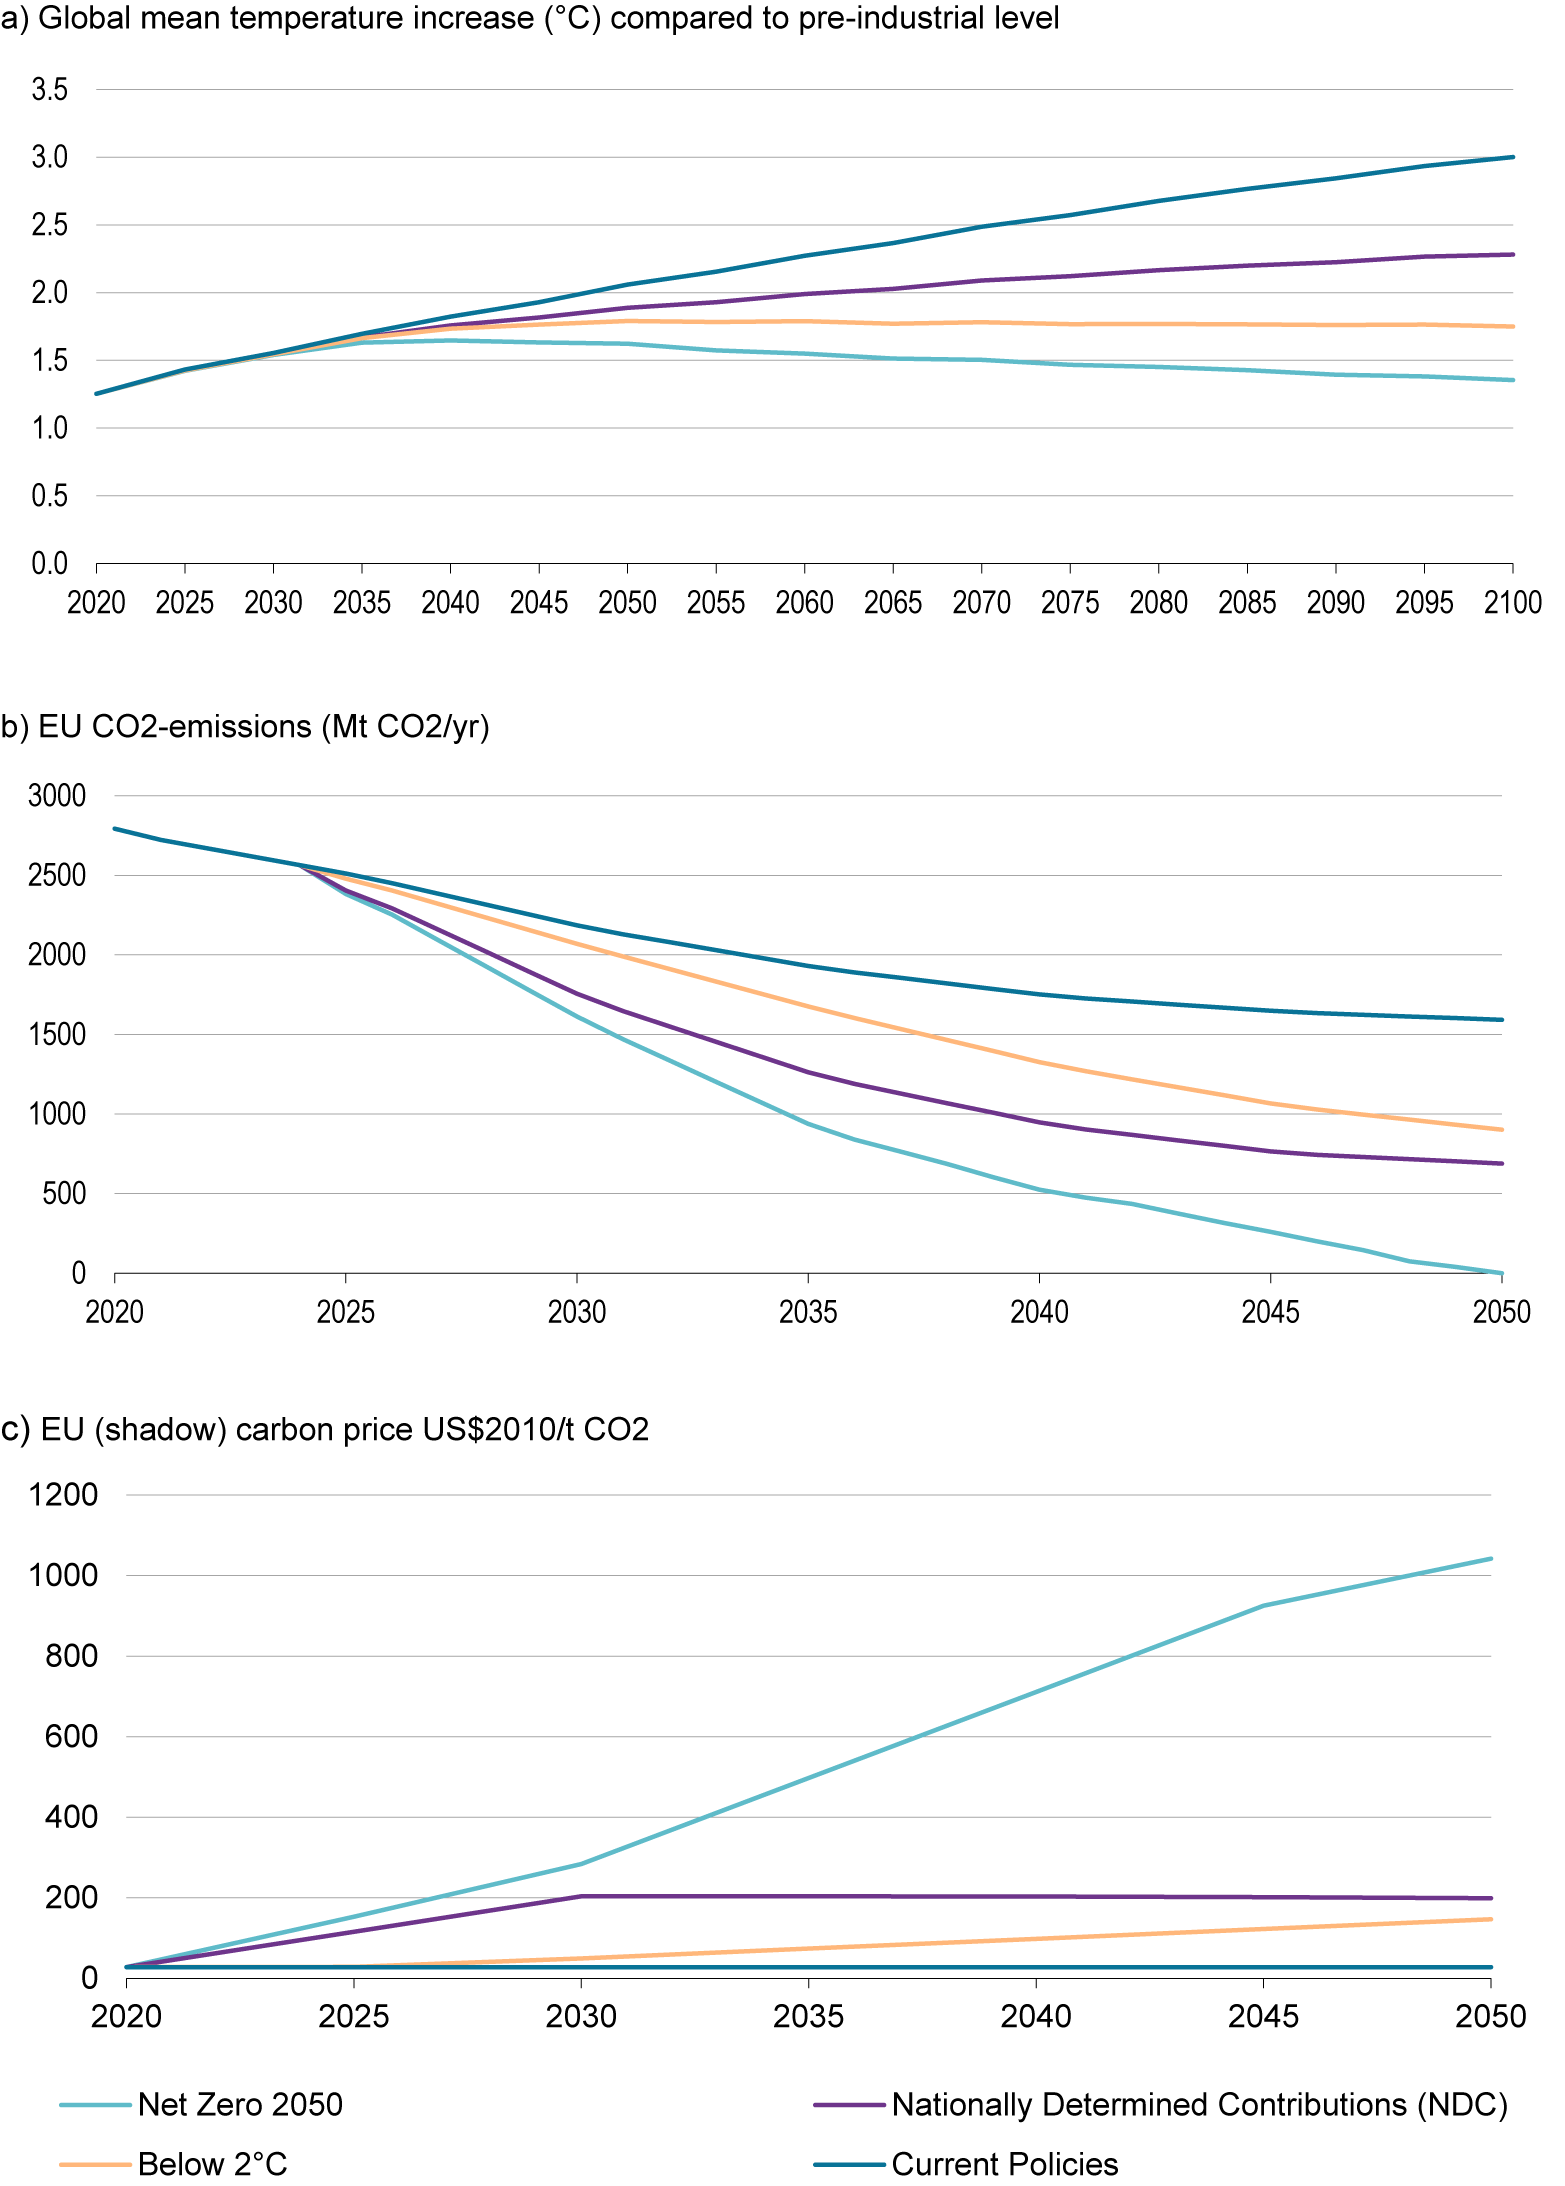
In order to account for the economic impacts of climate change, we draw on the work of the NGFS. The NGFS calculates climate change costs for seven different climate adaptation pathways and the respective temperature scenarios. In our analysis, we focus on the four scenarios Net Zero 2050 (1.5° path), NDC (Nationally Determined Contributions), Below 2°C and Current Policies from the NGFS Phase V data (Figure 2). The first of these involves limiting global warming to 1.5°C compared to pre-industrial levels and assumes strict global climate policies that ensure the achievement of net-zero CO2 emissions by 2050. This corresponds to the above mentioned European Green Deal with the goal of reducing CO2 emissions in the EU to zero by 2050. The Nationally Determined Contributions (NDC) scenario presumes that all countries worldwide will meet the climate targets they have politically committed to, regardless of whether these have already been translated into concrete laws and transition measures. In the Below 2°C scenario, it is expected that countries will progressively intensify their efforts to reduce emissions, ultimately resulting in a two-thirds chance of limiting global warming to 2°C. Current Policies, on the other hand, assume that only the climate protection measures already legally implemented will continue, with no additional climate transition measures taking place (NGFS, 2024b). Figure 2a,b shows the projected development of the global average temperature in the different scenarios relative to the pre-industrial level and the corresponding pathways of CO2 emissions in the EU until 2050.Footnote 5
Climate adaptation pathways of the four NGFS scenarios.
Sources: NGFS, NiGEM.

Figure 2. Long description
The figure consists of three panels labeled a, b, and c, sharing a common legend at the bottom with four scenarios: Net Zero 2050 (light blue), Below 2 degrees Celsius (orange), Nationally Determined Contributions N D C (purple), and Current Policies (dark blue).
Panel a: Global mean temperature increase in degrees Celsius compared to pre-industrial levels. The X-axis ranges from 2020 to 2100. The Y-axis ranges from 0.0 to 3.5. All scenarios start at 1.25 in 2020. Current Policies shows a linear increase reaching 3.0 by 2100. N D C increases to 2.3. Below 2 degrees Celsius peaks at 1.8 around 2050 and plateaus. Net Zero 2050 peaks at 1.6 around 2040 and gradually declines to 1.4 by 2100.
Panel b: E U C O sub 2 emissions in M t C O sub 2 per year. The X-axis ranges from 2020 to 2050. The Y-axis ranges from 0 to 3000. All scenarios start at 2800 in 2020. Current Policies declines to 1600. Below 2 degrees Celsius declines to 900. N D C declines to 700. Net Zero 2050 shows the steepest decline, reaching 0 by 2050.
Panel c: E U shadow carbon price in U S dollars 2010 per ton C O sub 2. The X-axis ranges from 2020 to 2050. The Y-axis ranges from 0 to 1200. Current Policies remains near 0. Below 2 degrees Celsius increases linearly to 150. N D C increases to 200 by 2030 and plateaus. Net Zero 2050 shows a sharp, non-linear increase reaching over 1000 by 2050.
According to the NGFS approach, the economic perils of climate change and adaptation can be categorized into two parts (NGFS, 2024b). First, there are the economic transition risks arising from the limitation of global warming, such as the introduction of a carbon tax, which puts pressure on certain sectors and businesses to reduce greenhouse gas emissions. These impacts are to be seen as mitigation costs. Second, there are physical risks emerging from higher global temperatures and other changed climatic conditions. This includes primarily chronic physical damage resulting from a permanent decline in productivity due to lasting changes in climatic circumstances, such as higher temperatures, less fertile soils or sea level rise. While our main simulations thus focus on accounting for those chronic risks, acute physical impacts from extreme weather events can also be included in light of the higher likelihood of floods or droughts with rising average temperatures (see Section 3.3).
To simulate the various climate-related risks and costs in NiGEM, we apply the Integrated Assessment Modelling (IAM) framework ‘REMIND-MAgPIE’ of the Potsdam Institute for Climate Impact Research (PIK).Footnote 6 This framework provides the necessary data to align the simulation calculations in NiGEM with the IAM results, both for the transition shocks due to carbon emissions reduction and for the chronic physical shocks. The corresponding chronic physical risks are based on a damage function (NGFS, 2024a). This provides country-specific GDP damages reflecting the extent of climate adaptation and CO2 emissions reduction of the different transition scenarios and their respective temperature pathways.
3.1. Mitigation costs of CO2 taxation
When modelling the transition costs of different climate adaptation pathways according to the NGFS scenario framework, two steps need to be considered. First, there is the carbon tax shock resulting from the implementation of a carbon tax to reduce greenhouse gas emissions. The IAM data provided by the REMIND-MAgPIE framework of the Potsdam Institute for Climate Impact Research (PIK) to implement the carbon tax shocks in NiGEM comprises inter alia carbon tax values, energy intensities of output and consumption levels of fossil, as well as renewable energy sources. Using this imported data, the carbon tax shock is run in NiGEM, followed by the second part of the transition shock, which involves the so-called recycling of tax revenues. In contrast to the default procedure of the NiGEM climate extension, we assume that the whole revenues of the implemented carbon tax are handed back through transfer payments to the population. Thus, we model a carbon fee and dividend system in which the revenues are completely redistributed. Even though the only supposed policy lever to drive the climate transition in the NGFS scenarios is carbon pricing, this taxation is to be seen as a shadow price, which also comprises potential other climate policy instruments. This shadow price can be understood as the marginal abatement costs of CO2, meaning the overall economic additional costs to avoid one more unit of carbon emissions by switching to a fossil-free alternative production technology. Essentially, the shadow carbon price thus represents the price difference between conventional and CO2-free production in economic activities. Ultimately, within the REMIND modelling framework, it does not matter whether the actual CO2 reduction occurs through a CO2 price at the level of these additional costs, which encourages economic agents to switch to green technologies, or whether it is partially achieved through other policy measures, such as environmental standards or subsidies for climate-neutral alternatives (NGFS, 2024b; Vogt-Schilb and Hallegatte, Reference Vogt-Schilb and Hallegatte2014; Wein, Reference Wein2025).
The EU (shadow) carbon price developments underlying the corresponding emission reduction pathways in the REMIND-MAgPIE framework are depicted in Figure 2c. While the Net Zero 2050 scenario assumes a pretty steep and largely linear increase in the shadow carbon price up to around 1000 USD (2010) per tonne of CO2 by mid-century, the Nationally Determined Contributions (NDC) scenario, which reflects the climate adaption goals set by the EU but not yet completely translated into concrete measures, foresees a much flatter rise to only 200 USD (2010) by 2030 and remaining constant at that level thereafter. The CO2 price by 2050 is only slightly lower in the Below 2°C pathway, at just under 150 €, but the price increase assumed there begins later than in the NDC scenario. It is important to note that the order of the intensity of carbon taxation is reversed when viewed globally at this point. On a global level, the Below 2°C scenario is associated with higher CO2 prices than the NDC scenario, leading to a stronger global emissions reduction overall. In Europe, however, this is reversed, as the politically targeted goals are more ambitious compared to the international standard.
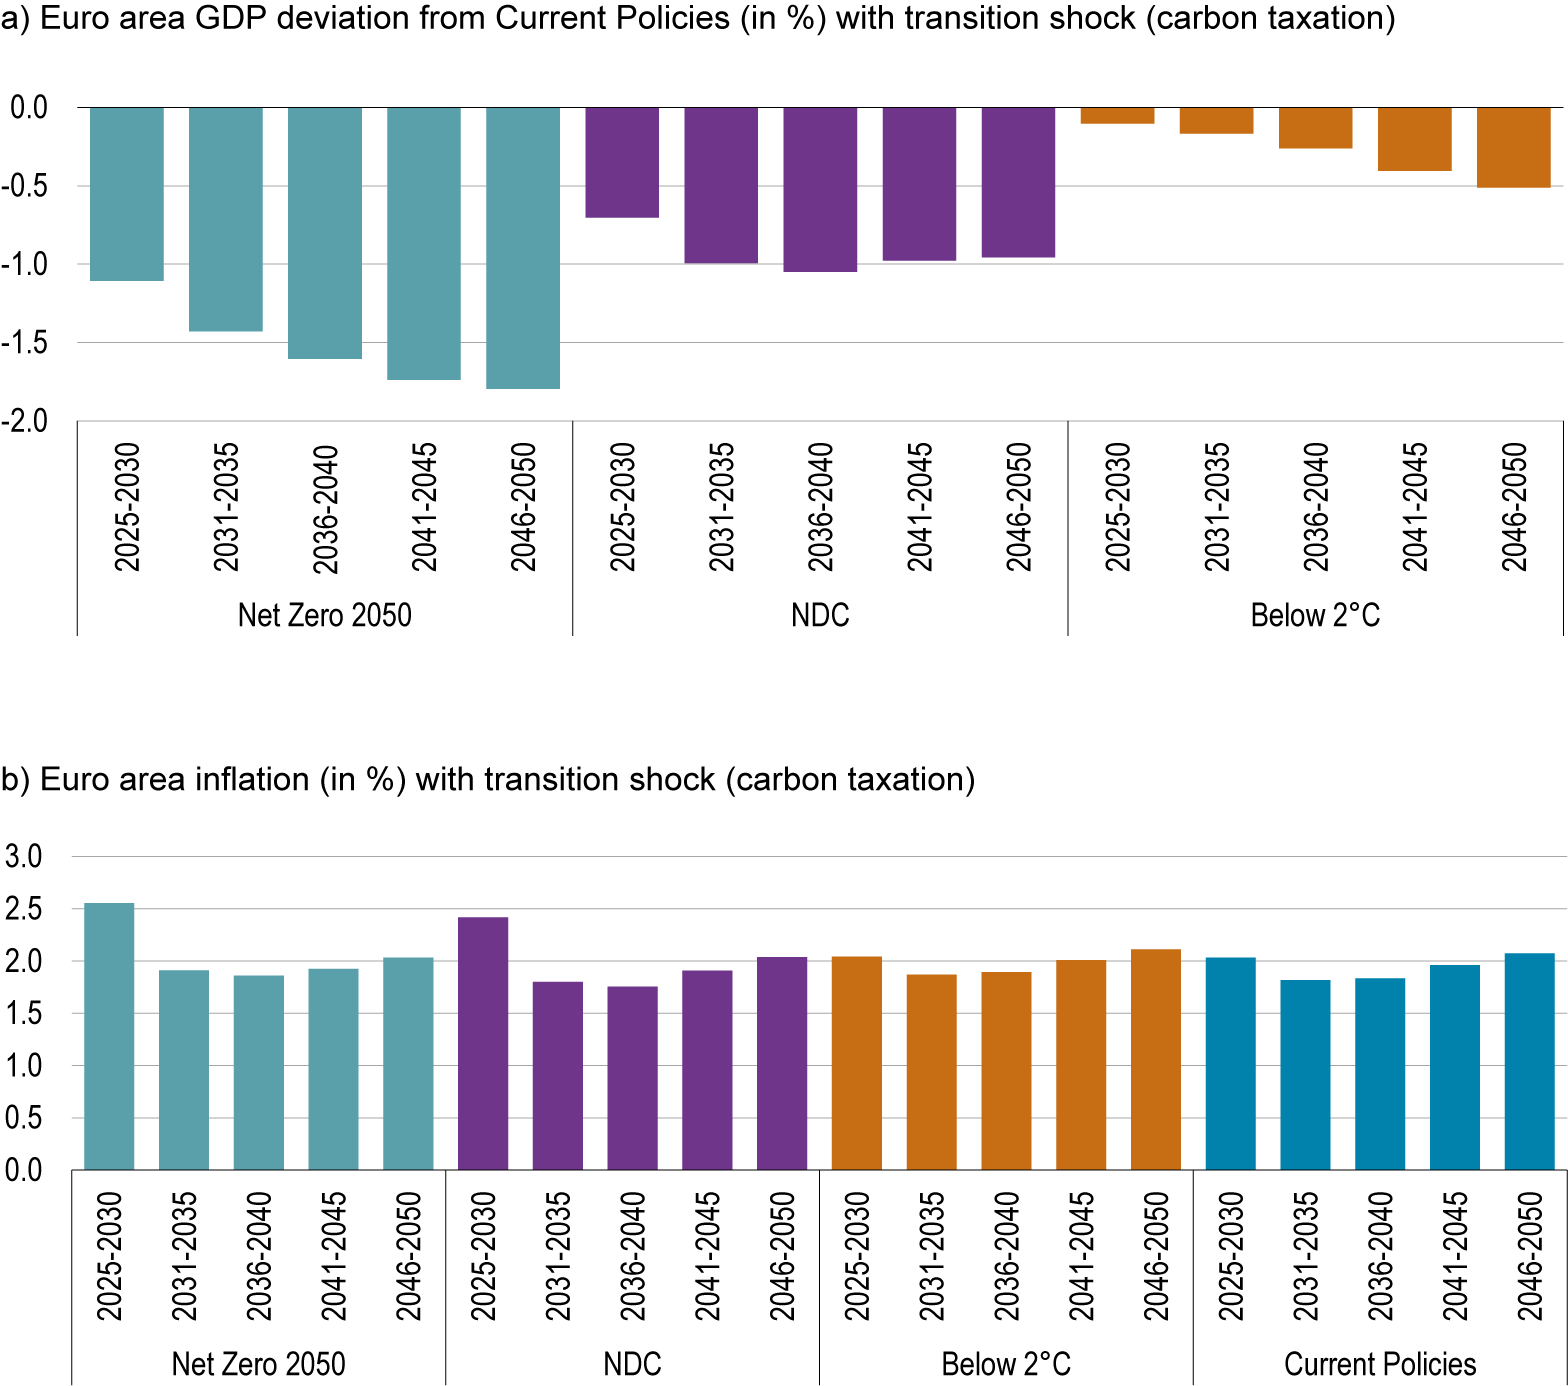
The macroeconomic effects of transitioning the European economies through the corresponding increases in CO2 taxes along the various scenarios are depicted in Figure 3. Looking at the upper panel, it can be seen that the implementation of higher carbon taxes has a substantial negative impact on euro area GDP. Compared to the Current Policies Scenario with no further increases in carbon taxation, the projected GDP in the euro area in the short-term (2025–2030) is 1.1% lower in the Net Zero 2050 scenario and 0.7% in the NDC scenario. Only in the somewhat less ambitious Below 2°C scenario is the immediate negative effect almost negligible.Footnote 7 Over the simulation horizon, carbon taxation continues—as expected—to impact GDP development negatively in the three scenarios, with rising carbon taxes leading to higher reductions of GDP vis-à-vis the Current Policies scenario. The extent of the long-run deviations from the baseline mirrors the corresponding carbon price paths of the scenarios, with GDP nearly 2% lower by 2050 in the case of the Net Zero 2050 target, while the Below 2°C scenario shows a maximum deviation of only around 0.5% lower compared to Current Policies, respectively, and NDC is roughly in between with GDP being around 1% lower.
Macroeconomic effects of various climate adaptation scenarios in the euro area.
Source: Authors’ simulations using NiGEM and based on NGFS.

Figure 3. Long description
Panel a, titled Euro area G D P deviation from Current Policies in percent with transition shock carbon taxation. The y-axis ranges from 0.0 to negative 2.0. The x-axis is divided into three scenarios, each with five 5-year intervals from 2025 to 2050.
* Net Zero 2050 (light blue bars): Shows a progressive decline in G D P, starting at negative 1.1 percent in 2025-2030 and reaching negative 1.8 percent by 2046-2050.
* N D C (purple bars): Shows a decline that stabilizes around negative 1.0 percent from 2031 onwards.
* Below 2 degrees Celsius (orange bars): Shows the smallest impact, starting near 0.0 and reaching negative 0.5 percent by 2046-2050.
Panel b, titled Euro area inflation in percent with transition shock carbon taxation. The y-axis ranges from 0.0 to 3.0. The x-axis includes four scenarios.
* Net Zero 2050 (light blue): Inflation starts high at 2.5 percent in 2025-2030, then stabilizes around 2.0 percent.
* N D C (purple): Inflation peaks at 2.4 percent in 2025-2030, then stays between 1.8 and 2.0 percent.
* Below 2 degrees Celsius (orange): Inflation remains steady between 1.9 and 2.1 percent across all periods.
* Current Policies (dark blue): Inflation remains stable, fluctuating slightly between 1.8 and 2.1 percent.
The negative effects of CO2 prices on economic performance are closely related to the inflationary impact of the taxation, which calls for interest rate increases by the central bank and weakens consumer demand. A look at the development of simulated inflation rates across the four scenarios in Figure 3b shows that especially the CO2 prices of the Net Zero 2050 scenario, and in a milder form, those of the NDC scenario, induce an increase in inflation in the short term. However, this inflationary trend diminishes over the course of a few years. Overall, the inflationary effects of CO2 taxation are found to be transitory and of manageable order.
3.2. Accounting for economic damage from climate change
So far, our analyses have neglected the economic damage arising from climate change. The simulated CO2-taxation paths required to achieve the various limits on temperature rises were meant to induce the agents of the model, businesses and households, to shift production and consumption towards greener goods. However, according to the NGFS modelling approach, physical risks from climate change must still be added if long-term projections are being made. This means chronic climate damages, representing a persistent reduction in productivity that occurs gradually due to the scenario-specific changing climatic conditions, need to be considered (NGFS, 2024b). The chronic damages from the REMIND-MAgPIE model data we used stem from an empirical damage function, which links the different temperature paths of the scenarios to the resulting levels of economic damage. Particularly noteworthy about these damage estimates is that lagged effects are also included to better capture the persistence of the altered climatic conditions due to global warming (NGFS, 2024a).Footnote 8 However, potential tipping points of climate change, which could lead to irreversible additional global warming and corresponding climate damages, are not considered (NGFS, 2024a). In a second step, we will also consider acute risks resulting from extreme weather events (see Section 3.3).
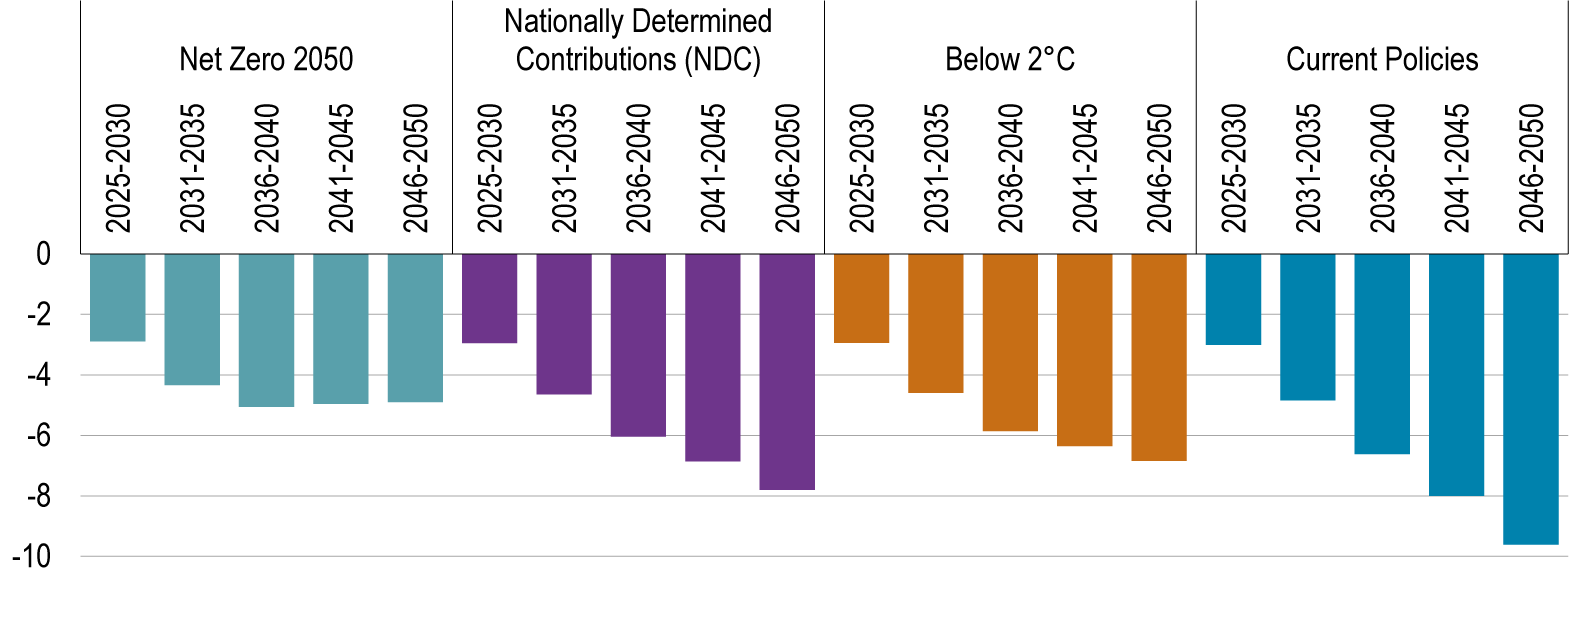
Figure 4 shows the chronic damage resulting from a permanent reduction in productivity due to changing climatic conditions. All these values should be seen as deviations from a counterfactual baseline with no physical damages caused by climate change (NGFS, 2024b). Accordingly, in the Current Policies scenario, chronic climate damages will lead to a macroeconomic income loss of more than 9% in the euro area by 2050. However, with more ambitious emission reductions at the European and global level, this can be significantly reduced. In the Net Zero 2050 scenario, the chronic macroeconomic damage in 2050 is reduced to only half the size, with GDP loss <5%. Considering these damages, it is already evident that the economic costs of the transition shock of the previous section from implementing a carbon tax or other measures to reduce emissions are more than offset by the benefits of reduced climate damages.
Chronic physical damages (5-year averages in % of GDP) in the euro area.
Source: Authors’ simulations using NiGEM and based on NGFS.

Figure 4. Long description
The chart consists of four panels, each representing a different climate scenario. The y-axis measures percentage change from 0 to minus 10. Each panel contains five bars representing 5-year averages from 2025-2030 to 2046-2050.
* Net Zero 2050 (Light Blue): Shows a downward trend starting at approximately minus 3 percent and stabilizing around minus 5 percent by 2050.
* Nationally Determined Contributions (N D C) (Purple): Shows a steady decline from minus 3 percent in 2025-2030 to nearly minus 8 percent by 2046-2050.
* Below 2 degrees Celsius (Orange): Shows a decline from minus 3 percent in 2025-2030 to approximately minus 7 percent by 2046-2050.
* Current Policies (Dark Blue): Shows the most severe impact, with a linear decline starting at minus 3 percent and reaching nearly minus 10 percent by the final period of 2046-2050.
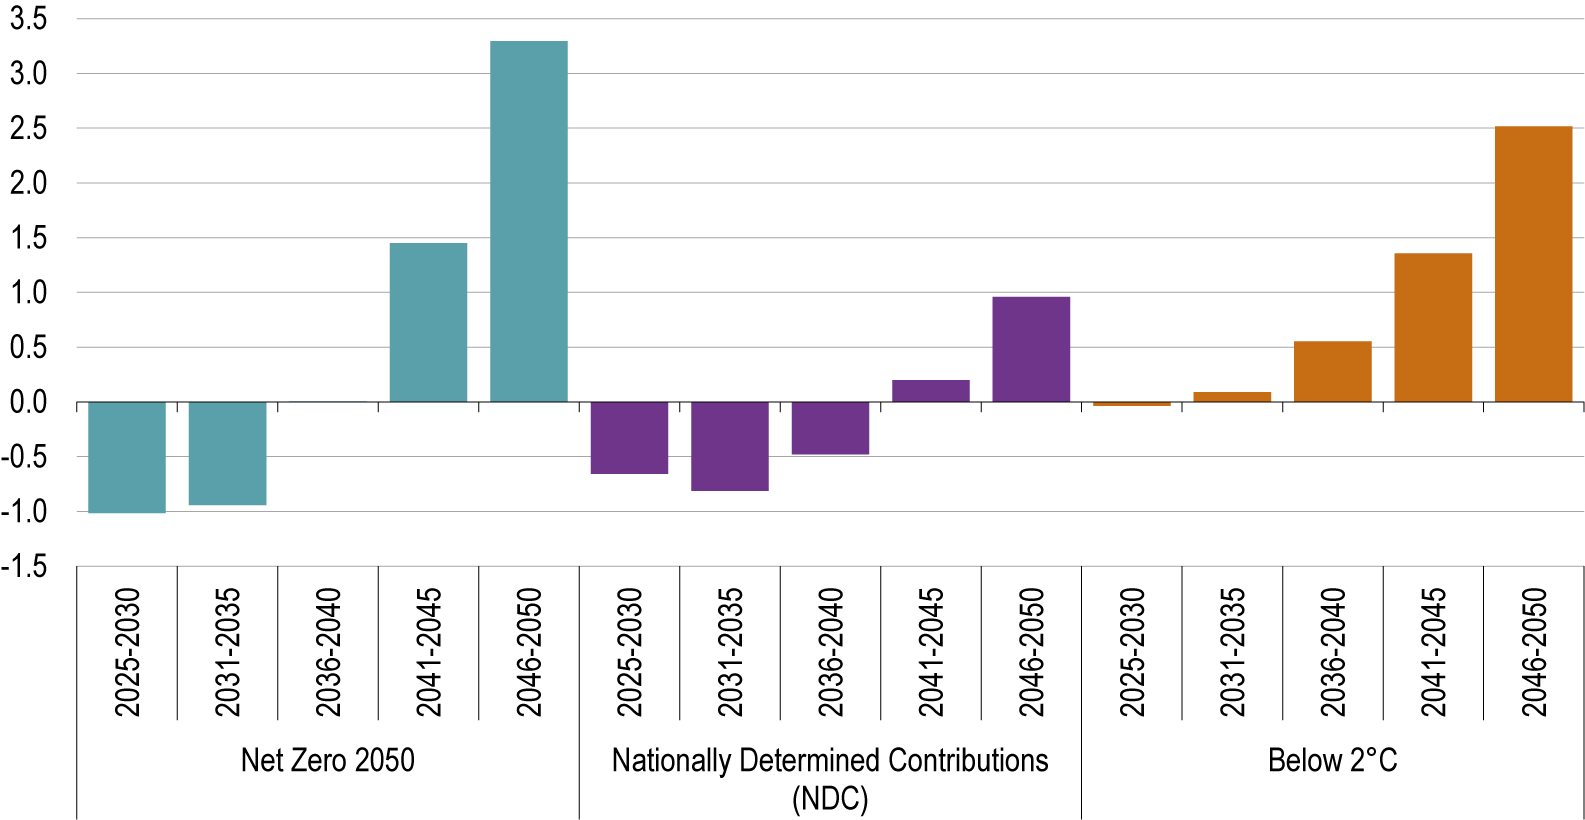
Figure 5 shows the GDP deviations of the three more ambitious scenarios from the Current Policies scenario, now including the transition shock, that is, the CO2 taxation and revenue recycling through transfers, as well as the chronic climate-related economic damages. The scenarios with more ambitious climate adaption project better economic development in the long term due to lower physical damages, even though the higher CO2 prices are temporarily dragging down output. While the Net Zero 2050 scenario projects GDP about 1% lower in the first 10 years of the simulation period compared to the Current Policies scenario, the projected GDP is substantially higher after 2040. By the end of the simulation period, a GDP deviation of almost +3.5% between the Net Zero 2050 and Current Policies scenarios is projected. The two other scenarios, NDC and Below 2°C, also show long-term GDP benefits, albeit to a lesser extent. While they are accompanied by lower transition costs in the earlier years due to a smaller carbon tax than in the Net Zero 2050 case, they also lead to less pronounced GDP increases compared to the Current Policies in the long run, with approximately +1% for the NDC and +2.5% in the Below 2°C scenario in the period 2046–2050.
Euro area GDP deviation from Current Policies scenario (in %) with transition shock and chronic damages.
Source: Authors’ simulations using NiGEM and based on NGFS.

Figure 5. Long description
The Y-axis represents percentage deviation from 3.5 to negative 1.5 in increments of 0.5. The X-axis is divided into three scenarios, each containing five 5-year time intervals from 2025 to 2050.
* Net Zero 2050 (light blue bars): Shows an initial drop of approximately negative 1.0 percent in 2025-2030 and 2031-2035. There is no bar for 2036-2040. It then rises sharply to positive 1.5 percent in 2041-2045 and peaks at roughly 3.3 percent in 2046-2050.
* Nationally Determined Contributions (N D C) (purple bars): Shows negative deviations for the first three periods, reaching a low of negative 0.8 percent in 2031-2035. It turns positive in 2041-2045 at 0.2 percent and reaches nearly 1.0 percent by 2046-2050.
* Below 2 degrees Celsius (orange bars): Shows a negligible negative deviation in 2025-2030, followed by a steady linear increase from 0.1 percent in 2031-2035 to approximately 2.5 percent in 2046-2050.
3.3. Considering tail risk by taking acute damages into account
Apart from incorporating chronic physical risks of climate change, the NGFS approach also foresees, in a further step, to include acute damages resulting from extreme weather events against the backdrop of their higher likelihood with rising average temperatures. The corresponding data for these acute weather impacts stem from Climate Analytics and cover damages caused by droughts, heatwaves, floods and cyclones (NGFS, 2024b). In Europe, as well as globally, the main part of the acute physical risks is attributed to droughts and heatwaves.
However, the risk of double-counting physical damages through mere aggregation of chronic and acute physical risks cannot be ruled out, and the extent of this cannot be precisely assessed. This is primarily because the damage function used to estimate the chronic damages does not only consider the global average temperature but also includes other climatic variables that are more correlated with extreme weather events (NGFS, 2024a). Therefore, we refrain from simply adding acute climate damages to the chronic damages in the main simulations of the scenarios. Nevertheless, it makes sense to take a closer look at the extent of these potentially additional damages caused by extreme weather events. Acute risks can still be meaningfully incorporated to assess the possibility of additional tail risks, which should be seen as an impact of stochastic uncertainty.
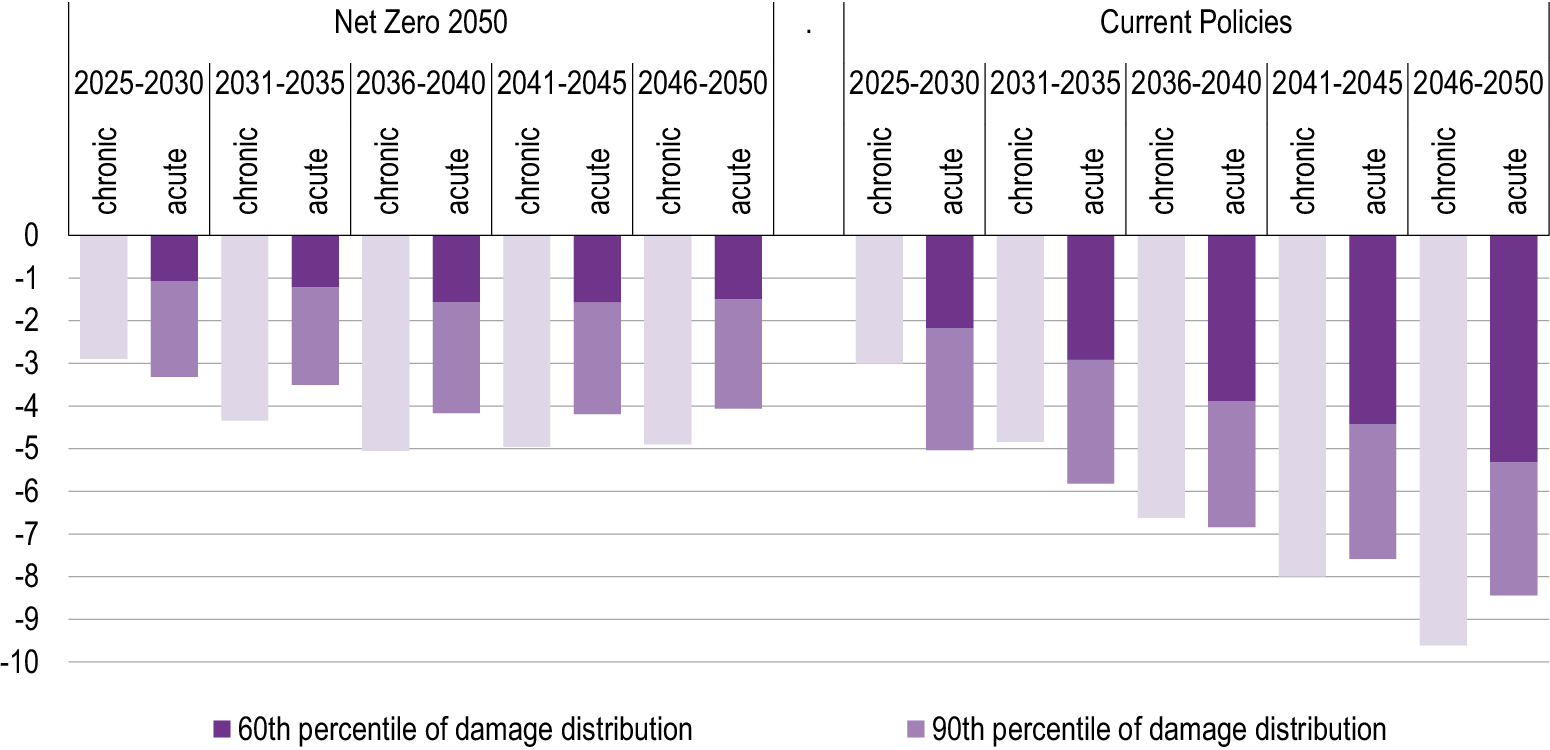
Figure 6 shows the estimated acute damages from extreme weather events in the euro area as a percentage of GDP until 2050 for the two scenarios, Net Zero 2050 and Current Policies. Footnote 9 The damage levels should again be seen as deviations from a counterfactual baseline without any physical damage caused by climate change. To facilitate comparison, the corresponding chronic damages are also shown. To make the extent of uncertainty of the acute damages more apparent, we show both the 90th percentile of the distribution for the damage estimates (as it is used by the NGFS in their representations) (NGFS, 2024c) and the 60th percentile, which is the most conservative estimate of acute damages provided by Climate Analytics.
Acute and chronic physical damages (in % of GDP) in the Euro area.
Source: Authors’ simulations using NiGEM and based on NGFS.

Figure 6. Long description
The chart consists of two panels. The Y-axis represents the percentage of G D P, ranging from 0 at the top to negative 10 at the bottom. The X-axis is divided into five five-year intervals from 2025 to 2050. Each interval contains two bars: chronic and acute. A legend at the bottom identifies dark purple as the 60th percentile of damage distribution and light purple as the 90th percentile.
* Left Panel: Net Zero 2050. Chronic damages show a gradual increase in G D P loss, peaking around negative 5 percent at the 90th percentile by 2040 before stabilizing. Acute damages remain relatively stable, with the 90th percentile hovering around negative 4 percent.
* Right Panel: Current Policies. This panel shows a much steeper downward trend. Chronic damages reach nearly negative 10 percent of G D P by 2050 at the 90th percentile. Acute damages also show significant growth in loss, with the 60th percentile reaching negative 5 percent and the 90th percentile exceeding negative 8 percent by the final period.
The depicted values show that the acute damages from extreme weather events in the euro area could amount to up to 8% of GDP in the Current Policies scenario by the middle of the century, or, according to the more conservative estimate of the 60th percentile, around 5%. By contrast, the Net Zero 2050 scenario limits the income loss due to acute damages to 4% or 1.5%, respectively.
If the acute damages were included in the NiGEM simulations by adding them on top of the chronic damages, the long-term benefits of an ambitious climate policy would become even more pronounced. Assuming that acute damages were indeed occurring fully complementary in what could be called a tail risk scenario would mean that an effective limit of the temperature increase to 1.5°C with the Net Zero 2050 scenario results in a GDP level that is ~8–9 percent higher (depending on the chosen percentile of acute damages) than in the Current Policies scenario by mid-century. Furthermore, the transition costs of carbon pricing are outweighed much earlier in the simulations that include acute risks, as the physical damages avoided through emission reductions manifest sooner and with greater magnitude if extreme weather events are taken into account.
3.4. Role of an EU investment fund to promote decarbonisation in Europe
Based on the climate adaptation scenarios presented above, we now study the role of an EU investment fund to promote the decarbonization of our economies. We assume that EU member states will invest an additional 1% of their GDP annually from 2027 to 2034. These public investments are assumed to be debt-financed and intended to support the green transition of the European economy. As in Section 2, we assume that the ECB will support the EU’s investment initiative and accommodate the programme during its duration by keeping interest rates exogenous. Once the fund expires in 2035, we assume that monetary policy will become endogenous again.Footnote 10
The additional public investment into the green transition is supposed to increase the efficiency and availability of green technologies and thus make them less costly to adopt in the long term. To account for this effect, we assume in the EU investment fund scenario that the shadow carbon price path is somewhat reduced. To give a numerical example, the carbon price path is assumed to be 10% lower than in the Net Zero 2050 scenario.Footnote 11
This assumption on the shadow price of carbon emissions deserves some more critical comments. On the one hand, the investment fund could be used for untargeted lump-sum subsidies or transfer bonuses to compensate businesses or households for the increased CO2 costs. Such measures would most likely not reduce the social marginal abatement costs, that is, the shadow carbon price, of greenhouse gas emissions, as they do not (sustainably) alter the price differences between a unit of output based on fossil energy production and one based on green energy production (see, e.g., Vogt-Schilb and Hallegatte, Reference Vogt-Schilb and Hallegatte2014). Instead, lump-sum subsidies to firms or transfers to households merely compensate for higher CO2 taxation through government spending, thereby shifting the costs to the tax-paying public. While this could still be in the interest of society in order to distribute the burdens of the transition costs related to climate adaptation more equitably, the shadow price of CO2, which corresponds to the marginal abatement costs, would remain largely unchanged.
On the other hand, if targeted appropriately, a European investment fund would at least, to some extent, reduce the shadow carbon price provided that the investment or subsidies in the development of more climate-friendly technologies sustainably reduce the transition costs from fossil to CO2-free production.Footnote 12 Thus, under the assumption that the public investments or subsidies increase the efficiency and availability of green alternative technologies and reduce their costs in the long term, the marginal CO2 abatement costs will decrease. In our simulations of the EU investment fund scenario in the climate version of NiGEM, we therefore implement a shadow carbon price that is assumed to be 10% lower than in the Net Zero 2050 scenario.
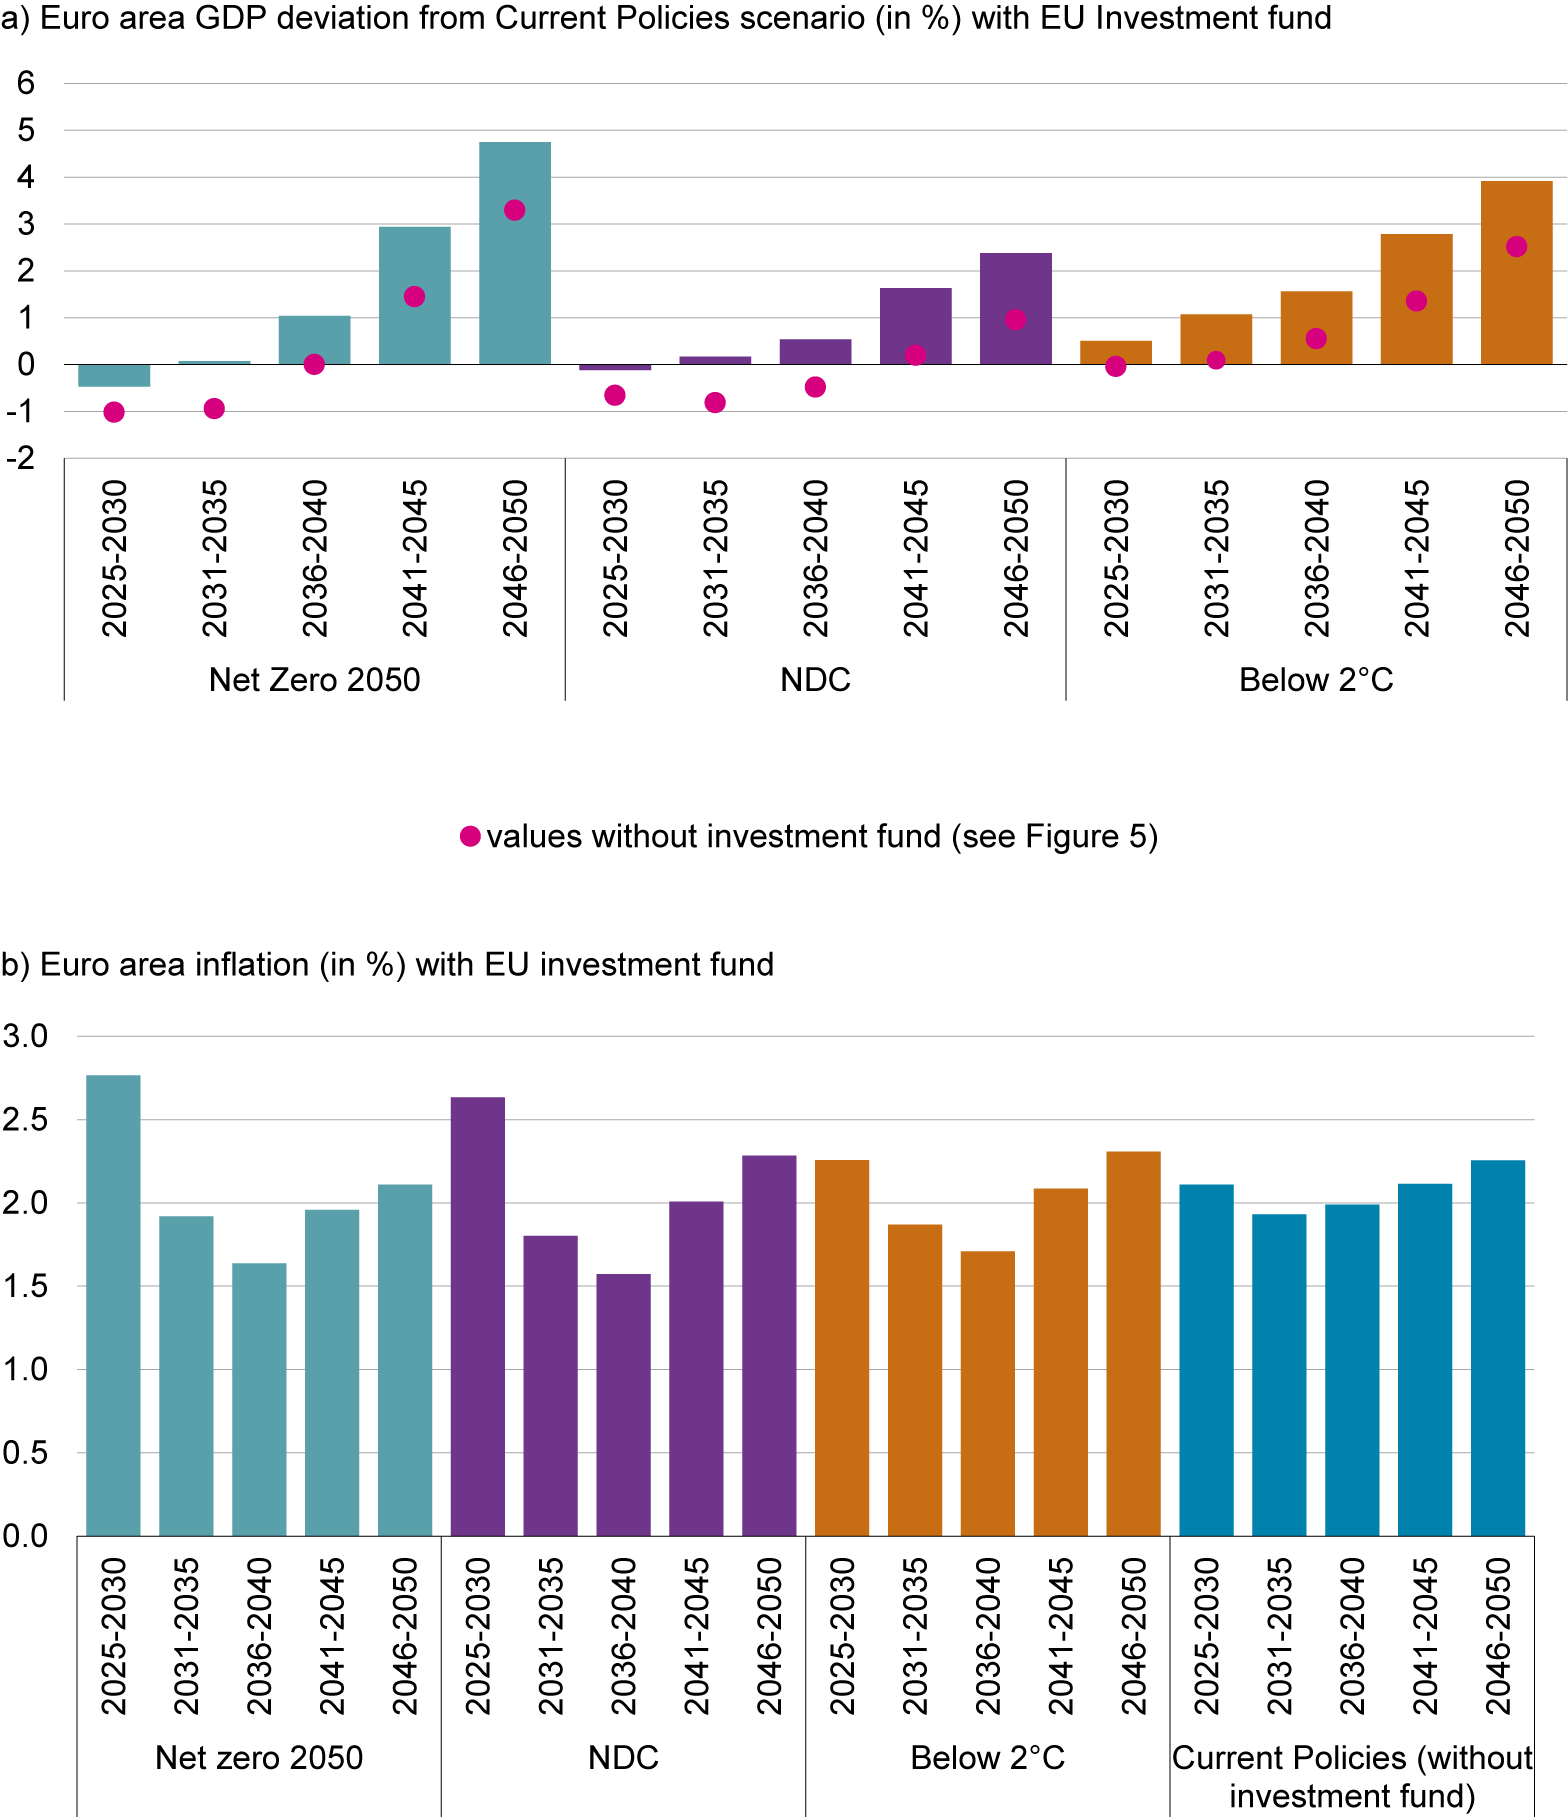
Figure 7a shows the Net Zero 2050, NDC and Below 2°C scenarios, and each scenario supplemented by the EU investment fund, the percentage deviation of GDP from the projected value of the Current Policies scenario, the latter without the fund. Compared to the performance of the NGFS scenarios of the transition shock and chronic damages but without the investment fund (see Figure 5 and depicted as points for comparison here), it is noticeable that the initial negative effects of CO2 taxation in the three scenarios in relation to the Current Policies path are significantly mitigated. In the Net Zero 2050 scenario, GDP is projected to be 1% lower in the immediate period from 2025 to 2030. However, with the establishment of the investment fund, this figure is now only about 0.5% lower. In the Below 2°C scenario, the public investment impulse even leads to a slightly higher GDP than in the Current Policies scenario already in the first years of the simulation.
Macroeconomic effects of an EU investment fund.
Source: Authors’ simulations using NiGEM and based on NGFS.

Figure 7. Long description
A multi-panel figure containing two bar charts.
Panel a: Euro area G D P deviation from Current Policies scenario in percent with E U Investment fund. The y-axis ranges from minus 2 to 6. The x-axis is divided into three climate scenarios, each with five 5-year time intervals from 2025 to 2050.
* Net Zero 2050 (light blue bars): Starts at minus 0.5 in 2025-2030 and increases to nearly 5 percent by 2046-2050. Pink dots representing values without the fund are consistently lower, reaching only about 3.5 percent.
* N D C (purple bars): Starts near 0 and increases to approximately 2.5 percent by 2046-2050. Pink dots are lower, staying below 1 percent.
* Below 2 degrees Celsius (orange bars): Increases from 0.5 to 4 percent. Pink dots are lower, reaching 2.5 percent.
Panel b: Euro area inflation in percent with E U investment fund. The y-axis ranges from 0.0 to 3.0. The x-axis includes the three previous scenarios plus a Current Policies baseline.
* Net Zero 2050 (light blue): Fluctuates between 1.6 and 2.8 percent.
* N D C (purple): Fluctuates between 1.6 and 2.6 percent.
* Below 2 degrees Celsius (orange): Fluctuates between 1.7 and 2.3 percent.
* Current Policies without investment fund (dark blue): Remains relatively stable between 1.9 and 2.3 percent.
Even after the investment programme ends in 2034, a sustainably higher GDP is projected in all three scenarios, and GDP continues to remain higher in the long term compared to the scenarios without the investment programme. By 2050, the Net Zero 2050 path (as well as the other two ambitious climate adaptation paths) proves to be even more advantageous when combined with the European investment fund. Instead of GDP being 3% higher compared to the Current Policies scenario, the implementation of the investment fund leads to nearly a 5% positive deviation by mid-century. This positive long-term effect is largely due to the investment fund raising potential GDP via its positive effect on the capital stock. When additionally taking into account the acute physical risks resulting from extreme weather events, the increase compared to the Current Policies scenario could even amount to nearly 10% by mid-century.
Similar to the findings of the investment fund in the standard NiGEM model in Section 2, the inflationary effect of the investment fund is again found to be very limited according to our simulations (Figure 7b). Compared to the simulated inflation resulting solely from the implementation of a higher carbon tax (see Section 3.1), the additional investment activity leads to a projected inflation rate that is higher by just a few tenths of a percentage point in the first years of the simulation. However, even during the ongoing investment programme after 2030, the inflation rate in all scenarios falls below the 2% target. In fact, due to the public investment fund increasing productive capacity, inflation is found to be somewhat lower for much of the time. This holds compared to the Current Policies scenario without an investment fund (Figure 7b) as well as compared to the carbon tax transition scenarios (Figure 3b).
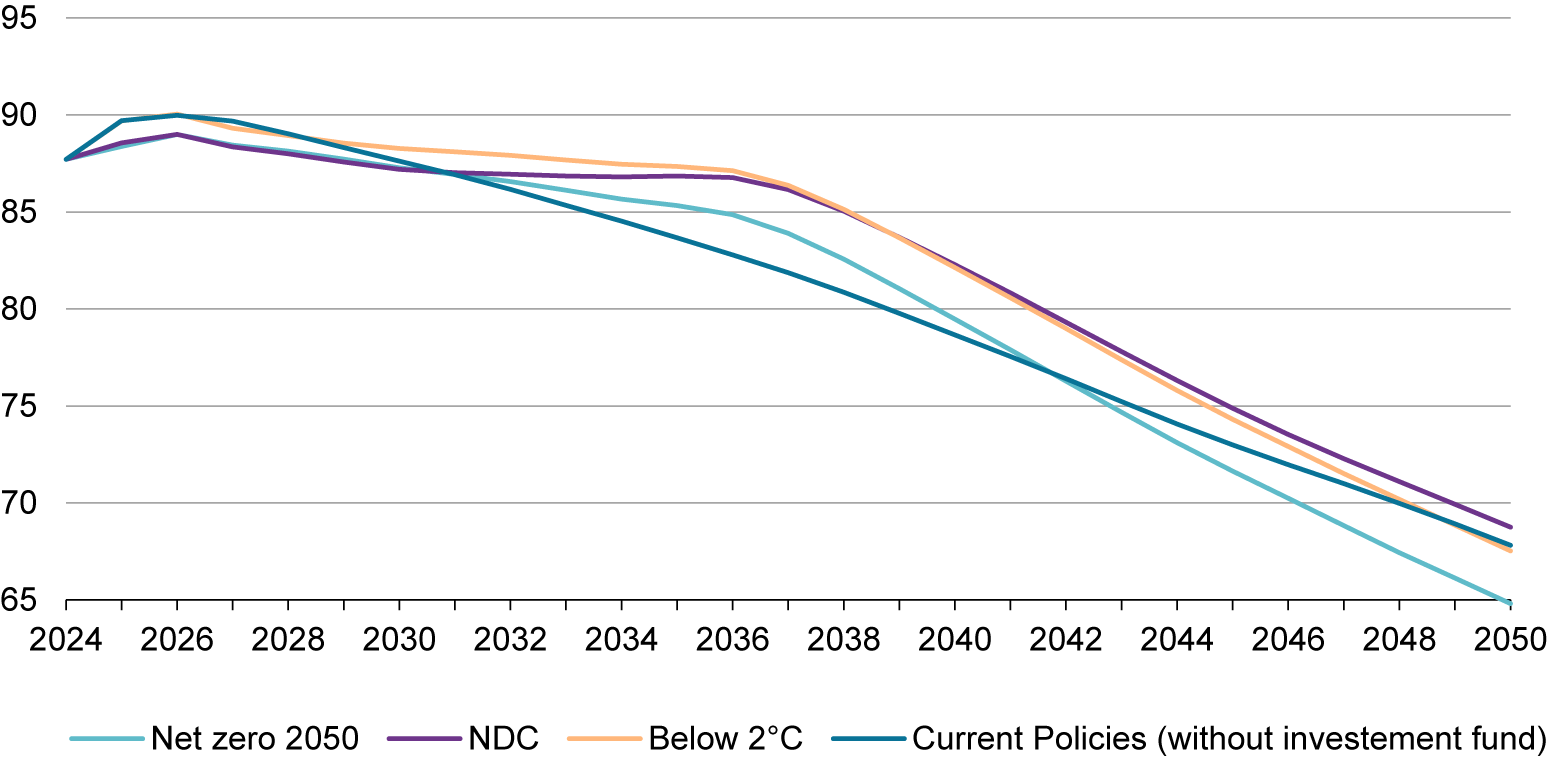
Finally, in terms of public debt sustainability, we observe an elevated government debt ratio in the euro area shortly after the start of the EU public investment programme, vis-à-vis the Current Policies scenario without the investment fund (Figure 8). However, the debt ratio remains continuously falling—albeit at a much slower pace until the mid-2030s. After its end, the simulation results show declining debt ratios in the long term, which fall below 70% in all scenarios by 2050, gradually approaching the reference line of the Current Policies Scenario without the investment fund. In the case of the Net Zero 2050 scenario, the debt ratio even falls below this reference line in 2045. As such, while a debt-financed EU investment fund would necessarily increase the euro area debt-to-GDP ratio in the short-term, long-term debt sustainability would not be endangered according to our simulations.
Average government debt ratio in the euro area with EU investment fund (in % of GDP).
Source: Authors’ simulations using NiGEM and based on NGFS.

Figure 8. Long description
The horizontal X-axis represents years from 2024 to 2050 in two-year increments. The vertical Y-axis represents government debt as a percentage of G D P, ranging from 65 to 95. All four scenarios begin near 88 percent in 2024, peak around 2026, and then follow a downward trajectory.
* Current Policies (without investment fund): Represented by a dark blue line, it shows the steepest initial decline after 2026, reaching approximately 68 percent by 2050.
* Net zero 2050: Represented by a light blue line, it remains higher than current policies until 2042, after which it drops sharply to the lowest final value of approximately 65 percent in 2050.
* Below 2 degrees Celsius: Represented by an orange line, it maintains the highest debt levels for most of the period between 2030 and 2040 before declining to approximately 67.5 percent by 2050.
* N D C: Represented by a purple line, it follows a similar path to the Below 2 degrees Celsius scenario but ends slightly higher, at approximately 69 percent in 2050.
Against this backdrop, it is problematic that current European fiscal rules are based on debt-to-GDP ratio forecasts that do not take economic damages arising from climate change into account. Debt sustainability considerations should therefore—by themselves—not impede investments in the green transformation of the European economy, since inaction would equally lead to higher debt ratios than usually predicted (Sigl-Glöckner et al., Reference Sigl-Glöckner, Steitz and Ziesemer2025).
We should close this subsection by acknowledging the uncertainty around our simulations. Most uncertainty naturally stems from climate risk, which is, however, beyond the scope of this article to analyse.Footnote 13 But to give a concrete example of how sensitive our results are to some of the assumptions, we carried out robustness checks for the case when the ECB was not accommodating the investment programme. Our results—particularly in the long run—remain robust with very small numerical differences only. For instance, the public debt ratio for the euro area will be only 2–3 percentage points higher by 2050 when the ECB is not accommodating the programme.
3.5. Climate adaptation as a global task
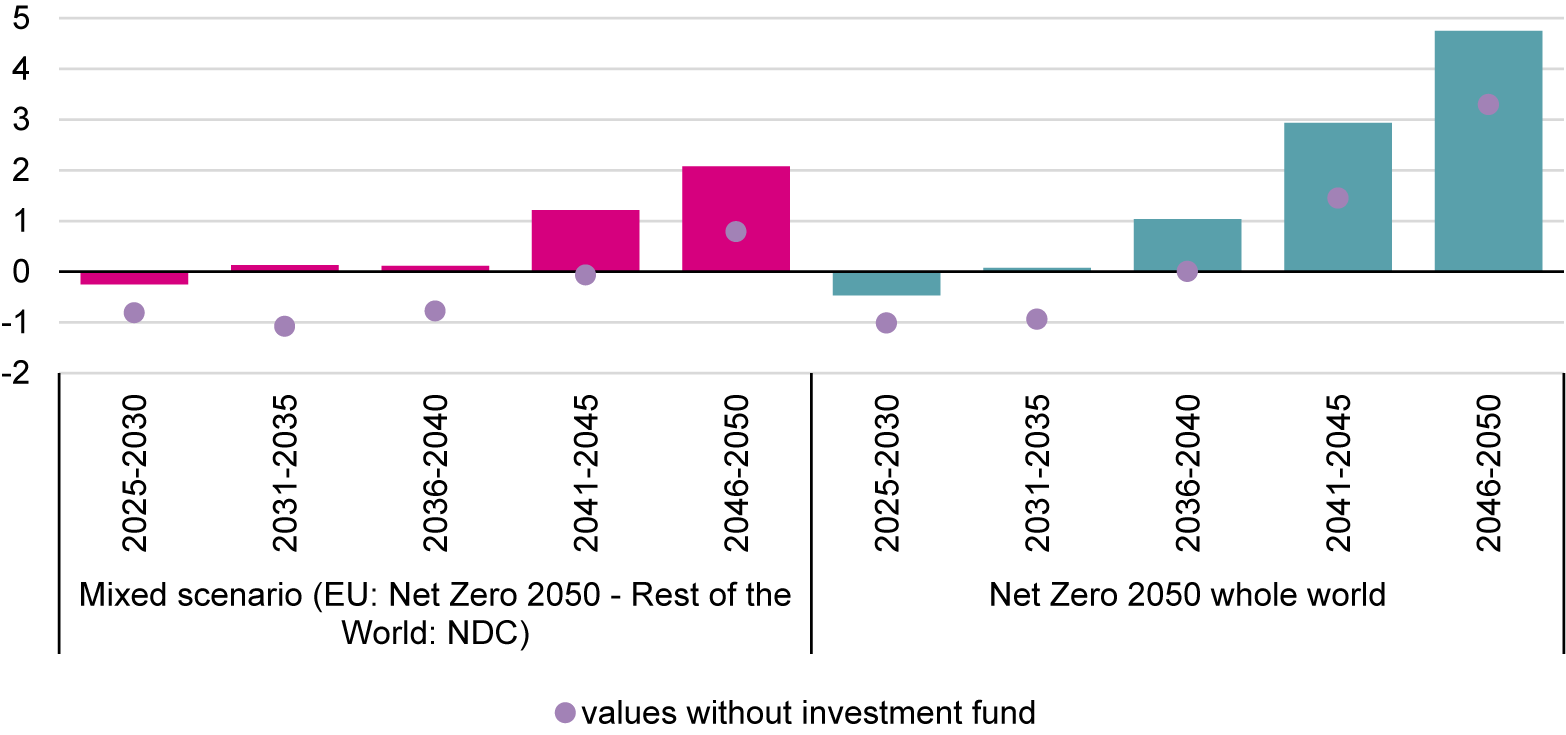
A common question is whether Europe’s efforts alone, with less ambitious climate policies in the rest of the world, would be ineffective. As an illustration, we conduct a simulation of a scenario where the European Union countries were to follow the Net Zero 2050 path, while the rest of the world only implements the emissions reductions already set at the national level according to the Nationally Determined Contributions (NDC) scenario. In this mixed scenario, both the transition costs driven by CO2 taxation to reduce emissions and the chronic physical damages corresponding to the global temperature rise are incorporated into the simulation. We simulate this mixed scenario both with and without the EU investment fund and compare the simulation results to the previously established global Net Zero 2050 case.
Figure 9 shows the results. The comparison between the net zero and mixed scenarios shows that a globally coordinated effort would be a favourable way to keep costs low and long-term benefits high for European economies—with or without an EU investment fund. In the mixed scenario without the EU Investment Fund, there is a significantly worse GDP development for the euro area compared to the case where all countries follow the Net Zero 2050 policies. In comparison to the current policies scenario assumed for the entire world, euro area GDP is projected to be lower until as long as 2040, then only being almost on par for the period 2041–2045. Only at the very end of the simulation horizon will GDP in the euro area be above its level in the Current Policies scenario. If, however, the EU investment fund is being implemented, euro area GDP in the mixed scenario will be as high as in the Current Policies scenario already at the beginning of the 2030s, and higher from the early 2040s onwards.
Euro area GDP deviation from the Current Policies scenario (in %) in the mixed scenario with the EU investment fund.
Source: Authors’ simulations using NiGEM and based on NGFS.

Figure 9. Long description
A bar chart with two panels. The vertical Y axis represents G D P deviation in percent, ranging from minus 2 to 5. The horizontal X axis is divided into two sections, each showing five-year intervals from 2025 to 2050.
Left Panel: Mixed scenario (E U: Net Zero 2050 - Rest of the World: N D C).
* 2025-2030: Magenta bar at approximately minus 0.25, purple dot at minus 0.8.
* 2031-2035: Magenta bar near 0.1, purple dot at minus 1.1.
* 2036-2040: Magenta bar near 0.1, purple dot at minus 0.8.
* 2041-2045: Magenta bar at 1.2, purple dot at 0.
* 2046-2050: Magenta bar at 2.1, purple dot at 0.8.
Right Panel: Net Zero 2050 whole world.
* 2025-2030: Teal bar at minus 0.5, purple dot at minus 1.0.
* 2031-2035: Teal bar near 0.1, purple dot at minus 0.9.
* 2036-2040: Teal bar at 1.0, purple dot at 0.
* 2041-2045: Teal bar at 2.9, purple dot at 1.5.
* 2046-2050: Teal bar at 4.8, purple dot at 3.3.
A legend at the bottom indicates that purple dots represent values without the investment fund.
In contrast, if the Net Zero 2050 policies were followed by the entire world (as assumed and presented in Sections 3.2 and 3.3), euro area GDP would be about 3% higher by mid-century without and about 5% higher with the EU investment fund (compared against the current policies scenario for the entire world). This is due to the fact that in the assumed mixed scenario, the European economy is negatively affected by the higher transition costs of the ambitious Net Zero 2050 taxation pathway, while at the same time it can only reduce its own climate damages to a very limited extent, as these depend by and large on the carbon emissions of the entire world, of which the EU accounts for only a small portion.Footnote 14
This highlights that combating climate change by reducing greenhouse gas emissions to limit global temperature rise is a global task. Only with the involvement of all or at least the largest emitters will the green transformation succeed in reducing global warming such that everyone in the world will be able to benefit from the significantly reduced economic costs otherwise caused by climate change (Wolf, Reference Wolf2024).
Nonetheless, Figure 9 illustrates that these higher transition costs can be significantly reduced through an EU investment fund, highlighting the positive economic growth effects for Europe, even if only Europe were to pursue ambitious climate targets. The EU investment fund should thus present a crucial component of the toolbox for achieving the green transition with a favourable growth path. If the policy focus were instead only on carbon pricing, the temporary costs of decarbonization would be felt in Europe well into the 2040s.
4. Conclusion
This article has examined the macroeconomic effects of a green European public investment fund, utilizing both the standard and climate versions of the NiGEM model. The climate version was used to address the dual challenges of accounting for climate transition costs, as well as long-term physical damages arising from climate change. Our simulations underscore the critical trade-offs between short-term economic adjustments and the far more severe consequences of inaction on climate change.
Key findings reveal that while CO2 taxation does impose transitional GDP losses and inflationary pressures, these costs are, in most cases, dwarfed by the long-term economic benefits of ambitious climate policies. The Net Zero 2050 scenario, despite its higher initial transition costs, ultimately delivers a GDP gain of nearly 3.5% by mid-century compared to a Current Policies trajectory, with even greater benefits (possibly up to 8%) when also accounting for acute physical risks from extreme weather events.
An EU investment fund, modelled with debt-financed additional public investment of 1% of GDP annually from 2027 to 2034, proves instrumental in mitigating these transitional costs. By reducing carbon prices through targeted green investments, the fund not only cushions short-term GDP losses but also enhances Europe’s long-term growth potential, while debt sustainability is largely maintained.
Our analysis also discusses the limits of unilateral action. When the EU pursues Net Zero 2050 independently while other regions of the world adhere to their less ambitious Nationally Determined Contributions, the EU’s GDP gains are diminished, emphasizing the importance of global cooperation to more effectively curb the temperature rise. Importantly, however, our results show that these transition costs can be significantly reduced by the implementation of an EU investment fund.
Finally, these results also carry important implications for EU fiscal policy and its newly reformed rules-based framework. Current debt sustainability analyses, which ignore climate-related damages and transition costs, risk misjudging the fiscal space needed for green investments (Sigl-Glöckner et al., Reference Sigl-Glöckner, Steitz and Ziesemer2025). As the reformed EU fiscal rules take effect, policymakers must recognize that climate inaction is not a fiscally neutral option—it is a path to higher debt and lower growth. The EU’s Recovery and Resilience Facility has demonstrated the viability of debt-financed EU-level investment; our simulations indicate that scaling this model for the green transition is both economically prudent and imperative to avert far costlier futures.