INTRODUCTION
The coastal region off northern Chile is characterized by intermittent wind-driven upwelling throughout the year, with a weak seasonal signal reflected in a slightly greater intensity of upwelling during the austral spring–summer period (Blanco et al., 2001; Pizarro et al., Reference Pizarro, Hormazábal, González and Yáñez1994). The fertilizing effect of upwelling gives rise to a highly productive coastal zone in terms of primary production, yielding >5 mg C m−2 d−1 in average (Neuer & Cowles, Reference Neuer and Cowles1994; Daneri et al., Reference Daneri, Dellarossa, Quiñones, Jacob, Montero and Ulloa2000) and sustaining a strong fishery industry (Bernal, Reference Bernal and Barbieri1990; Blanco et al., 1990).
At northern Chile, upwelling not only pumps nutrients into the photic zone promoting primary production, but also causes the ascent of the well-known oxygen minimum zone (OMZ) (Helly & Levin, Reference Helly and Levin2004) containing cold and low-oxygen water, which may reach the shallow (<30 m) illuminated layer near the coast (Morales et al., Reference Morales, Hormazabal and Blanco1999; Escribano et al., Reference Escribano, Rosales and Blanco2004). Presence of this OMZ system may provide a particular environment within which biological productivity takes places upon drastic changes in redox condition of the water column. The biogeochemical and ecological consequences upon changing redox conditions in the water column are far from being understood in this food-rich upwelling zone (Lipschultz et al., Reference Lipschultz, Wofsy, Ward, Codispoti, Friedrich and Elkins1990; Molina et al., Reference Molina, Farias, Eissler, Cuevas, Morales and Escribano2005).
Upwelling systems, in general, were traditionally viewed as governed by rather short food chains through which most of the phytoplankton C is directly transferred to fish production via herbivorous zooplankton (Ryther, Reference Ryther1969). However, more recent evidence has shown that the microbial food web constitutes a key component to channel freshly produced C to higher trophic levels in coastal upwelling zones (Neuer & Cowles, Reference Neuer and Cowles1994; Vargas et al., Reference Vargas, Cuevas, Gonzalez and Daneri2007). In the coastal zone off northern Chile, similar works are also indicating that microbes may significantly contribute to C fluxes towards higher trophic levels (González et al., Reference González, Daneri, Figueroa, Iriarte, Lefèvre, Pizarro, Quiñones, Sobarzo and Troncoso1998, Reference González, Giesecke, Vargas, Pavez, Iriarte, Santibáñez, Castro, Escribano and Pagès2004; Troncoso et al., Reference Troncoso, Daneri, Cuevas, Jacob and Montero2003; Vargas & González, Reference Vargas and González2003, Reference Vargas and Gonzalez2004; Cuevas & Morales, Reference Cuevas and Morales2006). It has even been suggested that during the El Niño conditions biological productivity may be maintained via a dominant microbial food web in the oceanic zone (González et al., Reference González, Daneri, Figueroa, Iriarte, Lefèvre, Pizarro, Quiñones, Sobarzo and Troncoso1998) when the size spectra of nano- and microphytoplankton communities become dominated by small forms (Iriarte et al., Reference Iriarte, Pizarro, Troncoso and Sobarzo2000) and new production becomes decreased (Escribano et al., Reference Escribano, Rosales and Blanco2004). This El Niño condition contrasts with a cold ‘normal’ upwelling situation during which phytoplankton blooms are dominated by large-sized chain-forming diatoms (Herrera & Escribano, Reference Herrera and Escribano2006). It may thus be that relative contribution of microbes to the C flow in the upwelling zone is depending on upwelling conditions. Changing upwelling conditions may cause variation in the community size-structure of the planktonic system in northern Chile and this can occur over a variety of temporal scales, including intra-seasonal (Montecinos & Quiroz, Reference Montecinos and Quiroz2000), seasonal (Herrera & Escribano, Reference Herrera and Escribano2006) and inter-annual variability (Iriarte et al., Reference Iriarte, Pizarro, Troncoso and Sobarzo2000; Escribano et al., Reference Escribano, Rosales and Blanco2004). All these studies suggest that community changes take place upon variation in the upwelling intensity, reflected in warming or cooling of the water column, changes in depth of the thermocline and oxycline and water column stratification, and changes in nutrients supply, with a consequent implication for primary production rates. How bacteria respond to such changes is still an open question. In upwelling systems, there is a strong coupling between the bacterial and algal production via utilization of the dissolved organic matter (Sorokin, Reference Sorokin1978; Brown et al., Reference Brown, Painting and Cochrane1991; Painting, et al., 1993; Uitto et al., Reference Uitto, Heiskanen, Lignell, Autio and Pajuniemi1997; Troncoso et al., Reference Troncoso, Daneri, Cuevas, Jacob and Montero2003; Cuevas et al., Reference Cuevas, Daneri, Jacob and Montero2004). However, the links between changes in the physical and chemical environment (upon upwelling variation), the subsequent modifications of the autotrophic community structure and the responses of bacteria are not fully understood (Troncoso et al., Reference Troncoso, Daneri, Cuevas, Jacob and Montero2003). Under this view, in the present work we studied the changes in bacterial abundance and their metabolic activity under variable upwelling regimes. Our aim is to understand the underlying mechanisms governing biological production and fluxes of C at lower trophic levels in the coastal upwelling zone as modulated by environmental changes.
MATERIALS AND METHODS
The study area
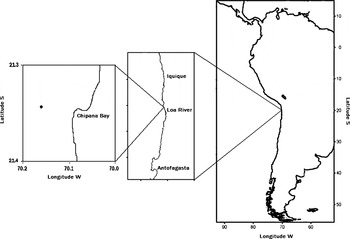
The Bay of Chipana (21°S 70.18°W), located in the northern upwelling region off Chile (Figure 1), is a semi-exposed coastal site subjected to upwelling throughout the year promoting high chlorophyll-a (Chla) levels and a highly diverse phytoplankton community year round (Herrera & Escribano, Reference Herrera and Escribano2006). The whole region off northern Chile is dominated by southerly winds, which become more persistent and intense during the austral summer (Thomas et al., Reference Thomas, Strub, Huang and James1994; Escribano et al., Reference Escribano, Rosales and Blanco2004). Near the Bay of Chipana there is the small Loa River which may discharge small amounts of freshwater and occasionally during strong El Niño events the discharge may increase considerably because of very unusual rain in an extremely dry desert region (Ortlieb et al., Reference Ortlieb, Escribano, Follegati, Zúñiga, Kong, Rodríguez, Valdés, Guzmán and Iratchet2000). For some unknown reasons, the whole coastal area surrounding Chipana, as shown in Figure 1, constitutes a key spawning and nursery zone for small pelagic fish, such as sardines and anchovies (Palma et al., Reference Palma, Escribano and Rosales2006), somehow reflecting the high productivity of the area.
The coastal upwelling zone off Chile, illustrating the area of the Bay of Chipana, northern Chile, and the sampling station for assessing bacterial activity upon upwelling variation.

Within the framework of the CENSOR project (Climate Variability and the El Niño Southern Oscillation: implications for natural resources and management), sponsored by the European Union Commission (www.censor.name), the Bay of Chipana was selected as a target study site for oceanographic monitoring and studies on biogeochemical processes upon upwelling variation, that strongly encouraged us to study the dynamics and role of the bacterial component in this location, since they may have a crucial role in C dynamics in this highly productive system.
Field studies
The studies were carried out at a fixed location off northern Chile. Sampling was made at a station located about 8 km from shore (~95 m depth) (Figure 1). Four seasonal campaigns were performed: winter 2005 (21–26 July); summer 2006 (2–9 February); winter 2006 (1–9 July); and summer 2007 (1–9 February). During each campaign, vertical profiles of oceanographic variables were obtained with a Sea Bird SBE-19 plus CTDOF, equipped with a photosynthetically active radiation sensor. This CTD was daily deployed down to 85 m, during the dates indicated above, and on subsequent days in order to better capture the oceanographic conditions of the sampled season. In addition, a 10 l Niskin bottle was deployed at 5 variable depths, usually 1, 10, 20, 35, 50 and 85 m, to obtain discrete water samples. Dissolved oxygen, nutrients, fractioned Chla and particulate organic carbon (POC) were measured at these depths. Oxygen was chemically analysed by the modified Winkler method (Carpenter, Reference Carpenter1965), while nutrients (NO3−, NO2−, PO43− y Si(OH)4) were analysed following methods described by Strickland & Parsons (Reference Strickland and Parsons1972), after obtaining samples of 50 ml, filtered onto pre-combusted GF/F filters and kept frozen until analysis. For Chla, 250 ml replicated samples were taken for each depth; they were pre-filtered with a 20 µm sieve and then filtered onto GF/F filters. The samples were kept in the filters in liquid nitrogen until analysis. For the analysis, samples were extracted for 24 hours in acetone (90% v/v), and thereafter pigments concentrations were estimated by the fluorometric method (Holm-Hansen et al., Reference Holm-Hansen, Lorenzen, Holmes and Strickland1965), using a Turner Fluorometer. Similarly, POC measurements were obtained from 300 ml samples filtered onto pre-combusted GF/F filters and maintained in liquid nitrogen until analysis using a CHN analyser.
Oceanographic data were complemented with National Oceanic and Atmospheric Administration satellite images of temperature and Moderate Resolution Imaging Spectroradiometer satellite images of surface Chla in order to visualize upwelling conditions over a larger spatial scale.
Bacterial abundance and secondary production
In situ bacterial abundance was estimated from the discrete water samples by taking 1.6 ml of seawater into 2 ml sterilized vials, and fixed with glutaraldehyde (2% final concentration) and maintained in liquid nitrogen. These samples were thereafter analysed at the laboratory by flow cytometry (Becton-Dickinson FACS caliber), using SYBR-Green I for bacterial counts and orange (phycoerythrin) and red fluorescence (chlorophyll) for cyanobacteria counts. Bacterial biomass (BB) was estimated after assuming a cellular concentration of 20 fg C cell−1 (Lee & Fuhrman, Reference Lee and Fuhrman1987).
Bacterial production (BP) was determined at depths of 1, 5, 10, 20 and 30 m in winter 2005, 10 and 20 m in summer 2006, 10, 20 and 45 m in winter 2006, and 5, 10 and 20 m in summer 2007. Variable depths for each period were adjusted to make estimates for the well mixed upper layer, and at least one level at low oxygen condition, which was nearly the base of the oxycline. All samples were made with 3 replicates, and an additional blank sample was previously treated with 37% v/v of formaldehyde:water. The uptake of (14C)-leucine (10 µM final concentration) was terminated with cold 50% TCA (tricloroacetic acid) to a final volume of 10 ml. All incubations at in situ temperature were carried out for 1 hour. Bacterial secondary production was estimated from in situ incubations using (14C)-leucine incorporation rates (Fuhrman & Azam, Reference Fuhrman and Azam1982). Bacterial carbon production (BP) was calculated using the protein/carbon correction factor of 0.86 (Sherr et al., Reference Sherr, Sherr and Pedros-Alio1989) and specific bacterial growth rate (d−1) was estimated from methods previously described (Kirchman, Reference Kirchman, Kemp, Sherr, Sherr and Cole1993) as:

where BB is bacterial biomass and BP is bacterial production, whereas the doubling time (DT) was calculated as DT = ln(2)/μ (1). In addition, the doubling time for the whole bacterial community was calculated after uptake of (14C)-leucine along with cellular counting.
In order to assess bacterial growth efficiency (BGE) and bacterial respiration (BR) we used the following equations (16),

where BGE = bacterial growth efficiency (%), BP = bacterial production (µg C l−1 d−1) and BR = bacterial respiration (µg C l−1 d−1). BR was estimated using the method of Reinthaler & Herndl (Reference Reinthaler and Herndl2005).

where BA = bacterial abundance (cells ml−1) and T = in situ temperature (°C).
Analysis of data
Oceanographic data were used to describe and compare seasonal (winter versus summer) and inter-annual (2-years) environmental changes. For that, mean vertical profiles of each of the variables measured were constructed from surface to near bottom. Also, the profiles of temperature and salinity were used to derive water density and estimate water column stratification:
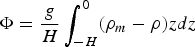
where Φ is an index of potential energy anomaly (J m−3), H is the water column height (m), ρ is the density at any depth z and ρm is the mean density of the water column. This index estimates the deficit in potential energy due to a density gradient (Bowden, Reference Bowden1983). A highly mixed water column will show smaller values of Φ than a highly stratified one. Values of Φ were estimated for the upper 20 m layer, which is the stratum exhibiting most seasonal variation in terms of stratification in this zone (Herrera & Escribano, Reference Herrera and Escribano2006).
A statistical analysis of the data was also performed. All sampling periods were considered as independent measurements, so that a two-way analysis of variance (ANOVA) design was applied for statistical comparisons. The high frequency variability (daily) was fully included in the ANOVA tests.
In order to compare the biological rates measured and oceanographic conditions the same two-way ANOVA design was applied. Data were first log-transformed to meet ANOVA assumptions by gaining statistical independence among treatments and to normalize their distributions (Wilkinson & Engelman, Reference Wilkinson and Engelman2005). The Tukey test was used in some cases for multiple comparisons.
The relationships between bacterial production, their abundance and Chla concentration were examined by linear regressions. Finally, for exploring the association between oceanographic variability and responses in abundance and bacterioplankton productivity a principal component analysis (PCA) was made using the Pearson correlation matrix with 3 standardized factors (Wilkinson & Engelman, Reference Wilkinson and Engelman2005).
RESULTS
Oceanographic conditions
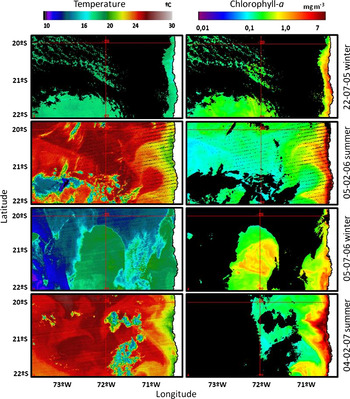
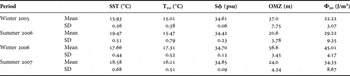
Satellite images of surface Chla and temperature were selected for each sampling period to show the general oceanographic conditions in the coastal region surrounding the Bay of Chipana (Figure 2). There were marked differences between summer and winter conditions that can be seen in surface temperature maps, which show colder waters in the winter, but colder-upwelled waters are also evident in the near-shore band indicating that upwelling is occurring both in summer and winter (Figure 2). Surface Chla on the other hand appears high (>5 mg m−3) in the near-shore band at both seasons, although with a notable decrease in winter 2006 (<2 mg m−3) (Figure 2). From in situ measurements, and despite the sub-tropical location, Chipana showed a rather marked seasonality, reflected in sea surface temperature and in the depth of the OMZ, here defined as depth of the 0.5 ml O2 l−1 isoline (Helly & Levin, Reference Helly and Levin2004) (summary in Table 1). Winter 2006 was clearly warmer compared to winter 2005, and the subsurface warming in winter 2006 is also remarkable, compared with all the other periods. This warming possibly caused and increased stratification in this apparently ‘abnormal’ winter (Table 1).
Satellite images of chlorophyll-a (left side) and sea surface temperature (right side) during monitoring days winter 2005 to summer 2007 (chlorophyll-a data are obtained from Moderate Resolution Imaging Spectroradiometer and temperature data from National Oceanic and Atmospheric Administration satellites and available at www.antares.ws).

Summary of oceanographic parameters during winter 2005 to summer 2006 in the Bay of Chipana, northern Chile. SST, sea surface temperature; T10, temperature at 10 m; Sϕ, surface salinity; OMZ, oxygen minimum zone; Φ20, stratification; SD, standard deviation.

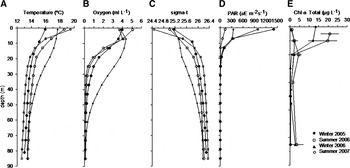
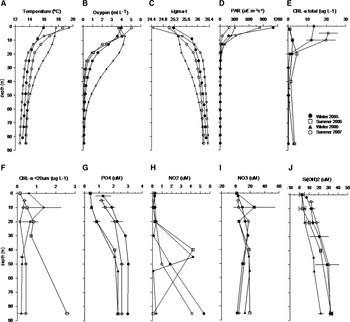
When looking at vertical profiles of oceanographic variables (Figure 3), the seasonal signal can also be observed, characterized by higher surface temperatures (Figure 3A), and a shallower OMZ during the summer (Figure 3B). These differences are mostly expressed in the upper 50 m layer. In this analysis, however, the most remarkable feature is the subsurface warming during winter 2006 (Figure 3B), associated with a subsurface (>10 m depth) oxygenation of the water column in comparison with all the other sampling periods (Figure 3B). Water density profiles (Sigma-T) also varied from season to season, although the trends are unclear (Figure 3C). Light conditions also varied among periods with no clear trends, but the illuminated layer did not reach depths greater than 25 m (Figure 3D).
Oceanographic variables: (A) temperature; (B) oxygen; (C) salinity; (D) photosynthetically active radiation in the Bay of Chipana, northern Chile, during winter 2005 to summer 2007.

Variability in nutrients (Figure 4 G–J) shows a general decrease in the upper layer (<5 m), suggesting a depletion from phytoplankton uptake, and then an increase in values below 20 m depth. Most nutrients showed a strong variation among observations and seasonality was not clear (Figure 4B). The Redfield relationship on the other hand suggests an imbalance, and nitrogen could have thus limited phytoplankton growth.
Vertical profiles of nutrients at the Bay of Chipana (northern Chile) (μM) during four sampling periods (2005–2007): (A) phosphate (PO4); (B) nitrite (NO2); (C) nitrate (NO3); (D) silicates (Si(OH)2).

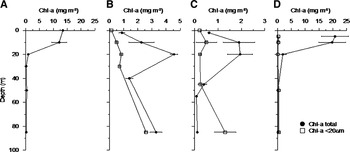
Phytoplankton biomass (as Chla), estimated as total and fractioned (<20 µm) Chla, was highly variable among periods with the lowest value of 31 mg Chla m−2 in winter 2006 and a maximum of 333 mg Chla m−2 in summer 2007 for total Chla (both integrated over the upper 20 m). The <20 µm fraction of Chla contributed mostly in the upper 30 m. However, during the winter of 2006 the contribution from this fraction was nearly 60% at 10 m, and thus being important in the entire water column and yielding significant differences between summers for this size-fraction (P < 0.05). Vertical distribution of Chla showed maximum values within the 20 m layer for all periods (Figure 5).
Chlorophyll-a (mg m−3) profiles (mean and standard deviation) for each study period: (A) winter 2005; (B) summer 2006; (C) winter 2006; (D) summer 2007.

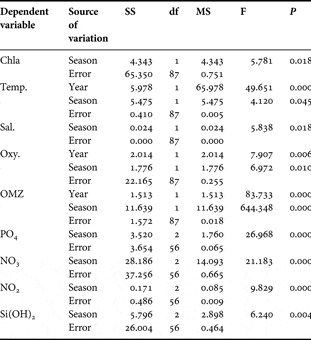
In order to examine for seasonal and inter-annual differences in oceanographic conditions, a two-way ANOVA was applied to each one of the measured variables. The complete vertical profiles were included in the ANOVA. Most variables showed significant seasonal differences, and inter-annual changes were significant only for temperature, oxygen and depth of the OMZ (Table 2). These significant inter-annual differences resulted from the abnormally warm and highly oxygenated winter of 2006 (multiple comparison Tukey test).
Two-way analysis of variance to test for interannual and seasonal differences in oceanographic conditions at the Bay of Chipana, northern Chile during the period July 2005 to February 2007. SS, sum of squares; df, degrees of freedom; MS, mean square; F ratio and P value with significance <0.05.

Chla, chlrophyll-a; Temp., temperatura; Sal., salinity; Oxy., oxygen; OMZ, oxygen mínimum zone.
Bacterial abundance and biomass estimates
From the flow cytometry analysis it became evident that the picoplanktonic community in this upwelling site, as previously reported in other regions (Watson et al., Reference Watson, Novitsky, Quinby and Valois1977; Li et al., Reference Li, Dickie, Irwin and Wood1992), mainly comprised heterotrophic bacteria contributing 96.5% to total picoplankton in average. The lowest concentration of bacteria was found in winter 2005 (~5 × 10⁵ cells ml−1) and summer 2007 to the 20 m depth and the maximum value in summer 2006 (~3 × 10⁶ cells ml−1) to the 20 m depth (Figure 6). Meantime, estimates of bacterial biomass (integrated in the upper 20 m) showed higher concentrations in summer 2006 (~1.2 g C m−2) and winter 2006 (0.9 g Cm−2), resulting from a high bacterial abundance in the upper 10 m. Meantime, much lower biomasses were found in winter 2005 (0.3 g C m−2) and in summer 2007 (0.4 g C m−2).
Bacterial abundance profiles (BA) in cell ml−1 (mean and standard deviation) for each study period: (A) winter 2005; (B) summer 2006; (C) winter 2006; (D) summer 2007.

Bacterial production, growth and metabolism
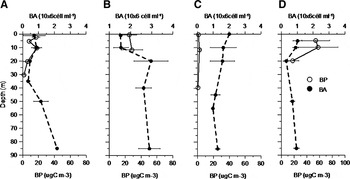
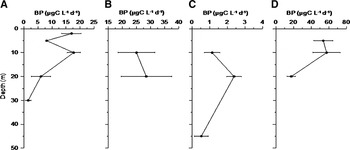
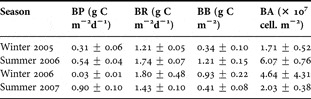
Bacterial secondary production (BP) showed a marked seasonality, with maximum values measured in the summer (38.65 µg C l−1 d−1 to the 20 m depth and 96.6 µg C l−1 d−1 to the 10 m depth, for 2006 and 2007 respectively), and with sharp decreases in the winter with 21.82 µg C l−1 d−1 to the 10 m depth in winter 2005 and a very low value of 2.84 µg C l−1 d−1 to the 10 m depth in winter 2006 (Figure 7). Integrated values for the upper 20 m are shown in Table 3 illustrating one order of magnitude of lower BP during winter 2006 and the significantly higher BP during summer 2007, from 0.03 up to 0.9 mg C m−2 d−1 in winter 2006 and summer 2007, respectively (Table 3).
Bacterial production (BP) profiles in μgC L−1 d−1 (mean and standard deviation) for each study period: (A) winter 2005; (B) summer 2006; (C) winter 2006; (D) summer 2007.

Mean and standard deviation of bacterial production (BP), respiration (BR), biomass (BB) and abundance (BA) from July 2005 to February 2007 in the Bay of Chipana, northern Chile. Values were integrated over the upper 20 m layer.

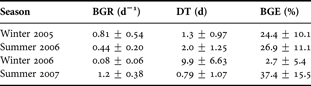
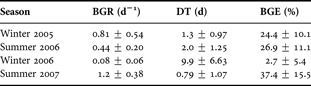
Bacterial growth rates (BGR) estimates were higher during summer 2007 (Table 4), associated with decreased doubling times (DT) (0.79 d), and consequently a higher bacterial growth efficiency (BGE) estimated as 37.4% in average. For winter 2006, BGR was lower (0.09 d−1) and DT close to 9.96 d (Table 4), with highest abundances observed in the upper 10 m. However, the estimates of ~2.7% of BGE clearly show a diminished bacterial secondary production during winter 2006. In winter 2005 and summer 2006 BGR average estimates were about 0.81 d−1 and 0.44 d−1, respectively, with DT of 1.36 d for winter 2005 and 2.07 d for summer 2006, and with BGE of 24.4% and 26.9%, respectively (Table 4).
Mean and standard deviation of bacterial growth rate (BGR), doubling time (DT) and bacterial growth efficiency (BGE) in the Bay of Chipana, northern Chile from July 2005 to February 2007.
Bacterial respiration rates (BR) yielded high amounts of C being utilized for respiration in the range of 1.2 to 1.8 g Cm−2 d−1 in the upper 20 m (Table 3). Higher values were observed during summer and winter 2006 (1.7 and 1.8 g C m−2d−1, respectively), whereas summer 2007 yielded 1.4 g C m−2 d−1 and in winter 2005 a value of 1.2 g C m−2 d−1 was found.
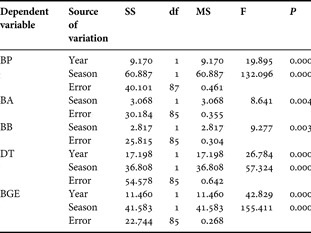
Seasonal and inter-annual differences in bacterial abundance and productivity were examined by a two-way ANOVA (Table 5). Bacterial abundance showed significant seasonal differences, but non-significant inter-annual variation (P > 0.05). On the other hand, there were strong significant seasonal and inter-annual variations in bacterial production and bacterial activity estimates (BGE, BB and BR) (Table 5). The Tukey test for multiple comparisons indicated that such differences in most cases resulted from the strongly diminished activity of bacteria in winter 2006, and the significant increase in summer 2007.
Two-way analysis of variance for testing interannual and seasonal differences in bacterial production (BP), bacterial abundance (BA), bacterial biomass (BB), doubling time (DT) and bacterial growth efficiency (BGE), in the Bay of Chipana, northern Chile during the period July 2005 to February 2007. SS, sum of square; df, degrees of freedom; MS, mean square; F ratio and P value with significance <0.05.

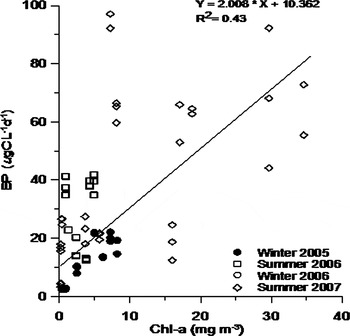
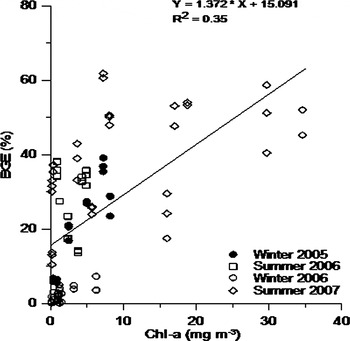
When looking at the environmental influence on bacterial abundance and production, it became clear that there was a positive correlation with phytoplankton biomass (r2 = 0.43, P < 0.05, N = 91) (Figure 8) and a lack of correlation with temperature (r2 = 0.00, N = 91). The strong dependence between bacterial activity and Chla concentration can also be seen in the variation of BGE as a function of Chla concentration (r2 = 0.35, P < 0.05, N = 89) (Figure 9).
Chlorophyll-a (Chl-a) and bacterial production (BP) relationship (R2 = 0.43; P < 0.05). Data collected in the Bay of Chipana, northern Chile, during July 2005 to February 2007.

Bacterial growth efficiency and chlorophyll-a relationship, in the Bay of Chipana, northern Chile, during winter 2005 to summer 2007.

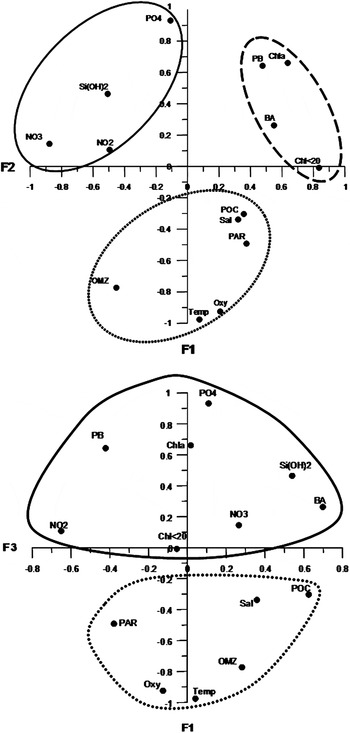
In order to explore integrated effects of the oceanographic condition on bacterial abundance and production, a multivariate PCA was applied considering 3 factors (Figure 10). This analysis accounted for 76% of total variance and allowed the grouping of environmental variables and bacterial responses. The analysis resulted in strong associations among some of the physical, chemical and biological variables (temperature, salinity, light, oxygen and the OMZ). The first two components of the PCA again showed the strong dependence of bacterial abundance and production in relation to Chla (both total and <20 µm), whereas the first and third components revealed the association of bacteria with distribution of the macronutrients (Figure 10).
Principal component analysis on the biological and oceanographic variables during winter 2005 to summer 2007. Three factors were derived accounting for 76% of total variance. Factor 1 versus Factor 2 plot (upper panel), allows a consistent grouping of nutrients (solid line), biological variables (dotted minor line) and ocenographic variables (dotted mayor line). Factor 1 versus Factor 3 plot (lower panel) shows biological–chemical association (solid line) and oceanographic group, coinciding with groups defined by a K-means analysis.

DISCUSSION
In upwelling systems the strong coupling between the bacterial and algal production through the dissolved organic matter (DOM) has been clearly evidenced (Sorokin, Reference Sorokin1978; Brown et al., Reference Brown, Painting and Cochrane1991; Painting et al., Reference Painting, Lucas, Peterson, Brown, Hutchings, Mitchell and Innes1993; Uitto et al., Reference Uitto, Heiskanen, Lignell, Autio and Pajuniemi1997; Cuevas et al., Reference Cuevas, Daneri, Jacob and Montero2004). More recent studies have proposed that the bacterial food web might be the main pathway of C in a coastal upwelling system. This is because about 60% of the primary production has been estimated as being rapidly consumed by heterotrophic bacteria (Troncoso et al., Reference Troncoso, Daneri, Cuevas, Jacob and Montero2003). In fact the analysis of the Redfield relationship showed nitrogen deficit, suggesting that N could have limited the phytoplankton growth, as described in other studies, although in different systems (Barber & Smith, Reference Barber, Smith and Longhurst1981; Pilson, Reference Pilson1985).
Our estimates of bacterial abundance also suggested their importance in terms of C biomass and abundance. In this context, it is relevant to note the increase in bacterial abundance below the oxycline (Figure 6) indicating that a rich, but little studied bacterial community inhabits the OMZ systems. A recent work also reported a substantial increase of heterotrophic bacteria within the OMZ in the northern upwelling region off Chile (Cuevas & Morales, Reference Cuevas and Morales2006). However, it should be stressed that most remarkable bacterial activity takes place in the phytoplankton-rich photic layer. The bacterial community in this layer is highly diverse and composed of several important and well characterized groups (Stevens & Ulloa, Reference Stevens and Ulloa2008). In this region the microbial community is predominantly dominated by SAR86, Loktanella and unclassified Flavobacteriaceae. A second dominant group on the surface is the g-proteobacterial SAR86 clade, which is exclusively found here, followed by the a-proteobacterial Roseobacter clade (Stevens & Ulloa, Reference Stevens and Ulloa2008).
The surface community of bacteria makes direct use of the highly available DOM linked to phytoplankton blooms and this causes the strong correlation with Chla concentration. Indeed, our estimated concentration of bacterioplankton biomass is less than 3-% of the total phytoplankton C during periods of high Chla, whereas during periods of low Chla, the values of C may amount to 30% of the total phytoplankton biomass.
Conditions in the upwelling zone during this study were characterized by surface warming and strong thermal stratification, high phytoplankton biomass (>5 mg Chla m−3) and a shallow (<30 m depth) OMZ, coinciding in most cases with those conditions reported in previous studies for the northern upwelling region off Chile (Blanco et al., Reference Blanco, Thomas, Carr and Strub2001; Cuevas & Morales, Reference Cuevas and Morales2006; Herrera & Escribano, Reference Herrera and Escribano2006). However, the upwelling zone of Chipana during winter 2006 exhibited an anomalous warming, a weaker and deeper oxycline, and a much lower phytoplankton biomass, as compared to other studies in northern Chile. Therefore, we concluded that winter 2006 may have been subjected to a weak El Niño event. This possibility is supported by international reports at that time (Climate Prediction Center, National Oceanic and Atmospheric Administration, USA), which diagnosed positive anomalies of temperature (> +0.5°C) on the South American coast (El Niño zones 1 + 2) during July 2006 suggesting that the abrupt warming observed in Chipana was a regional event, and not a simple local phenomenon.
Previous El Niño events in the upwelling zone off Chile have been characterized by strong subsurface warming and sharp deepening of the oxycline and nutricline, precluding the fertilizing effect of upwelling and causing decreased levels of primary production and Chla concentration (Barber & Chavéz, Reference Barber and Chavéz1983; Thomas et al., Reference Thomas, Strub, Huang and James1994; Uitto et al., Reference Uitto, Heiskanen, Lignell, Autio and Pajuniemi1997; Escribano et al., Reference Escribano, Rosales and Blanco2004). All these oceanographic manifestations were observed in winter 2006 as compared to the other sampling periods.
The response of bacteria to abnormally warm El Niño conditions was observed during winter 1997 off Antofagasta (23°S) and a drastic decrease in BP was reported (González et al., Reference González, Daneri, Figueroa, Iriarte, Lefèvre, Pizarro, Quiñones, Sobarzo and Troncoso1998). As shown above, we observed a similar response of bacteria in winter of 2006. In this regard, it is interesting to note that despite the nearly one order of magnitude lower BP in winter of 2006 compared to winter of 2005, the bacterial abundance and biomass were not significantly different from those observed during all the other three sampling periods, consistent with the hypothesis that bacterial abundance and biomass does not present a higher variability compared with bacterial production estimation for the global ocean (Fuhrman & Azam, Reference Fuhrman and Azam1982; McManus & Peterson, Reference McManus and Peterson1988; Billen et al., Reference Billen, Servais and Becquevort1990; Ducklow & Carlson, Reference Ducklow and Carlson1992; Fuhrman, Reference Fuhrman1999; Ducklow, Reference Ducklow and Kirchman2000; Gasol et al., Reference Gasol, Pedrós-Alió and Vaqué2002). High bacterial biomass, low secondary production and a higher bacterial respiration certainly resulted in very low bacterial growth and growth efficiency. In this study, bacterial growth efficiency ranged from 2.7 to 37.4%. This is in agreement with a review on the subject (del Giorgio et al., Reference del Giorgio, Cole and Cimbleris1997; del Giorgio & Cole, Reference del Giorgio, Cole and Kirchman2000), which concludes that BGE values in natural marine ecosystems are mostly below 40% and more frequently between 5 and 30% and also that BGE tends to increase with BP.
The underlying causes of decreased activity, but high biomass, of bacteria during the El Niño conditions are not easily inferred from the available information. A possible cause may be related to a diminished upwelling, less nutrients concentration and hence low standing stock of phytoplankton. The greatly depleted substrate (DOM from phytoplankton) for bacterial growth may be considered as a probable explanation, because of the strong dependence between Chla and BP. During El Niño 1992, more than 90% of the total chlorophyll was associated with the >14 µm fraction in the Equatorial Pacific (Billen et al., Reference Billen, Servais and Becquevort1990). On the other hand, a previous work in northern Chile (Iriarte et al., Reference Iriarte, Pizarro, Troncoso and Sobarzo2000) found no significant differences in primary production and Chla between El Niño 1997–1998 conditions and non-El Niño conditions during 1998, suggesting that impacts on the bulk community level were not detectable, although at species composition and size- structure levels, significant changes were clearly noticed (Iriarte et al., Reference Iriarte, Pizarro, Troncoso and Sobarzo2000). However, this possibility does not explain the high abundances or biomass of bacteria, which should depend on BP. Abnormally high temperatures could also be considered as a factor affecting directly the metabolism and activity of bacteria. In general, it has been observed that the rate of bacterial metabolism increased with increments of temperature within a certain range (Cole et al., Reference Cole, Findlay and Pace1988). Temperature may alone explain up to 54% of the BGE (Cole et al., Reference Cole, Findlay and Pace1988). In our study we found no correlation between bacterial abundance and production with temperature and it is unlikely that warmer waters observed during winter 2006 would have been the main factor causing a reduced metabolism. In addition, a previous work (Kirchman et al., Reference Kirchman, Quinby, Shiah and Ducklow1994) suggested that temperature could not provide a general explanation for low BP/PP ratios in the Equatorial Pacific during an El Niño event, when the supply of DOM seems to explain the changes in bacterial production.
A possibility that may deserve further study is the potential effect of changing redox conditions upon oxygenation of the water column, because of deepening of the OMZ during El Niño conditions, such as those observed in winter 2006. There is considerable controversy on the role of oxygen over microbial process in the water column. Degradation of organic matter due to bacterial activity in low-oxygen waters is generally assumed to be slower than the degradation process in aerobic waters, mainly because organic matter is more abundant in continental margin deposits underlying anoxic deposits and the energy needed in the anaerobic process is slower compared to oxygen reduction of the organic matter. A previous study in lakes (Cole & Pace, Reference Cole and Pace1995) suggests that BP in cold low-oxygen (anoxic) waters is usually higher than in warm oxic waters. In fact, the increase of bacterial biomass below the oxycline suggests that oxygen-deficient (reduced conditions) water may favour bacterial growth. Otherwise, recent work (Pantoja et al., Reference Pantoja, Rossel, Castro, Cuevas, Daneri and Córdova2009) shows no differences in bacterial abundance and production in coastal and oceanic waters in the north of Chile and also no differences between the peptide hydrolysis and amino acids incorporation in oxic and suboxic waters. Results from those experiments indicate that substrate lability is an important factor determining the coupling between autotrophic and heterotrophic bacterial activity. In this context, substrate lability is very closely related to autotrophic activity as DOM release from phytoplankton, for example from cell lysis, exudates, egestion, excretion and sloppy feeding by grazers (Nagata, Reference Nagata and Kirchman2000). Different dissolved organic substrates can be produced if copepods or protozoa are ingesting large-sized chain-forming diatoms, or small (<50 µm) phytoplankton cells (Nagata, Reference Nagata and Kirchman2000; Vargas & González, 2004; Møller, Reference Møller2005), then the effect of El Niño conditions (causing decreased metabolism) on the phytoplankton community structure can possibly regulate the C fluxes during such warm events. Nevertheless, the relative importance of DOM supply, temperature and oxygen conditions in controlling bacterial production is still not clear, especially when inter-annual disturbances are present (e.g. an El Niño event). These issues may be important in the context of the impact of climate change and physical processes in regulating C fluxes in highly productive upwelling systems.
ACKNOWLEDGEMENTS
This work has been financed by Work Package 2 of the CENSOR Project (Contract INCO 511071) funded by the European Union Commission. We are grateful for support provided by UNAP (Universidad Arturo Prat) during the field work. Data analysis has also been supported by Research Program 3 of the COPAS Center funded by FONDAP–CONICYT of Chile.