Introduction
Over the past two decades, third language acquisition (L3A) has emerged as an area of systematic research independent from the field of second language acquisition (SLA) (e.g. Cenoz, Reference Cenoz2003, Reference Cenoz2013), as scholars acknowledge that the interaction of three different languages entails complex factors and effects that are not observable in L2 acquisition. One chief distinction between these two areas of inquiry, that is, L2 vs. L3 acquisition, lies in the source of potential transfer; while the L1 serves as the only source of potential transfer in the case of L2 acquisition, there are two pre-existing linguistic systems that can influence L3 acquisition. Thus, it has been of great interest in the field of L3A to examine the interplay among the L1, the L2 and the L3, and to identify the key determinant of the source of transfer (e.g. Bardel & Falk, Reference Bardel and Falk2007; Falk & Bardel, Reference Falk and Bardel2011; Ringbom, Reference Ringbom2007; Rothman, Reference Rothman2010, Reference Rothman2011; Williams & Hammarberg, Reference Williams and Hammarberg1998).
Although a great number of important contributions have been made to expand the field of L3A (see especially Cenoz, Reference Cenoz2003; De Angelis, Reference De Angelis2007), much work has centered on the lexicon (e.g. Ringbom, Reference Ringbom2007; Williams & Hammarberg, Reference Williams and Hammarberg1998). In fact, the issue of cross-linguistic influence (CLI) at the morphosyntactic level has only recently begun to receive attention, mostly from the generative linguists. Some studies have demonstrated that the L2 is the exclusive source of transfer (e.g. Bardel & Falk, Reference Bardel and Falk2007; Falk & Bardel, Reference Falk and Bardel2011), while others support transfer from either or both languages (e.g. Flynn, Foley & Vinnitskaya, Reference Flynn, Foley and Vinnitskaya2004; Rothman, Reference Rothman2010, Reference Rothman2011; Rothman & Cabrelli Amaro, Reference Rothman and Cabrelli Amaro2010).
While it is indisputable that transfer plays a role at least in the initial stages with different studies pointing to different CLI predictions, the jury is still out on how the interplay between the two previously learned languages affects L3 acquisition, which warrants further research. Considering that so far research has only been carried out from the generative perspective, it is also vital that the issue be examined from other theoretical perspectives such as cognitive or psycholinguistic approaches. The prevailing use of psycholinguistic approaches to CLI in SLA (see Jarvis & Pavlenko, Reference Jarvis and Pavlenko2008) and bilingualism (see Treffers-Daller & Sakel, Reference Treffers-Daller and Sakel2012) research further validates psycholinguistic approaches as an appropriate alternative framework to investigate CLI issues in the L3 context.
The current study adds to the growing body of L3A research by examining transfer in L3 acquisition within the Competition Model, a functional approach to bilingual language development proposed by Bates and MacWhinney in the 1980s (Bates & MacWhinney, Reference Bates, MacWhinney and MacWhinney1987, Reference Bates, MacWhinney, MacWhinney and Bates1989) and greatly expanded empirically (Kail & Charvillat, Reference Kail and Charvillat1988; Li, Bates & MacWhinney, Reference Li, Bates and MacWhinney1993; McDonald, Reference McDonald1986, Reference McDonald1987; Morett & MacWhinney, Reference Morett and MacWhinney2012; Yoshimura & MacWhinney, Reference Yoshimura and MacWhinney2010a, Reference Yoshimura and MacWhinneyb) and theoretically (e.g. MacWhinney, Reference MacWhinney, Gass and Mackey2012 for the most recent) since then. The present research sought to investigate the effects of exposure on changes over time in role assignment in L3 Latin by L1 English speakers with two L2 backgrounds of different linguistic typology: Japanese and Spanish.
Recent accounts of morphosyntactic transfer in L3 acquisition
As mentioned earlier, empirical contributions to CLI at the morphosyntactic level in L3 come exclusively from the Universal Grammar (UG) paradigm (García Mayo, Reference García Mayo2012). The efforts of generative researchers to examine the initial state of L3 can be interpreted as an act of refining their understanding of UG and its accessibility. Partial and full access hypotheses in SLA posit different predictions about the initial state of L3. The partial access approaches (e.g. Hawkins & Hattori, Reference Hawkins and Hattori2006) claim that post-critical period L3 learners would only be able to transfer syntactic features and functional categories from their L1 and not their L2. The opposite view is held by full access approaches (e.g. Epstein, Flynn & Martohardjono, Reference Epstein, Flynn, Martohardjono, Flynn, Martohardjono and O’Neil1996; Schwartz, Reference Schwartz1998), which contend that L2 learners are capable of learning new features and so transfer from both the L1 and the L2 is theoretically plausible (see García Mayo, Reference García Mayo2012 for a review of L3 research from the generative perspective). Identifying the source of transfer in L3, therefore, would help disentangle evidence for different positions on the involvement of UG beyond L1 acquisition. Currently, there are three major hypotheses that have been postulated based on previous empirical findings. They will be reviewed in some depth here (see García Mayo & Rothman, Reference García Mayo, Rothman and Amaro2012, for further details).
The Cumulative Enhancement Model (CEM) was first introduced in Flynn et al. (Reference Flynn, Foley and Vinnitskaya2004), to examine the acquisition of restrictive relative clauses by L1 Kazakh/L2 Russian child and adult speakers learning English as an L3. They predicted that if the L1 were to play a privileged role in L3 acquisition, the participants’ Complementizer Phrase (CP) patterns would resemble those of L1 Japanese speakers learning L2 English since both Kazakh and Japanese are head-final languages. However, if their L2 Russian, which has a similar CP structure to L3 English, is the dominant source language, their CP development would mirror that of L1 Russian speakers learning L2 English. The results confirmed the second hypothesis, suggesting that experience with any prior language is potentially subject for transfer. More importantly, Flynn et al. (Reference Flynn, Foley and Vinnitskaya2004) also emphasized that transfer from the background languages only facilitates L3 learning, and that features that may hinder or delay the target structure of the L3 will not be transferred.
Another hypothesis that models morphosyntactic transfer in L3 acquisition is the L2 Status Factor Hypothesis (LSFH) put forth by Bardel and Falk (Reference Bardel and Falk2007). Embracing Williams and Hammarberg's (Reference Williams and Hammarberg1998) claim about the dominant role of L2 influence in L3 vocabulary acquisition, the LSFH argues that the dominant role of L2 as the source of transfer is equally evident at the L3 morphosyntactic level. That is, in the initial state of L3, the L2 may function as a filter, blocking L1 transfer even in cases where transfer from the L1 is more economical. Falk and Bardel (Reference Falk and Bardel2011) suggest that the preference for L2 transfer in L3 acquisition may be attributed to the cognitive and sociolinguistic similarities in learning L2 and L3 in terms of age of onset, context of learning (natural vs. classroom), and the degree of metalinguistic knowledge involved in learning (p. 63). As a result of these inherent similarities, learners may suppress the activation of L1 and exclusively transfer from the L2 in the initial stages of L3 acquisition.
While the LSFH contends for complete L2 transfer, the Typological Primacy Model (TPM) introduced by Rothman (Reference Rothman2010, Reference Rothman2011) argues that transfer in the L3 initial state can come from any previously acquired language. The TPM reintroduces Kellerman's (Reference Kellerman, Gass and Selinker1983) early explanation for transfer of psychotypology as the key factor that constrains the process of L3 acquisition. The model hypothesizes that either actual typological distance or perceived typological similarity between the three languages will decide whether or not transfer takes place from the L1 or the L2 (but see Rothman, published online November 13, Reference Rothman2013, for an updated version of the model).
Despite considerable efforts, disagreement still remains over the effects of previously learned languages on L3 morphosyntactic development. Since the field of L3A is still in its infancy, more empirical work is needed to clarify the role of background languages in L3 acquisition.
Applying the Competition Model to multilingualism
As a nascent field of study, and in order for the field to mature as a viable scientific discipline, it is important that L3 development be examined from multiple perspectives. In SLA and bilingualism, the role of CLI has been extensively tested and examined by emergentist, functionalist, and psycholinguistic approaches in the past years, including the associative-cognitive CREED (Construction-based, Rational, Exemplar-drive, Emergent, and Dialecting) theory (Ellis, Reference Ellis, VanPatten and Williams2006a, Reference Ellisb, Reference Ellisc, Reference Ellis, Robinson and Ellis2008; Ellis & Sagarra, Reference Ellis and Sagarra2010, Reference Ellis and Sagarra2011), VanPatten's input processing model (VanPatten, Reference VanPatten1996), and the CM (MacWhinney, Reference MacWhinney, Gass and Mackey2012; MacWhinney & Bates, Reference MacWhinney and Bates1989; MacWhinney, Bates & Kliegl, Reference MacWhinney, Bates and Kliegl1984), which motivates the present study.
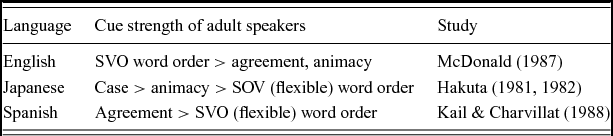
Taking a functionalist approach to language processing and acquisition, the CM characterizes language processing as the process of activating the links between forms and functions in a network (Bates & MacWhinney, Reference Bates, MacWhinney, MacWhinney and Bates1989). To make a successful form–meaning connection, the processor makes use of a variety of surface structure features known as cues (e.g. word order, case-marking particles, inflectional morphology, etc.). Cues vary across availability (i.e. frequency) and reliability (i.e. consistency of information), and both availability and reliability contribute to cue strength. Successful sentence interpretation depends on the correct hierarchy of cue weights. The main methodology used in CM studies is an agent-identification task in which the participant is presented with transitive sentences consisting of two nouns and one verb (e.g. “The queen kissed the king”). The main task of the participant is to decide which noun phrase refers to the agent in the sentence. Model sentences are manipulated to represent various competing and converging combinations of cues, including word order, subject–verb agreement, noun-case marking, and animacy. A wide range of experimental work in the CM framework (e.g. Hakuta, Reference Hakuta1981, Reference Hakuta1982; Kail & Charvillat, Reference Kail and Charvillat1988; Li, Bates & MacWhinney, Reference Li, Bates and MacWhinney1993 McDonald, Reference McDonald1986, Reference McDonald1987) has attested that the relative order of cue strength is language specific, suggesting that native speakers of different languages display different cue hierarchies in sentence processing. Table 1 is a summary of the relative order of cue strength across the languages investigated in the CM paradigm.
The order of cue strength across languages.

Note: The table shows relative strength of cues that are only relevant to the current study. To see the order of cue strength of all the cues available in each language, please see Year (Reference Year2003).
As shown in Table 1, the dominant cue used for agent identification varies across language groups. For instance, English speakers predominantly rely on a basic subject–verb–object (SVO) order to convey thematic roles (McDonald, Reference McDonald1987), while Japanese conveys thematic roles mainly through noun–case marking (Hakuta, Reference Hakuta1981, Reference Hakuta1982). Therefore, when the sentence in a NVN order is given, English speakers will principally consider the first noun to be an agent. As for Japanese speakers, however, since Japanese allows variations of word order (e.g. SOV, OSV), relying on one specific word order would not lead to the correct agency assignment all the time. What is a more reliable cue for them is noun case morphology, which is always present in transitive sentences.
As a theory of cross-linguistic sentence processing, the CM posits that “whatever can transfer will” (MacWhinney, Reference MacWhinney, Kroll and de Groot2005, p. 55) in L2 learning. With a great emphasis on the interactive nature of cognitive processing, the CM predicts that there would be a large amount of transfer unless the interactions between languages are controlled and coordinated. Previous CM studies (Harrington, Reference Harrington1987; Liu, Bates & Li, Reference Liu, Bates and Li1992; McDonald, Reference McDonald1987; Morett & MacWhinney, Reference Morett and MacWhinney2012) have documented that L2 cue hierarchy is close to that of L1 in the initial stages of L2 acquisition and that the relative order of cue strength changes in the direction of the target-like settings for L2 as L2 knowledge, use, and exposure (i.e. resonance) increases. Although L2 learners come with firmly entrenched L1 patterns when learning the L2, L1 entrenchment is expected to weaken once learners establish new L2 form–function connections and create repeated memory consolidations of new forms. In this respect, learning an L2 is viewed as an incremental process during which the learner's cue hierarchy undergoes a reconfiguration to become more L2-like.
Based on their empirical investigations, CM research proposes that sentence processing can be manifested in various transfer patterns contingent upon the amount of exposure the learner gets to both languages. One of the patterns is forward transfer, which refers to the use of L1 strategies in processing. This type of transfer occurs predominantly among late L2 learners or bilinguals with little L2 experience (e.g. Kilborn, Reference Kilborn1989), but it does not imply that an inverse relationship is always expected between language experience (i.e. exposure or proficiency) and forward transfer. An L1 processing “accent” has been found even among highly advanced learners in some studies (Bates & MacWhinney, Reference Bates, MacWhinney and Winitz1981; Kilborn, Reference Kilborn1989; Tokowicz & MacWhinney, Reference Tokowicz and MacWhinney2005) suggesting that L1 remnants may not completely disappear in some cases. For example, initial transfer of English preverbal positioning of the agent has been found when English speakers learn Spanish since the preverbal positioning cue (also known as the SVO cue) displays the highest validity in English (see VanPatten, Reference VanPatten and Sanz2005, for references). While forward transfer may appear in the form of positive transfer when processing Spanish sentences in SVO word order, it may be manifested as negative transfer when interpreting Spanish sentences in non-canonical word order.
Contrary to forward transfer is backward transfer, a mechanism that uses L2 strategies when processing L1. This pattern can be characterized as partial influence of L2 on L1 among advanced or balanced bilinguals (Hernandez, Bates & Avila, Reference Hernandez, Bates and Avila1994; Liu et al, Reference Liu, Bates and Li1992), or as L1 attrition (Schmid, Reference Schmid2013) among L2 speakers who have lived in an L2 environment for a long period (e.g. immigrants). Another transfer pattern is called differentiation, in which learners do not demonstrate any transfer of cue from one language to another. McDonald (Reference McDonald1987) demonstrated that differentiation occurs incrementally and that the phenomenon is more prevalent among L2 learners or bilinguals who are highly advanced in both languages. Lastly, Hernandez et al. (Reference Hernandez, Bates and Avila1994) introduced what they referred to as amalgamation, in which learners apply a single set of strategies that have merged the two cue settings to both languages. This type of in-between processing, together with forward transfer, is most common among early bilinguals.
Although these four patterns of transfer have been mostly used to discuss CLI in the L2 context, MacWhinney (Reference MacWhinney, Gass and Mackey2012) claims that the Unified Competition Model has been designed to account for multilingualism as well. Therefore, in an effort to complement previous L3 studies from the generative perspective, the current study relied on the CM framework to examine L3 sentence processing. Specifically, the present study sought to investigate the effects of L1 and L2 morphosyntactic transfer in L3 Latin prior to – ab initio – and after exposure to L3 input. Participants were 25 English speakers with different L2 backgrounds (i.e. Japanese and Spanish), learning L3 Latin agency assignment through input-based instruction. By examining participants’ L3 accuracy as well as processing strategies at three different times, this study aimed to offer the first developmental account of how L1 and L2 transfer affects L3 acquisition associated with thematic role assignment. Despite the choice of theoretical construct, the study differs from traditional CM research in two important ways. First, and for obvious reasons, to propose the cue hierarchy in Table 2 below we had to rely on Latin grammars (Hale & Buck, Reference Hale and Buck1903) rather than native speakers’ performance. We also relied on Kempe and MacWhinney's (Reference Kempe and MacWhinney1998) study of Russian and German, which, like ours, looked at the contribution of three different cues to sentence interpretation by probing assignment of semantic functions via a computerized picture-choice task. Their results suggest that learners of Russian use case marking early compared to learners of German, who rely more on animacy due to the weaker case-marking cue. In contrast with German, Russian, like Latin, almost always provides case inflections that are reliable cues to sentence interpretation. Another key difference between our procedures and research conducted within the CM paradigm is that we take a developmental approach that looks at cue hierarchy prior to, and observes changes resulting from, exposure to the L3. Consequently, the practice and tests include only grammatical instances in treatment and testing, thus limiting the number of possible cue combinations.
The order of cue strength in Latin.

The two research questions guiding the current study were as follows:
-
(i) Do learners with different L2 backgrounds exhibit similar processing strategies at their first contact with L3 Latin?
-
(ii) Does exposure to the L3 differentially affect L3 processing strategies in learners with different L2 backgrounds?
This is the first study to rely on the CM to understand CLI in L3 development, so we are going to make predictions within that framework. Cognizant of the lack of previous literature and based on general CM tenets, on the nature of the languages involved and the L1 dominance typical of classroom L2 learners, we expect that, in the absence of exposure, development will start with the L1 for both groups, the most dominant language. We expect performance at Time 1 to be comparable across groups, in that both groups will prefer word order cues to case and agreement cues. Across time, at Time 2 and Time 3, learners in both groups are expected to rearrange their processing strategies to approach those of the L3 in much the same way as in previous Latin Project studies (e.g. Stafford, Bowden & Sanz, Reference Stafford, Bowden and Sanz2012). However, the two L2 groups are also expected to follow different paths to success based on previous research. First, Morett and MacWhinney (Reference Morett and MacWhinney2012) report that L1 English learners of L2 Spanish change their cue weights to adjust them to the Spanish cue hierarchy with a preference for agreement and clitic morphology over word order, suggesting that learners do restructure their cue hierarchy in the direction of L2 when learning a new language. Second, the general CM tenet that “everything that can transfer will” predicts that learners will make use of all the transfer resources available to them, therefore supporting their use of L2 processing strategies when learning an L3. Based on these findings and arguments, it is expected that for each group, L3 exposure will trigger reliance on the strongest L2 cue – agreement for L2 Spanish and case for L2 Japanese – to assign agency in the L3. Therefore, we expect overall behavior (total % correct) for both groups to be comparable, but to elicit significant differences in the finer-grained analysis per type of structure.
Method
Participants
Participants in the present study were 25 undergraduate students (aged 18–21 years) from a mid-size private university in the United States. They were native speakers of English with different L2 backgrounds: ten Japanese learners and 15 Spanish learners. All participants were intermediate or advanced students based on their course level at the time of testing and had no prior knowledge of any case languages. More experienced learners of the L2 were chosen over novice L2 learners to ensure that participants had been exposed to L2 input responsible for triggering changes in processing hierarchies. All participants were compensated for their participation with extra credit in their L2 courses. Although best efforts were made to recruit the largest group of the most experienced L2 learners of Japanese, it was not an easy task to get a large sample considering recent trends in registration in language programs in the US, and matching them in level with the English/Spanish sample made recruitment even more challenging. However, a look at N values in CLI studies cited earlier in our report shows that our sample size falls well within those CLI studies referred to above: Bardel and Falk (Reference Bardel and Falk2007) has the smallest N value, with four and five participants in each group, and Rothman (Reference Rothman2011) is one of the largest with 60 participants divided among four groups.
Target form
The linguistic target for the current study was thematic role assignment to nouns in Latin transitive sentences. Latin, a natural language no longer spoken, was chosen for the current study to control for prior knowledge and exposure to input while maintaining the study's ecological validity. Its structure allows for the examination of three morphosyntactic cues related to thematic role assignment: SVO word order, subject–verb agreement, and noun case morphology.Footnote 1 In Latin, noun case morphology is always present and reliable while subject–verb agreement and SVO word order cues are not. The availability of the subject–verb agreement cue depends on number agreement between the two nouns in a sentence (e.g. the cue is only available when number disagrees between the two nouns), and SVO word order is even less reliable due to Latin's flexible word order (see Table 2 for the order of cue strength for Latin). Thus, learners must rely on the strongest cue in Latin, i.e. case morphology, to correctly assign thematic roles.
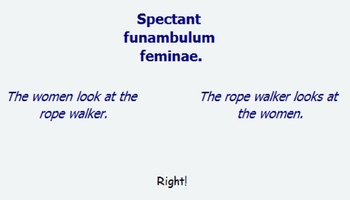
Adapting the methods implemented in CM studies, the current design used an agency assignment task that requires learners to select an agent in transitive sentences with two animate nouns. Like previous studies within the Latin Project paradigm (Lado, Bowden, Stafford & Sanz, published online November 21, Reference Lado, Bowden, Stafford and Sanz2013; Lenet, Sanz, Lado, Howard & Howard, Reference Lenet, Sanz, Lado, Howard, Howard, Sanz and Leow2011; Sanz, Lin, Lado, Bowden & Stafford, Reference Sanz, Lin, Lado, Bowden and Stafford2009; Stafford et al., Reference Stafford, Bowden and Sanz2012), there were three types of stimuli sentencesFootnote 2 for both practice and critical items that differed on the availability of the three cues: (i) SVO sentences with word order and case cues always available, and agreement available in half of the cases (henceforth SVO items); (ii) non-SVO sentences with verb agreement and case morphology cues available (henceforth AGR items); (iii) non-SVO sentences with only case morphology cues available (where both nouns are either singular or plural, henceforth CASE items).
-
(1)

-
(2)
-
(3)


Sentences (1)–(3) above reflect the cue hierarchy for Latin. In (1) all three cues are available, whereas in (2) and (3) learners must rely on subject–verb agreement and case marking, or solely on case marking, respectively. Following Stafford et al. (Reference Stafford, Bowden and Sanz2012), processing strategy was operationalized according to participants’ accuracy on the three item types. For example, if learners were accurate on SVO items, in that they chose the picture that correctly represented agent and object, they were classified as using predominantly an SVO processing strategy. On the other hand, if learners were accurate on CASE items, then they were categorized as relying on case marking.
Procedure
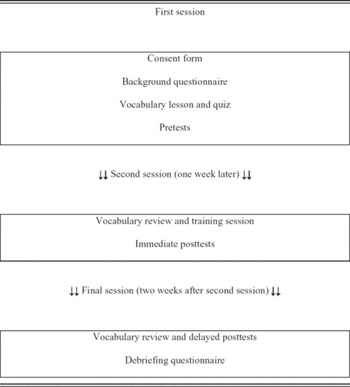
The experiment was conducted in three sessions over a four-week period in the Apple language lab where participants interacted with sections of The Latin Project, an application that combines ColdFusion and Flash programming to deliver audiovisual treatments and capture participants’ responses. During the first session, participants signed a consent form and completed a language background questionnaire, the Latin vocabulary lesson and quiz, vocabulary reviews, and the written and aural interpretation pretests. The second session was held approximately a week after the first session, during which participants completed vocabulary reviews, training session, and immediate posttests. After two weeks, participants came back to participate in the final session which consisted of vocabulary reviews, delayed posttests, and a debriefing questionnaire. The design is summarized in Table 3.
Experimental design.

Treatment
Vocabulary lesson and quiz
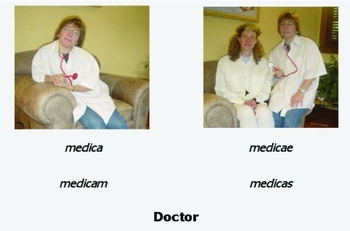
Before the pretest, participants completed a computer-administered vocabulary lesson, which provided them with the 46 Latin words (35 nouns and 11 verbs) of the mini-grammar. An example is presented in Figure 1. For nouns, participants were presented with two images (one for singular and the other for plural) with their corresponding written and aural singular and plural nominative and accusative case marking forms for a total of four forms. No effort was made to contrast them or to indicate their function. For verbs, two images – one for plural and one for singular – depicting the motion were presented, together with their written and aural representations.
Vocabulary lesson item.

All forms were presented in screens that advanced automatically (4 s). A multiple-choice vocabulary quiz followed which required participants to score 100% on the quiz in order to advance to the training session. If they did not meet the criterion score, the computer program cycled back through the lesson until their score reached criterion. Following the same design but limited only to the words in the test, participants also completed multiple-choice vocabulary reviews prior to each of the Latin tests so that any errors made during practice or testing resulted from difficulties with the target structure.
Training session
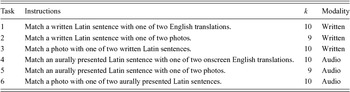
The training session in the experiment provided participants with practice processing 116 exemplars of Latin strings containing two noun plus verb sentences with morphological cues as well as variations of word order. The practice session consisted of six interpretation tasks. To support different learning styles, the tasks were given in two different modalities, written and aural (see Table 4). They were also designed to make the processing of the thematic roles of the two nouns involved as task-essential as possible (Loschky & Bley-Vroman, Reference Loschky, Bley-Vroman, Crookes and Gass1993). For each answer, and before moving to the following item automatically, participants received yes/no feedback without metalinguistic information, as in Figure 2.
Six-task design of the training session.

Note: Participants completed the six tasks twice, for a total of 116 processed items (58 × 2).
Practice item with feedback.

Latin tests
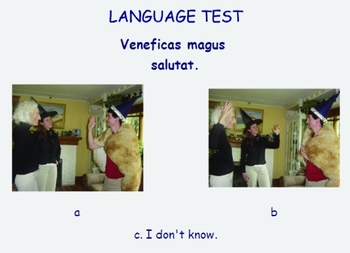
The Latin test battery consisted of written (WI) and aural interpretation (AI) tests. Each test contained 20 items: 12 critical items with two animate nouns and one transitive verb, and eight distractors with one animate noun and a verb. Participants were asked to choose between the two pictures that correctly depicted the sentence that they either saw onscreen (on the WI tests) or heard through headphones (on the AI tests) or “I don't know”. Figure 3 provides an example of a WI test item.
Written interpretation test item.

Three versions of the test battery were created that were equivalent in format and content and differed only in the order of presentation of the AI and WI tests, which were counter-balanced. All stimuli sentences for each version appeared in randomized order across type and test times, and participants were randomly assigned to take the different versions.
Scoring
Each critical item in the two input-based tests (i.e. WI and AI) was awarded one point (correct answer) or zero points (incorrect answer or “don't know” answer) for a possible maximum score of 12 points in each of the two interpretation tests. For the purpose of the statistical analyses, and to provide a global picture of changes in processing strategies, scores from the two tests were combined, making the maximum score 24 points. To measure participants’ accuracy by sentence type, the number of items correctly answered for each sentence type (e.g. SVO items, AGR items, and CASE items) was tallied and converted to a percentage score to facilitate between-group comparisons.
Results
The current study investigated changes in processing strategies for thematic role assignment in L3 Latin among L1 English speakers of two typologically different L2s. The first research question focused specifically on participants’ performance prior to exposure to the target structure (i.e. pretest), while the second research question examined the patterns of transfer on L3 development over time.
The role of CLI upon the initial contact with L3 Latin
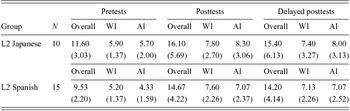
Pretest scores were analyzed in two different respects to investigate the first research question. First, overall accuracy was compared across groups. Table 5 displays the descriptive statistics for participants’ overall accuracy in three different time periods.Footnote 3
Descriptive statistics for participants’ overall accuracy. Raw scores are given with SD in parentheses. The maximum score for WI and AI is 12 and 24 for overall scores.

Note: AI stands for Aural Interpretation; WI stands for Written Interpretation
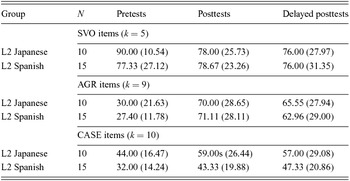
An independent-samples t-test was conducted to examine if the two L2 groups differed on the pretest. Results demonstrated that there was no statistically significant group difference between the groups, t(23) = 1.98, p > .05, d = .83. Next, pretest accuracy was analyzed by sentence type, which indexes participants’ degree of reliance on each processing cue. The accurate responses on each sentence type were expressed as proportions due to the uneven number of items for each sentence type. The descriptive statistics for participants’ accuracy by sentence type in the pretest is summarized in Table 6.
Descriptive statistics for participants’ accuracy by sentence type.

Note: Scores are expressed as proportions due to uneven numbers of items for each sentence type. Numbers in parentheses are Standard Deviation values.
An examination of the data revealed that all participants, irrespective of their L2 language backgrounds, performed best on SVO items. A 3 × 2 repeated measures ANOVA on scores from the pretest with Sentence Type (SVO items, AGR items, CASE items) as the within-group factor and Group (L2 Japanese, L2 Spanish) as the between-group factor failed to evidence a significant Sentence Type × Group interaction, confirming that groups patterned similarly on the three item types. A main effect was observed for Sentence Type (F(2,46) = 67.63, p < .001, partial η2 = .75) and contrast results demonstrated that the differences lay between SVO and AGR items (F(1,23) = 99.22, p < .001, partial η2 = .81) and between SVO and CASE items (F(1,23) = 75.67, p < .001, partial η2 = .77) as participants were more accurate on SVO items; the significant contrast AGR and CASE items (F(1,23) = 4.61, p < .05, partial η2 = .17) shows superior performance on AGR than CASE items.
The role of CLI in L3 development over time
In order to examine whether different L2 experiences modulated L3 development over time, a two-level hierarchical linear model (HLM) was used, with individuals at the first unconditional level and groups at the second conditional level. Contrary to traditional types of analyses of group differences (e.g. analysis of variance), HLM (also known as growth curve analysis) allows for an estimation of individual growth trajectories as well as assessments of predictors of individual growth. To maximize the statistical power in detecting differences in a small sample, HLM was chosen as an appropriate analytical tool over repeated-measures ANOVA for the current study. Two sets of HLM analyses were conducted using the Statistical Package for the Social Sciences (version 20), one using overall accuracy as the dependent variable and another using accuracy by sentence type.
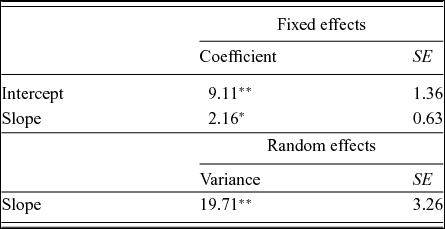
First, participants’ overall scores were used to perform a HLM analysis. Prior to testing the group effects on individual growth in L3 proficiency, a preliminary analysis was performed with the unconditional random-coefficient regression model for growth. An unconditional model was estimated with Time as the only predictor to confirm that there is significant variation among individuals across time, which is a necessary justification for any further analysis. The Level-1 model provides the average intercept and the average slope parameters across individuals. The intercept parameter represents initial status while the slope parameter represents the rate of growth. Table 7 presents the results of this analysis.
Results of Hierarchical Linear Modeling Analysis with overall accuracy – Unconditional Model.

* p < .05; ** p < .01
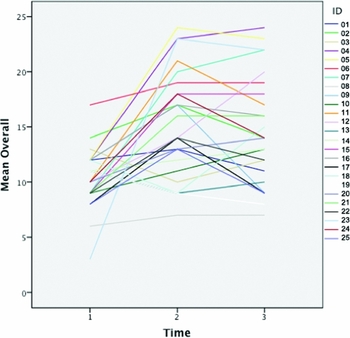
Table 7 first presents the fixed effects results for the unconditional model. The estimated mean intercept was 9.11, while the estimated mean growth rate (i.e. slope) was 2.16. Findings indicated that the HLM estimate of the average accuracy score at Time 1 (i.e. pretest) was 9.11 and that the estimated mean increase in accuracy was 2.16 for each time unit. The next section of Table 7 reports the variance components for the random effects. These parameters provide information about the deviations of individual improvement from the mean growth rate. The estimate of the variances for the growth rate parameter was 19.71. The variance estimate for the slope parameter (19.71) was significant at α = .01, indicating that the growth rates are significantly different among the individuals across time. The variation in individual growth trajectories across time is visually displayed in Figure 4.
Individual growth curve trajectories for overall accuracy.

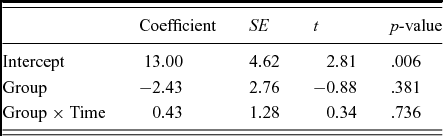
Once the unconditional model established a baseline for overall accuracy across time, a conditional model was formulated to examine inter-individual factors (e.g. L2 language) that may contribute to individual variation (i.e. the intercept and slope parameters estimated at Level-1). The results for fixed effects are displayed in Table 8.
Results of Hierarchical Linear Modeling Analysis with overall accuracy – Conditional Model.

Note: The alpha level is set at .05.
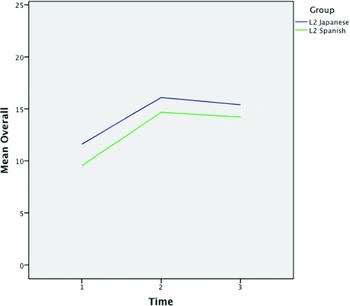
The coefficients in the conditional model, together with those in the unconditional model provide information that can be garnered from a repeated-measures ANOVA. That is, it allows one to observe changes in learners’ performance over time as well as differences between individuals in their intercept. Results of the conditional model indicated that there is no significant Time × Group interaction (p > .05), suggesting that the L2 Japanese and L2 Spanish groups do not significantly differ in their rate of growth across three time periods. A visual display of overall accuracy development of the Japanese and Spanish groups is shown in Figure 5.
Mean growth curve trajectories for L3 overall accuracy by group.

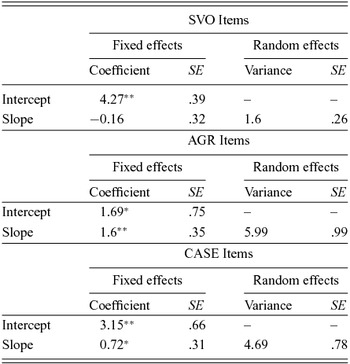
To examine whether the two groups displayed different growth curve trajectories with respect to the processing strategies, a separate HLM analysis was conducted for each sentence type (i.e. SVO, AGR, and CASE items). As it was with overall accuracy, a Level-1 unconditional model was first formulated for each sentence type (a) to confirm that there is significant variation among individuals across time, and (b) to establish the baseline for any subsequent analyses. The coefficients in the unconditional model indicated that significant variation within individuals was only observed with AGR and CASE items, demonstrating that participants’ accuracy for SVO items did not change significantly over time. Table 9 displays the unstandardized coefficients for the growth curve parameters and variances associated with the intercepts and slopes on all three sentence types.
Results of Hierarchical Linear Modeling Analysis by Sentence Type – Unconditional Model.

* p < .05; ** p < .01
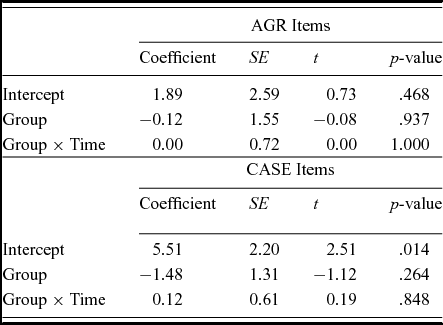
Based on the preliminary results, no further analysis was carried out with SVO items (p > .5). As the effect for time in the unconditional growth models was significant with AGR and CASE items, Level-2 condition models were formulated with these items only. Table 10 summarizes the results of the conditional model.
Results of Hierarchical Linear Modeling Analysis by Sentence Type – Conditional Model.

Note: The alpha level is set at .05.
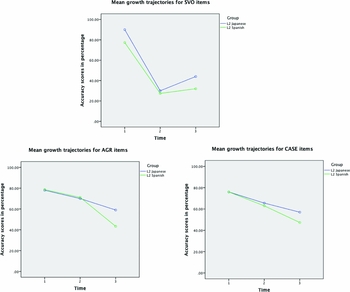
In line with the HLM results of overall accuracy, the coefficients in the Level-2 model of AGR and CASE items also revealed that there is no significant interaction between Time and Group (p > .05). This suggests that the growth trajectories of AGR and CASE items for the Japanese and Spanish groups were similar. The growth curve trajectories of each sentence type are visually represented in Figure 6.
Mean growth curve trajectories for each sentence type.

To sum up, the use of each processing strategy by both Japanese and Spanish groups was found to be identical across time. That is, irrespective of their L2 language backgrounds, participants performed best on SVO items in the pretest. After exposure to the input, they maintained their high use of the SVO processing strategy while increasing their use of the AGR and CASE processing strategies.
Discussion
The CM is the theoretical framework chosen so as to include a functional perspective in CLI research that complements previous UG-based studies and in this way offer a fuller developmental account of how transfer operates at the morphosyntactic level. Specifically, the current study sought to investigate the effects of L1 and L2 morphosyntactic transfer in L3 Latin prior to – ab initio – and after exposure to L3 input. The study was particularly interested in (a) identifying the dominant processing strategy that L3 learners utilize in the early stages of L3 learning, and (b) examining potential changes in their reliance on different processing cues. Changes in processing strategies (or cues) were operationalized as changes in accuracy in interpretation of sentences that required reliance on three different cues (i.e. SVO word order, subject–verb agreement, and nominal case assignment). All participants had L1 English, a language that relies on word order as the preferred cue, and L3 Latin, a language that gives preference to case markings, while exhibiting different L2 experience (i.e. either Japanese or Spanish, languages that rely on case and agreement cues respectively). Such design allowed us to gain insights into the potentially changing role of L1 and L2 transfer in L3 morphosyntactic processing as learners move along the L3 developmental continuum. Two research questions were formulated to address the issue of transfer within the CM framework.
The first research question probed whether learners of typologically different L2s exhibited similar L3 processing patterns upon first contact with Latin. Findings revealed that participants’ overall accuracy as well as processing strategies were comparable across groups. The lack of variation observed in L3 performance suggests that participants’ different L2 experiences did not exert a significant influence on their L3 performance, but that their L1 did. The evidence thus seems to argue for the greater influence of L1 English, which was kept constant across groups. Such a dominant role of the L1 in the initial state of L3 can be effectively supported by the CM which views sentence processing in terms of the strengthening or weakening of connections between function and form. According to the CM, the default cue settings at the initial stage of L2 learning resemble those of the L1 (MacWhinney, Reference MacWhinney and Robinson2001, Reference MacWhinney, Robinson and Ellis2008). This is expected given that the balance between the languages is heavily in favor of L1 in the beginning of learning a new language. However, as L2 learners gain more knowledge of, and exposure to, the new language system, they begin to assign strength to new form–function connections that are appropriate for the L2. The increased strength of the L2 form–function connections then eventually weakens the entrenched L1 processing habits, allowing restructuring of cue weight settings in the direction of the L2. Although the CM does not make any explicit predictions about L3 sentence processing, it is possible to apply the arguments of CM to the L3 context. The notions of entrenchment and resonance espoused by the CM allow us to speculate that the default cue weight settings at the initial point of L3 learning is largely dependent upon learners’ competence and dominance in their two languages. That is, if learners are predominantly more competent in their L1, thus exhibiting strong L1 entrenchment, it is likely that their cue weight settings for L3 learning resemble those of their L1. However, if learners’ proficiency and dominance in the two languages are somewhat comparable, results might not be as obvious. Learners could utilize L2 cue hierarchy as the default or they might develop a new set of cue hierarchy as a result of amalgamation of the two cue settings. Considering that the current participants were not balanced bilinguals with near equal competence and dominance in their two languages, it is not too surprising that the strength of processing cues associated with agency assignment was largely governed by their L1 cue hierarchy when learning the L3. Participants’ heavy reliance on L1 processing cues suggests that an L1 processing “accent” often observed in the L2 context can be also detected in the L3 context at least during early exposure to the L3.
The second research question sought to observe whether, after identical exposure to the L3, learners of typologically different L2s exhibited similar developmental trajectories in the L3 over the course of four weeks. The motivation for investigating development stemmed from a need for longitudinal designs in research on CLI, which has been discussed more recently in light of the importance of the interaction between time and transfer (De Bot, Reference De Bot and Amaro2012; García Mayo, Reference García Mayo2012). Findings indicated that input-based instruction was effective in that both groups showed significant gains in their ability to correctly assign agent and object functions during interpretation tasks. The lack of interactions indicated that the similarity observed across groups at pretest was maintained over the course of four weeks, suggesting that the two groups behaved more like a homogeneous group. Specifically, albeit the degree of reliance on word order slightly decreased after the treatment with both groups, the relative preference for this cue over verb agreement and case morphology carried on over time. The persistent use of the SVO word order is not unexpected for two reasons. First, there were instances of SVO structures in the input as all items were grammatical and SVO is possible in Latin. Second and more important, there was no reciprocal causal relationship that forced change in one processing cue to lead to change in the other. In other words, participants did not have to reduce their reliance on the SVO word order to develop reliance on other processing cues. It was a matter of realignment of cue weights, not of substitution of one cue by another.
Albeit not the focus of our study, given the importance of the generative strand in understanding CLI, we devote this paragraph to those interested in interpreting our results as evidence in favor of hypotheses emerging from generative approaches to CLI. The finding that participants’ use of more reliable cues in Latin did not surpass their reliance on the most valid L1 cue (i.e. SVO word order), disadvantages both the typology effect and the L2 status factor. When L1 and L2 cue activations were in competition, the current findings suggest that the L1 cue won out despite the closer relationship between the L2s and L3 Latin (i.e. Spanish is etymologically closer to Latin than English, whereas Japanese is structurally more similar to Latin than English) and the cognitive and sociolinguistic similarities in learning L2 and L3 (Falk & Bardel, Reference Falk and Bardel2011). The observed dominant role of L1 in all three testing periods does not support previous L3 studies from the generative perspective that have introduced either (psycho)typology (e.g. Rothman, Reference Rothman2010, Reference Rothman2011) or the L2 status factor (e.g. Bardel & Falk, Reference Bardel and Falk2007; Falk & Bardel, Reference Falk and Bardel2011) as the deterministic factor for transfer in L3. Both the TPM and the LSFH would have contended that transfer would be primarily modulated by the L2 of each language group basing their arguments on different assumptions, with TPM's arguments centered on the typological effect and LSFH's arguments based on the cognitive similarities in learning L2 and L3. However, the lack of group differences between the two L2 groups in the current study reveals that the findings do not correspond to any of these two postulations set forth by previous research. One possible account for such incompatible results might be related to differences in participants’ language backgrounds. While the current study was devoted to examine L3A at the initial state of L3 learning with a group of participants whose L1 was more dominant than L2, the participant language profile in previous studies was not identical to the current study. Considering that participants’ L2 and L3 proficiency levels varied in previous studies that have provided evidence for either the TPM or the LSFH, caution is appropriate when interpreting the current results. Although it is clear that the dominant role of L1 observed in the present study does not lend evidence to the basic premises of these two existing hypotheses, our findings do not necessarily disprove their arguments. It is important to acknowledge that studies of L3A, including the current study, examined different pools of participants, thus providing snapshots of different periods of L3 acquisition. Therefore, more research is warranted in order to investigate whether the L1 effect (observed in the present study), the typology effect (claimed by the TPM), and the L2 status factor (claimed by the LSFH) are incompatible with one another. It is possible that all of them play significant roles in L3 acquisition, but in different stages or periods of the learning process.
The present study is the first to take as point of departure a functional approach popular in SLA – the CM – to explain L3 development. Usage-based approaches, including functional approaches, consider language processing as an interactive process of form–meaning mappings; in this view, language acquisition is defined as developing language-specific links between forms and functions. While the initial neural state of infants learning L1 is characterized as a tabula rasa, the default state of L2 learning does not exactly exhibit much plasticity. It is rather viewed as tabula repleta because the L2 learner's neural system has been tuned in to his/her L1 and is thus optimized for L1-specific processing (Ellis, Reference Ellis2006b, Reference Ellis, Robinson and Ellis2008; MacWhinney, Reference MacWhinney, Gass and Mackey2012). From this point of view, the default cue settings at the starting point of L2 learning resemble those of the L1 and they get eventually restructured in the direction of L2-like patterns (MacWhinney, Reference MacWhinney and Robinson2001, Reference MacWhinney, Robinson and Ellis2008). A great number of CM studies (Bates & MacWhinney, Reference Bates, MacWhinney and Winitz1981; Hernandez et al., Reference Hernandez, Bates and Avila1994; Kilborn, Reference Kilborn1989; Kilborn & Ito, Reference Kilborn, Ito, MacWhinney and Bates1989; McDonald, Reference McDonald1987; Morett & MacWhinney, Reference Morett and MacWhinney2012) as well as L2 morpheme acquisition studies (Hakuta & Cacino, Reference Hakuta and Cancino1977; Luk & Shirai, Reference Luk and Shirai2009; Master, Reference Master1997; Pak, Reference Pak1987) have attested that L2 learners initially rely on L1 pathways for L2 processing, which culminates in interferences from L1 to L2 in the early stages of language acquisition. The negative effects of L1 entrenchment may then be gradually reduced in accordance with L2 exposure and, as a result, cue settings that once committed to an L1 configuration will be adjusted to become more L2-like (McDonald, Reference McDonald1987; Morett & MacWhinney, Reference Morett and MacWhinney2012). In summary, this functional framework suggests that L1 entrenchment may be counteracted by language use and exposure.
In the absence of exposure to the L3, the superseding role of L1 observed in the current study is not a surprising discovery, as the dominant language for learners in this study was L1 English. Learners resorted to the cue with the highest L1 validity (i.e. SVO word order), which, according to functional approaches to CLI, can be translated as the most entrenched processing strategy in their linguistic system. With two different (and therefore competing) cue configurations at their disposal, our learners opted for more firmly ingrained processing settings in their neural system notwithstanding that positive transfer might have been more economical with the use of the strongest L2. However, as learners were exposed to the L3, they did not rely on the L2 cue that warrants successful form–meaning connections in L3 Latin. Three to five semesters of classroom learning without immersion experience were not enough for integrated patterns of L1 and L2 cues to emerge (Hernandez et al., Reference Hernandez, Bates and Avila1994) that would reflect a dynamic interaction between L1 and L2 processing strategies leading to a realignment of processing strategies that approximates that of the L3.
Conclusions and limitations
The study is an attempt to advance the agenda in CLI by introducing a new framework – the CM – and a number of key decisions that make it unique. Following García Mayo's (Reference García Mayo2012) call, we identified novel language pairings – Latin, Japanese, and Spanish – crucial to answer a specific theoretical question, in this case the role of the L1 and the L2 in the realignment of strategies in L3 processing. To control for exposure while preserving validity we chose Latin, a language that prefers noun case morphology to verbal morphology and word order as cues to encode semantic functions in nouns in a sentence. We selected native speakers of English, a language that relies on word order, who were classroom learners of two second languages: Spanish, that has Latin as its ancestor, and Japanese which, like Latin, prefers case morphology. We chose L2 classroom learners and a longitudinal approach that starts with the initial state of L3 development in the absence of prior exposure and ends with retention of effects of exposure to input-based instruction.
General and fine-grained analysis looking at the three cues involved in agency assignment in Latin suggests that in the absence of exposure to the L3, participants’ L3 cue hierarchy is closer to that of the L1, with SVO as the preferred strategy. Later, as learners are exposed to L3 input, reliance on agreement and case emerges in both L2 groups, albeit without compelling evidence for interlanguage transfer contributing to L3 acquisition, which would have resulted in multiple sources of transfer – differentiated reliance on agreement and case morphology for each language group – as well as various transfer consequences (i.e. positive, in the case of Japanese and Spanish).Footnote 4
In order to overcome some of the limitations in this study, potential replications should increase the number of critical items so that separate analyses of written and aural input can be performed. Similarly, one of our reviewers suggests sacrificing validity in favor of a tighter design that would control for presence/absence of all three cues across all stimuli, rather than limiting input to what is possible in Latin, resulting, as in the present case, in stimuli that combined three or two cues (SVO items) and others that included only one (CASE). We suggest increasing the sample size to improve statistical power, including two control groups of Spanish and Japanese monolinguals, and focusing on whether differentiated L2 transfer patterns would be observed in bilinguals at higher levels of L2 exposure and use (i.e. resonance). Testing L2 proficiency rather than relying on program placement would also strengthen the design. Finally, a conceptual replication should include different combinations of languages, especially one that includes an L1 for which native speakers rely on morphology rather than word order for the assignment of semantic functions.