

1. Introduction
At the beginning of the twentieth century, the unified German empire was one of the world's leading economies, with the largest and most modern factories in many strategic sectors. However, the situation was rather different within the German confederation a century earlier. Despite progress in some regions (such as Saxony, the district of Nuremberg, the Rhineland and Silesia), the major economic indicators were not far advanced. Although there is no consensus in the discipline on when exactly the process of Modern Economic Growth began in Germany,Footnote 1 most research on German economic history has focused on the period after 1850.
Nonetheless, the first half of the nineteenth century is especially of interest because of the important economic, political and demographic changes that set the basis for the subsequent impressive catch-up growth. How did these structural changes affect the living standards of Germans? To answer this question, several indicators can be considered, each of them capturing a specific facet of the multidimensional concept of living standards. The destruction of many archival sources during World War II and the scarcity of published economic data, however, complicate all aspects of historical investigation. Traditional indicators focusing on material well-being are highly unsatisfactory for the first half of the nineteenth century. On the one hand, it is almost impossible, for example, to obtain reliable estimates of per capita gross domestic product (GDP) for Germany before 1850 (Fremdling Reference Fremdling1995). Wage data, on the other hand, are frequently selective and recorded money wages inevitably mask the persistence of part-payment in kind (Lee Reference Lee1988). Another strand of the literature tackled the question of living standards by looking at demographic indicators, such as life expectancy, mortality or fertility (Hubert Reference Hubert1998; Marschalk and Dupâquier Reference Marschalk, Dupâquier, Bardet and Dupâquier1998; Knodel Reference Knodel, Brandstrom and Tedebrand1988).
Finally, recent literature used human stature as an index of living standards. The relation between human height and the socio-economic environment is well-established. Although genes play a relevant role in determining adult anthropometric characteristics, environmental factors are the most important determinants in trends in height as well as of the differences in mean height among genetically similar populations (Cavelaars et al. Reference Cavelaars, Kunst, Geurts, Criales, Grotvedt and Helmert2000; Rona Reference Rona2000). Individuals who are poorly fed and suffer from recurrent infections rarely grow well in either childhood or adolescence and are unable to achieve a final adult height that is commensurate with their genetic potential. For children and adolescents, height depends essentially on past food consumption and the incidence of diseases. Changes in socio-economic factors that influence the availability of nutrients or the claims on them (such as changes in the price of food or in public health policies) are then reflected in adult stature. Given the multiple external influences on net nutritional intake, inferences about the biological standard of living are not straightforward and require careful consideration of all the possible factors. Nonetheless, the analysis of stature has proved to be a useful tool and over the past two decades, anthropometric research has made important contributions towards understanding the effect of economic processes and institutional changes on the biological standard of living (for a review, see Steckel Reference Steckel1995).
Time trends of height during the early nineteenth century have been estimated for many countries such as the United States (Komlos Reference Komlos1998), England (Nicholas and Steckel Reference Nicholas and Steckel1991; Komlos Reference Komlos1993) and the Habsburg empire (Komlos Reference Komlos1989). In Germany, height trends are known for three states: Bavaria (Baten Reference Baten1999, Reference Baten2001; Lantzsch and Schuster Reference Lantzsch and Schuster2005), Württemberg (Twarog Reference Twarog, Steckel and Floud1997; Ewert Reference Ewert2006) and Saxony (Cinnirella Reference Cinnirella2008; Ewert Reference Ewert2006). However, data for the northern regions have not yet been analysed and a general trend for the whole German confederation has not been derived. In this article, a dataset of German military recruits who served in the British army during the Crimean War is used to reconstruct height trends for Germany during the first half of the nineteenth century.Footnote 2 Time trends are derived for the main regions, allowing comparison of the effects of different socio-economic structures on the biological standard of living. A separate analysis is carried out for Prussia, the biggest state of the German confederation. Despite being part of the same kingdom, Prussian provinces differed substantially as regards their degree of industrialization, their agricultural system and their social structure. Furthermore, the various provinces implemented with different nuances the agrarian reforms passed by the Prussian government at the beginning of the nineteenth century, making Prussia an interesting case for close analysis of the effect of the reforms on the living standards of the population.
2. Living standards in the German states in the first half of the nineteenth century: an overview
At the beginning of the nineteenth century the German confederation was a pool of several independent states, very different in size, economic and demographic structure, and institutions, not to mention religion. Within the German boundaries clearly backward districts coexisted together with leading regions. As pointed out by Kiesewetter (Reference Kiesewetter1986), German states can be classified as: early industrializing, such as Saxony, the Rhineland and Silesia, where the industrialization process was already under way at the end of the eighteenth century, with a focus on textile and heavy industry; late industrializing, such as Württemberg, Hesse or Baden, where industrialization took place later in the century, with an emphasis on light industry; de-industrializing, such as the Eifel or Harz regions, where the once flourishing extractive industry could not withstand the competition of new producers and slowly succumbed; and agrarian, such as Lower Bavaria, Mecklenburg or the Prussian province of Posen, where the agricultural sector remained predominant throughout the century.
Despite their differences, at the beginning of the nineteenth century the German states had to cope with some common demographic, political and economic forces that called for deep socio-economic transformations.
Albeit with different nuances across its regions, between 1815 and 1871 Germany experienced an unprecedented rate of population growth, which within little more than two generations doubled the number of inhabitants (Marschalk and Dupâquier Reference Marschalk, Dupâquier, Bardet and Dupâquier1998; Hubert Reference Hubert1998; Kiesewetter Reference Kiesewetter2004). Also in those German states where the population increased at a lower pace, such as Bavaria, Baden or Oldenburg, the registered population growth rate was still higher than in other European countries, such as France, in the same decades. Although the degree of urbanization in Germany remained low throughout the nineteenth century, the big cities and, in particular, the regional capitals experienced a sustained growth. The population of Berlin, for example, rose from 172,000 in 1800 to 329,000 in 1840, while that of Munich rose from 49,000 in 1801 to 113,000 in 1840 (Marschalk and Dupâquier Reference Marschalk, Dupâquier, Bardet and Dupâquier1998). The consequent additional pressure on the agricultural resources demanded substantial reforms of the entire economic system.
The nineteenth century is also a period of relevant political changes. The French Revolution and the Napoleonic Wars, with the defeat of the Prussian army at Jena and Auerstadt, brought into power a new group of younger government officials who initiated an important series of reforms. Already in the eighteenth century, Prussia had been in the forefront by creating a universal primary education system. In 1807 and 1808, it emancipated the peasantry from bondage to the aristocratic landlords (Bauernbefreiung), and created occupational freedom in the cities in order to reduce the power of the artisan guilds to determine eligibility for employment with manufacturers (Gewerbefreiheit). The Prussian example was followed in many other states, with the divesting of state-owned manufacturing enterprises across Germany (Tipton Reference Tipton, Ogilvie and Overy2003a).
Napoleon's defeat and the Vienna settlement returned the traditional elites to power but did not stop the modernization process in the long run. The administrators of an increasing number of German states became more and more conscious of economic changes in other countries, which showed that industrialization was necessary for the creation of a strong economy. The adjustments that were necessary to transform German states into industrialized countries were, however, difficult for private entrepreneurs to accomplish alone. The new technologies were complex and expensive, and the limited markets in the smaller states generated concern about whether sufficient revenue would be generated to recover initial investments. The implications of these arguments were actively debated at the time, and much was accomplished by local governments (Henderson Reference Henderson1958; Beck Reference Beck1992). One of the major achievements was the establishment in 1834 of the Zollverein, which, through the abolition of internal custom duties, unified most of the German states (with the significant exclusion of the Habsburg empire) into a single market (Shiue Reference Shiue2005). The customs union and, later in the century, the development of the railway network, reinforced a process of market integration that started earlier and that was in place probably since the end of the eighteenth century. The food market, in particular, appears to have been already well integrated by the 1820s (Fremdling and Hohorst Reference Fremdling, Hohorst, Tilly and Fremdling1979): the increasing economic interdependence between German states and between them and the rest of Europe intensified the exposure of the population to market forces.
The answers of the German states to these challenges were different: while some tried to accept and drive the changes, others tried to resist modernity. The socio-economic transformations connected with these processes were substantial, even in the most conservative states. The balance of power shifted towards the middle class: old forms of dependence were abolished and new forms created. What were the effects of these rapid and fundamental changes on living standards? Most contemporary observers provide a pessimistic answer, denouncing an increase in the incidence of poverty and a general decrease in living standards, particularly for the rural population (Knapp Reference Knapp1887).
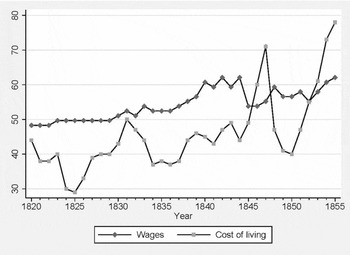
Historians have tackled the question using a broad array of measures. Several scholars collected wage and price data to reconstruct real wage series (Kuczynski Reference Kuczynski1961; Köhler Reference Köhler1967; Saalfeld Reference Saalfeld and Abel1970; Elsas Reference Elsas1940). Figure 1 shows the wage index for industrial workers and the cost of living index available in Mitchell (Reference Mitchell1992).Footnote 3 Nominal wages appear to have been fairly stable during the 1820s. In the subsequent 15 years, an increase, modest at the beginning and more substantial later on, is observable, followed by a sudden drop back at the end of the 1840s and a recovery in the last quinquennium analysed. However, high variability in the cost-of-living index, mainly driven by fluctuations in food prices, induced dramatic changes in the purchasing power of industrial workers, with high peaks (as, for example, in 1825 or in the years 1834–7) and deep troughs (in 1831 and 1847). On average, it can be concluded that industrial wages kept pace with the price development until the end of the 1830s, and began to decline in the mid 1840s.
Wages and cost of living index in Germany, 1820–55
Source: Mitchell (Reference Mitchell1992).

This aggregate figure, however, curtains the wage dynamics across different workers. As noted by Saalfeld (Reference Saalfeld and Abel1970), for example, wages for unskilled workers clearly remained behind those for craftsmen or civil servants, even exhibiting a decline in the phases of falling prices in the 1820s and 1830s. Using data for Leipzig, Saalfeld analyses in further detail the purchasing power of carpenters, calculating how many calories an average household could afford. According to his results, while until the end of the Napoleonic Wars a carpenter's wage was not enough to provide a five-member household with enough food, during the 1820s and 1830s, thanks to lower food prices, there was a clear improvement in purchasing power and, although it declined again during the 1840s, in 1850 a carpenter earned enough to satisfy his family's minimum needs.
Looking at these series, therefore, it can be concluded that, in the non-agricultural sector, demographic and economic changes in the first half of the nineteenth century, while hurting unskilled workers, improved the living standards of skilled workers.
As already mentioned, however, wage data are problematic. For German states, the sources are particularly scarce. Monetary wages ignore in-kind payments, a non-negligible component of workers’ salaries. Finally, such series are unavailable for agricultural workers, which prevents inferences about the living standards of the vast majority of the German population at that time, as well as those most affected by agrarian reforms.
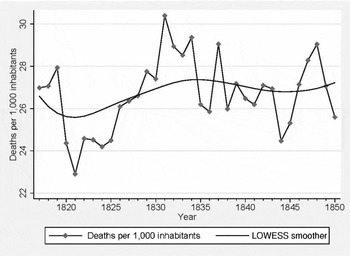
Therefore, in recent decades, several investigators have adopted different indicators. A good deal of research has focused on mortality and life expectancy, as these measures capture how basic needs (nutrition, housing, drinkable water and health care) are met by society. The picture that emerges is quite gloomy. With an average of 26.6 deaths per 1,000 inhabitants, German states exhibit a very high mortality rate in the period 1817–50, especially compared with countries like France and Great Britain where in the same period mortality was already on a declining path (Hubert Reference Hubert1998). Not only the spread of epidemics (such as cholera in 1831 and 1848) but also economic circumstances – more specifically agrarian cycles – had a noticeable effect on the average mortality rate (Hubert Reference Hubert1998): the abundant harvests and low food prices in the years 1820–5 may partially explain the drop in mortality observable in those years, just as the economic crisis in 1846–8 contributed to its increase (Figure 2).
Mortality in Germany, 1817–50
Source: Hoffmann (1965, table 1, p. 172).

The high infant mortality rates offer an explanation for the high overall mortality. Infant mortality in Germany was, in fact, among the highest in western Europe and exhibited an increasing trend during the first half of the nineteenth century (Lee Reference Lee and Fout1984). Infant mortality also affects life expectancy. The available statistics show that life expectancy in the first half of the nineteenth century stagnated at very low levels. For example, until 1860 a newborn and a 10-year-old child in Prussia had life expectancies of 27 and 41 years respectively. Only at the end of the 1860s did life expectancy at birth start to increase, while improvements in life expectancy at older ages can be observed only in the first half of the twentieth century (Hubert Reference Hubert1998; Marschalk and Dupâquier Reference Marschalk, Dupâquier, Bardet and Dupâquier1998; Guinnane Reference Guinnane, Ogilvie and Overy2003). Also the stillbirth incidence, another good indicator of general health care and sanitary conditions, does not show improvements until the end of the 1880s, when it started to fall after having been stable at about 4 per cent since the mid eighteenth century (Kraus Reference Kraus and Köllmann1980; Hubert Reference Hubert1998).
These average figures, however, hide strong regional disparities. Regional data on infant mortality, for example, show that while in industrializing areas such as the Prussian provinces of Rhineland and Westphalia between 1820 and 1860 infant mortality rates were quite stable at fairly low levels (135 and 151 per thousand respectively; Lee Reference Lee and Fout1984), in backward and mainly agricultural Bavaria or in the eastern Prussian provinces in the same decades they rose dramatically, reaching peaks, as in Lower Bavaria, of more than 350 deaths per thousand children below one year (Hubert Reference Hubert1998; Brown and Guinnane Reference Brown and Guinnane2001).
Such regional differences are observable also when looking at another indicator often used to gain insights into different aspects of living standards, namely the rate of population growth. As most of the world at the beginning of the nineteenth century was still constrained within the tight limits of Malthusian economies, high rates of population growth signal that a growing number of individuals had now secured at least subsistence consumption levels. The experience of the different German states reveals that population grew at much higher paces in industrializing regions (like the kingdom of Saxony or Westphalia) and in areas which structurally changed their agricultural sector (like the eastern Prussian provinces) than in more conservative and backward states (like Bavaria, Baden and Württemberg) (Hubert Reference Hubert1998; Kiesewetter Reference Kiesewetter1986, Reference Kiesewetter2004). If, on the one hand, high rates of population growth are a positive sign, on the other hand they also imply an additional pressure on resources. That might have implied a change to inferior food (for example, the substitution of wheat with maize or potatoes), which put an additional strain on the nutritional status of the population. Indeed, data on caloric availability, another dimension of the living standards, reveal that Germans consumed enough calories to fully satisfy their nutritional needs only at the end of the 1880s (Hoffmann Reference Hoffmann1965, table 170, p. 659).
The story told by the demographic indicators to a certain extent contradicts the pessimistic view, which ascribes the stagnation or the decline in the main indicators of living standards to the new role of female labour induced by industrialization and to the urbanization process (Marschalk and Dupâquier Reference Marschalk, Dupâquier, Bardet and Dupâquier1998; Hubert Reference Hubert1998; Lee Reference Lee and Fout1984): indeed, it seems that the worst performers in terms of infant mortality and population growth were the less industrialized states.
Other scholarsFootnote 4 have used different indicators (such as the number of physicians per capita or the rejection rates in the army due to physical unfitness) to further identify the evolution of living standards in the first phases of industrialization. As the summary reveals, the debate is far from being concluded. Important improvements in the standard of living are not evident, but neither are the general increase in the prevalence of poverty and the deterioration of living standards. This article offers a further piece of evidence for the discussion of this issue.
3. Materials and Methods
Data on the height of Germans born between 1815 and 1840,Footnote 5 who served as soldiers under the British flag at the time of the Crimean War (1854–6), are analysed. In accordance with firmly established military tradition, in 1854, the British government allowed the military to recruit foreign soldiers to supplement the regular army, given the substantial loss of soldiers at the end of that year and the difficulty in attracting new domestic recruits. The recruitment of volunteers (mainly German, Italian and Swiss) started in 1855 and ended in March 1856, when the peace treaty with Russia was signed. The German Legion (as the German volunteers were called), indeed, never reached the Crimea as the war had finished before the British army managed to collect and train the desired number of volunteers (Bayley Reference Bayley1977).
The original data set includes records for approximately 13,500 soldiers, whose stature was measured as they entered the army. In addition to height, the recruitment lists specify age at entry, state and city of provenance, former profession, date of physical examination and regiment. The database was compiled using British German Legion: nominal rolls (6–16) and the inspection certificates of the recruits (32–35) (Public Record Office, London, WO15). Because two sources were used, records for some recruits appeared more than once. Thus, almost 5,000 duplicates were excluded from the analysis.Footnote 6
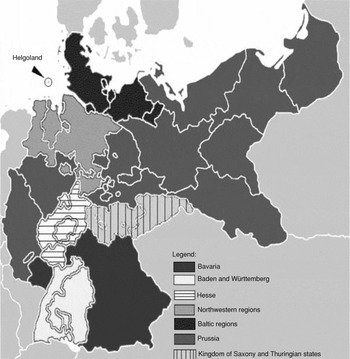
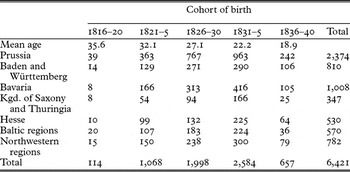
The duplicate records facilitated testing of the accuracy of the measurements. For one-half of the soldiers whose records appeared more than once, the measured height was exactly the same. When there were discrepancies, the reported heights differed by less than 0.5 inches (i.e. slightly more than 1 centimetre). This imparts some confidence in the accuracy of the data. Additionally, we have records for nearly 2,000 soldiers not born in German states and, therefore, not used in the present analysis. Data were grouped into seven regions: Prussia, Baden and Württemberg, Bavaria, Saxony and Thuringia, Hesse, the northern coastal regions (including Schleswig and Holstein, Mecklenburg, Hamburg and Lübeck) and the northwestern regions (including the kingdom of Hanover, Oldenburg, Brunswick and Bremen). Figure 3 shows their location and Table 1 shows the sample numerosity according to birth cohort and region as well as the mean age of each birth cohort.
German states after 1815: regional groups and location of Helgoland island

Composition of the sample by region of origin and birth cohort

The representative nature of the data must be considered. Because enlistment in the British army was voluntary, self-selection could be a confounding factor.Footnote 7 Thus, the conditions under which recruitment occurred and the possible reasons why an individual chose to enlist should be considered. British recruitment operations in the German states were delegated to Baron von Stutterheim, a charismatic figure who served in the British army in the late 1830s and also participated in the Schleswig-Holstein uprising against Denmark in 1848. The involvement of this influential personage is crucial: his emphatically liberal views reflected the political convictions of many of the soldiers who served with him during the 1848 rebellion. At the end of the revolutionary storm, being too destitute perhaps to afford the cost of the trip back home, many soldiers gravitated to the coastal cities (Kiel, Altona, Hamburg and Lübeck) where they led a poverty-stricken existence. The arrival of Stutterheim in Hamburg on April 1855 was welcomed by the Schleswig-Holstein veterans, who were apparently destined, in the absence of other alternatives, to be absorbed into the ranks of the urban proletariat and casual labourers of the counting houses and docks of the great German northern ports. Within a few weeks, Stutterheim raised a force of several thousand men, despite the fact that recruitment for the foreign legion had been declared illegal in January 1855 by the Senate of Hamburg and by the city of Lübeck and despite the efforts of the local police to stop the recruitment activities.
The collection point was set in Helgoland, a small island 70 km from the German coastline that, after the Napoleonic Wars, belonged to Britain.Footnote 8 No aid was given to the potential soldiers to help them reach Helgoland. Travel to the island was not an easy task, given the lack of a regular service by steamship (which was closed during the winter season), and the substantial police surveillance of the embarkation procedures in the main ports. In many cases, the men had to travel to the small and distant cities of Stade or Glückstadt and find a local sailor willing to adjust his normal route to take them to Helgoland.Footnote 9
To better understand the possible factors involved in self-selection, one might consider the decision to enlist in the army as tantamount to the decision to participate in the labour force. The rational individual would choose to enlist if the wage he would obtain from the army, w, was higher than his reservation wage, wr, defined as the wage at which he was indifferent with respect to enrolling in the army or being unemployed or working at home.

The reservation wage for an individual was a function of his human capital (i.e. educational attainment and physical capability) and the conditions of the labour market (e.g. the unemployment rate) where he lived. Affecting the costs sustained by the potential recruits, distance from the recruitment point also played an important role in the decision to enlist, with an effect that, at first glance, is unclear. A first line of reasoning leads one to expect a positive association between distance and the reservation wage. If the soldier came directly from home, the farther away the country of origin, the greater was the cost of reaching Helgoland, and, therefore, the greater was the wage that had to be offered by the army to compensate for the cost of travel. Given that the army offered a fixed wage w, we may expect a lower number of recruits from regions far away from the recruitment point. However, if the financial situation of the majority of the recruits is taken into account, we suppose that, as the distance from the recruitment point increases, the reservation wage decreases. This was the case with those from distant regions (such as Bavaria or Baden) who were part of the crowd of veterans of the Schleswig-Holstein uprising; these men could not afford the cost of the trip back home and, therefore, searched the harbour looking for any jobs, including low-paying ones. In contrast, veterans from northern regions were more likely to be able to afford to return to their home towns after the conflict. Thus, the cost of searching for a job was lower for the latter group, because they could rely on the support of their family and on a better knowledge of the local economic conditions.
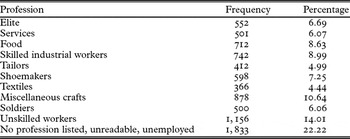
In the light of these considerations, the sample cohort most likely comprises primarily poor and unskilled workers who were mainly from southern German states. The characteristics of the sample substantiate these considerations. Almost 100 different professions were listed in the original documents, and they were grouped into 11 categories. Although the majority of the recruits were (as expected) unskilled workers, recruits from other professions were also represented: skilled industrial workers (e.g. moulders and carpenters) and white-collar workers (e.g. secretaries, physicians, merchants and renters) represent 16 per cent of the sample; see Table 2). The variety of professions reported suggests that the sample is composed of a broad spectrum of workers.
Composition of the sample by profession

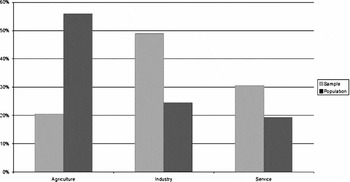
The recruits’ occupations can be organized into three major sectors (agriculture, industry and services) to compare the composition of the sample with that of the population of the German states at large. As shown in Figure 4, the recruits were employed predominantly in non-agricultural occupations, and the agricultural sector is highly underrepresented (despite the inclusion of the workers with no profession listed). The analysis, therefore, mainly pertains to what we might call the ‘industrial proletariat’. The heights of the recruits should, in turn, be compared with those of persons from other lower classes.
Composition of the sample by sector of activity
Source: Population data: Hoffmann (Reference Hoffmann1965, table 20, p. 204); sample: own calculation.
Note: Population data for year 1852.

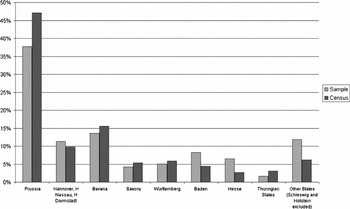
Although recruitment was in a remote location that was difficult to reach, the sample provides good regional coverage for all the birth cohorts (Figure 5).Footnote 10 The percentage of recruits from Prussia is slightly less than that for the general population, whereas the percentages of recruits from Bavaria, Baden and Hesse is moderately greater than those for the general population. The discrepancies, however, all appear to be less than 10 per cent. Our sample, therefore, is not biased towards specific regions. On the contrary, the regional composition of the sample is quite similar to that of the general population.
Sample and population composition by regions
Source: Population data: Mitchell (Reference Mitchell1992); sample: own calculations.
Note: Population composition by region is calculated as average from the censuses for the years 1816, 1828 and 1834.

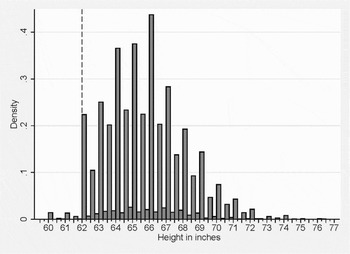
As with the vast majority of military cohorts, this sample is affected by the problem of truncation, because of the minimum height requirement imposed on the recruits. Figure 6 clearly shows a truncation point at 62 inches (157.48 cm).Footnote 11 If truncation is not adequately taken into account, estimates will be biased. Truncated maximum likelihood regression has proven to be an efficient way to explicitly model this phenomenon, giving unbiased and consistent estimates (A'Hearn Reference A'Hearn2004; Komlos Reference Komlos2004). This method has therefore been applied in all the regressions performed in this work.
Height distribution of German-born soldiers

4. Results
4.1. Cross-sectional results and height trends
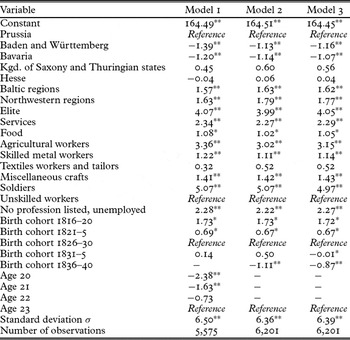
Despite the wide differences among German states concerning economic institutions and demographic structure, truncated regression analysis on the pooled data, controlling for the area of birth, reveals some common features (Table 3).
Height determinants

Significance levels:†: 10% *: 5% **: 1%
aLatest birth cohort excluded.
bLatest birth cohort (1836–40) included. Height at age 23 for recruits aged 18–22 calculated using the annual height increments of Saxon soldiers born between 1804 and 1849 from Ewert (Reference Ewert2006, table 1, model (e), p. 60).
cLatest birth cohort (1836–40) included. Height at age 23 for recruits aged 18–22 calculated using the annual height increments of Bavarian convicts born between 1810 and 1889 from Baten and Murray (Reference Baten and Murray2000, table 5, p. 360).
First, skilled industrial workers, craftsmen and recruits belonging to the elite group (e.g. merchants, students or physicians) appear to have a height premium over the unskilled workers. Since height is sensitive to income distribution and since previous occupation is a proxy for social status, this result reveals a certain degree of inequality in the distribution of resources (Table 3). Indeed, the available evidence on income distribution in various German states later in the century partially confirms the finding: in the Prussian provinces the estimated Gini coefficient ranges between the relatively high levels of 23 and 33 in the years 1849–52 (Baten Reference Baten1996; Bass Reference Bass1991); similarly, Kuznets (Reference Kuznets1955) reports that in 1875 in Prussia and in Saxony the top 5 per cent of the population owned respectively 26 and 34 per cent of the resources, while Baten estimates that in the Palatinate region of Bavaria the share of wealth held by the top 10 per cent of the population was 44 per cent around 1840 (Baten Reference Baten, Ogilvie and Overy2003, footnote 25, p. 418). Also individuals with privileged access to food (such as butchers or cooks), for whom a high-quality and protein-rich diet was cheaper, were significantly taller than unskilled recruits. Finally, low-skilled workers from the manufacturing sector (e.g. tailors, weavers, spinners) do not show any significant height differential.
Secondly, in line with similar studies, the estimated age effects show a monotonic annual increase in height between ages 20 and 23, with a global increase of slightly more than 2 cm (Table 3, model 1).Footnote 12 The growth phase prolonged into the 20s that emerges from the analysis, therefore, highlights a common poor nutritional level during childhood in Germany.
Finally, a decreasing trend in height is evident for the first 15 years after the Vienna settlement. Heights reached a trough for the cohorts born at the end of the 1820s and remained stable thereafter: recruits born between 1826 and 1830 are 1.7 cm shorter than those born between 1816 and 1820, whereas the height of recruits born between 1830 and 1835 is not significantly different from the height of the cohort born between 1826 and 1830 (model 1, Table 3).
The structure of the sample calls for great caution in interpreting this result. First of all, only 114 observations comprise the birth cohort 1816–20, leading to a big standard error that reduces the precision of the estimate, making it difficult to assess with precision the magnitude of the decline between 1816 and the end of the 1820s. In this respect, however, it is of some comfort that the estimated decline is coherent with results obtained in other studies for both Saxony and Bavaria: Saxon recruits born between 1815 and 1819 are 1.68 cm taller than those born between 1825 and 1829 (Ewert Reference Ewert2006, table 1, column (e)) (for the same period Cinnirella (Reference Cinnirella2008) obtains an estimate of 2.12 cm – table 4, p. 244), while Bavarian convicts born between 1810 and 1819 are 1.52 cm taller than convicts born between 1825 and 1829 (Baten and Murray, Reference Baten and Murray2000, table 5, p. 360).
Secondly, and more important, the trend could be the spurious outcome of a composition effect. Having a single cross-section of data,Footnote 13 in fact, cohort membership is a perfect function of age, implying that later birth cohorts are made up of an increasing number of very young individuals. Indeed, the birth cohort 1836–40 includes only men aged 15 to 20 and almost 60 per cent of the observations in the 1830–5 birth cohort are younger than 23 years, while all the other cohorts include only individuals in their physical maturity. Given the prolonged growth phase highlighted above, these young recruits had probably not reached their final adult height, and the negative effect associated with birth in the later cohorts may reflect this delayed growth process rather than a worsening in living standards. For this reason, in model 1 the last birth cohort was excluded from the analysis. Models 2 and 3 offer a correction for the problem of young recruits, giving an indication of the possible direction of the height trend in the late 1830s. Model 2 uses Ewert's estimates of height increments for the Saxon soldiers born between 1825 and 1829 (Ewert Reference Ewert2006, table 1, column (e)) to construct forecasts of the height the youngest recruits would have reached at age 23. Model 3 repeats the experiment using Baten and Murray's estimates for Bavarian convicts in the first half of the nineteenth century. Both the experiments confirm a decline in height that extends well into the 1830s.Footnote 14
Several factors can account for this general trend. First of all, the degree of inequality in the distribution of resources may have increased in the first decades of the nineteenth century: in this case, the possible gains in stature reached in the richer social groups are offset by the decline in height experienced by the poorer classes, so that on average the whole population shortens over time as inequality increases (Komlos Reference Komlos1998). According to Baten (Reference Baten2000), nutritional inequality increased over time in Bavaria between the end of the eighteenth and the beginning of the nineteenth century. Ewert (Reference Ewert2006) and Cinnirella (Reference Cinnirella2008) reach similar conclusions for the kingdom of Saxony. Finally, making use of tax statistics, Dumke (Reference Dumke, Brenner and Thomas1991) provides support for the idea of rising income inequality in Prussia, at least between 1850 and 1914. Therefore, an increasingly uneven distribution of resources in these three states, which represented more than 60 per cent of the whole German population at that time, may explain the estimated overall decline in height.
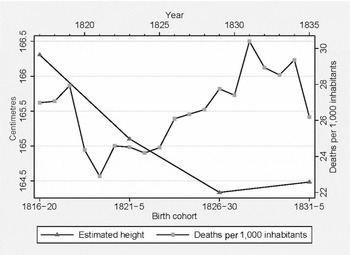
Another element that may have contributed to the deterioration in living standards is the worsening of the disease environment: the increased urbanization related to the outset of industrial society, scarce provision of public sanitation and difficult access to medical care for the poor may have favoured the transmission of disease, leading in turn to higher nutritional claims and to declining height. In this respect, it is interesting to note that the declining height trend goes along with an increase in the overall mortality rates in Germany (Figure 7).
Height trend and crude death rate in Germany, 1817–35
Source and notes: Height on the left axis; weighted average of the birth cohort coefficients from Table 3, model 1. Mortality on the right axis; Hoffmann (Reference Hoffmann1965, table, 1 p. 172).

As modern studies in developing countries show, the time available for childcare is one of the major factors affecting children's growth (Fabusoro et al. Reference Fabusoro, Afolabi and Adenekan2004). Thus, an increase in women's workload may also have negatively affected the physical development of the later cohorts. Indeed, the spread at the beginning of the nineteenth century of potatoes and sugar-beet, both labour-intensive crops, arguably increased the amount of work performed by women, as they were largely employed in the cultivation of these two crops (Lee Reference Lee and Fout1984). Furthermore, the development of domestic industry also increased the workload of women (Tipton Reference Tipton2003b).
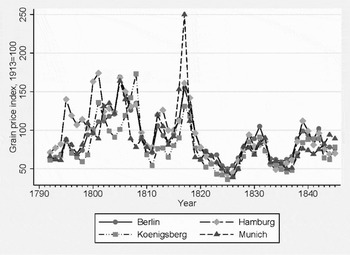
Changes in food prices, finally, offer another possible explanation for the declining height trend: increases in food prices not compensated by similar increases in wages may have induced a decline in height. Despite the political and economic divisions within the German confederation, food markets were highly integrated well before the implementation of the Zollverein. As Figure 8 shows, an increase in grain prices around 1817 and again at the end of the 1820s is observable in all the main German cities. This could explain why the cohort born between 1826 and 1830 was shorter than the cohort born at the beginning of the 1820s. It does not explain, however, why this latter cohort is still shorter than the cohort born between 1816 and 1820, although food prices immediately after the Vienna settlement were higher than at the beginning of the 1820s.
Grain price index in four German cities, 1792–1846
Source: Jacobs and Richter (Reference Jacobs and Richter1935, p. 52).

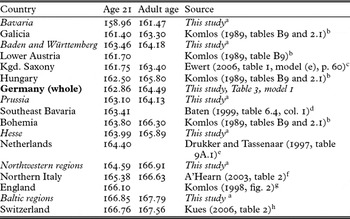
Apart from these common features, cross-sectional results also reveal regional differences: in particular, a clear north–south gradient in height emerges, with soldiers from the southern states being about 3 cm shorter than soldiers from the northern regions (Table 3). This gap could be partially explained by the self-selective nature of the sample. As already discussed in Section 3, recruits from the south were probably more destitute than those from northern regions, and were therefore shorter than the average population they came from. Indeed, the average height estimated in this work for southern soldiers is slightly below that obtained using other samples. Ewert (Reference Ewert2006), for example, estimates for adult males (i.e. aged 24 and older) born in Württemberg between 1815 and 1819 an average height of about 164.81 cm (table 2, column (d)), while the Württemberger soldiers in this sample are on average 163.1 cm tall (Table 3, model 1), that is almost 2 cm shorter.Footnote 15 Similarly, Baten estimates for Bavarian males an average height ranging from 163.4 cm for the 21-year-old conscript from southeast Bavaria (Baten Reference Baten1999, table 6.4, column 1, p. 136) to 167.3 cm for adult prisoners (Baten Reference Baten1999, table 5.1, column 1, p. 94); in the present sample adult Bavarians are only 163.3 cm. tall (Table 3, model 1).Footnote 16
However, evidence of a north–south differential emerges also from other sources: military records at the beginning of the twentieth century reveal a height differential between Bavaria and the northern regions of about 2 cm (Evert Reference Evert1908), and a similar pattern is still evident looking at post-World War II data (Bundesministerium der Verteidigung 1997). Therefore, while the magnitude of the gap between northern and southern regions could be overestimated in this sample, the existence of such a gap is not a spurious outcome.
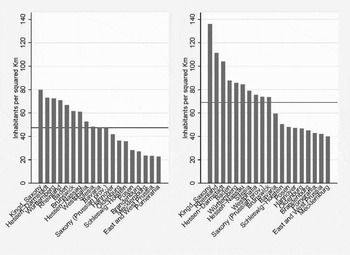
Different factors might be responsible for the observed difference. First of all, the different degree of population density might offer an explanation for the observed differential: as Figure 9 shows, in the first half of the nineteenth century the northern states were less densely populated than the southern states, although between 1815 and 1855 the rate of population growth was generally higher in the north than in the south. In particular, both Baden and Württemberg had a population density above the average (the horizontal line in the graph), while Mecklenburg and Schleswig-Holstein lay well below it. Due to the greater pressure on resources, therefore, southerners may have been unable to reach the same nutritional levels as northerners. Furthermore, lower population density and the consequent lack of workers also prompted technological improvements in northern agriculture: unlike the southern states, the northern regions (in particular, those by the Baltic Sea) had already adopted more efficient production systems and tools in the eighteenth century (Assion Reference Assion and Wiegelmann1985; Lee Reference Lee1988). More specifically, thanks to the adoption of the Koppelwirtschaft, Holstein and Mecklenburg increased cattle breeding and dairy farming (Schröder-Lembke Reference Schröder-Lembke1956; Assion Reference Assion and Wiegelmann1985; Kaak Reference Kaak1991). Due to the lack of refrigeration systems, food items like milk and butter could not be shipped (O'Rourke and Williamson Reference O'Rourke and Williamson1999; Koepke and Baten Reference Koepke and Baten2008), so people living in the northern coastal areas had privileged access to important sources of animal protein which may have determined their taller heightFootnote 17 despite the great poverty of the working class in these areas (Assion Reference Assion and Wiegelmann1985).
Population density in several German states, 1815–55
Source: Hubert (Reference Hubert1998, table 3, p. 45).

Finally, different breastfeeding practices may also help explain the shorter stature of southerners: while in the north the majority of women breastfed their children, often for a prolonged time, in Bavaria, Württemberg and Baden breastfeeding was seldom practised. Furthermore, in these regions the quality of the food received by artificially fed children was inferior relative to other areas. The lack of cattle (exacerbated at the beginning of the nineteenth century by troop movements and the requisition of livestock during the Napoleonic Wars) led to infants being fed with a sweetened corn-pap rather than animal milk (Vögele Reference Vögele1994). Unlike breast milk, this artificial food was not only nutritionally deficient, but increased the chances of catching infectious diseases due to poor hygiene in its processing and storing. As nutrition in the first years of life is a major determinant of final adult height (Baten Reference Baten1996; Eveleth and Tanner Reference Eveleth and Tanner1991), the lack of important nutrients and the higher disease burden may have impaired the growth of southern children, leading to the observed height differential.Footnote 18 Breastfeeding practices were not only influenced by cultural factors: they were also a reaction to economic circumstances. A wider use of female labour in the south, obliging women to resume physically demanding work shortly after giving birth, may have served to reduce the extent and the duration of breastfeeding. At least in the agricultural sector that appears to have been the case: Assion (Reference Assion and Wiegelmann1985) and Gehrmann (Reference Gehrmann2002) point out that at the beginning of the nineteenth century in the south women were still performing tasks that, thanks to the introduction of more efficient production tools (like the scythe, which in the south replaced the sickle only at the end of the century), were performed only by men in the north.
The height of recruits from central German states (the kingdom of Saxony, the Thuringian states, or the grand duchy of Hesse) and from Prussia lies in the middle range. Interestingly, Saxon and Thuringian soldiers appear to be taller than natives of Bavaria, Baden or Württemberg. This result is a bit puzzling, as other studies using different samples reveal that Saxony experienced a sharp height decline starting at the end of the eighteenth century that lasted well into the nineteenth (Ewert Reference Ewert2006; Cinnirella Reference Cinnirella2008), such that Saxons born between 1815 and 1840 were shorter than Bavarians (Ewert Reference Ewert2006, figure 5, p. 64). Indeed, the estimated height for the Saxon and Thuringian areas is slightly higher than in other studies (164.5 cm in this work, Table 3, model 1; 163.4 cm in Ewert Reference Ewert2006, table 1, model (e); 161.5 cm in Cinnirella Reference Cinnirella2008, table 4). The small number of observations, however, does not allow for precise estimates: the coefficient for Saxony and Thuringia is, in fact, 0.450 (Table 3, model 1) with a standard error of 0.466.
In terms of international comparison, the estimated heights for the various German regions fall within the range of the European experience at the beginning of the nineteenth century (Table 4). While the height of Prussians, Bavarians and of the inhabitants of Baden and Württemberg is similar to that of eastern and southeastern Europeans, central and northern Germans are more similar to Dutchmen, Frenchmen or Englishmen. Bearing in mind the problems of selection of the sample and the multiplicity of factors influencing height, the precise ordering is not to be taken too literally. However, the fact that the results of this study are not too distant from those obtained for neighbouring regions increases our confidence in their validity.
German height in international comparison, 1820–40

aTruncated maximum likelihood estimates. Unskilled worker, born between 1826 and 1830. Adult = older than 23. Separate estimates for each region.
bHeight at age 21: quantile-bend estimates for ages 19–20 plus 1 cm. Soldiers born in the late 1830s. Adult height: truncated sample means converted to estimates of population mean assuming a standard deviation of 6.86 cm, a normal distribution, and an effective truncation point 0.5 ‘below the official MHR of 63’.
cTruncated maximum likelihood estimates. Unskilled men born between 1825 and 1829.
d21-year-old conscript from the working class, born between 1825 and 1829, rural residence.
eMedian height at age 20 plus 6.4 mm.
fTruncated maximum likelihood estimates. Soldiers born between 1825 and 1830, rural residence, no occupation given.
gIndex for ages 20–23, times 167.7 cm base.
hTruncated maximum likelihood estimates. Soldiers born between 1825 and 1829.
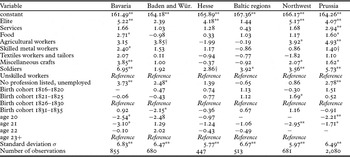
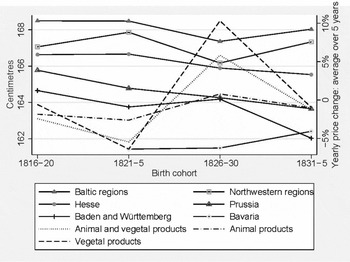
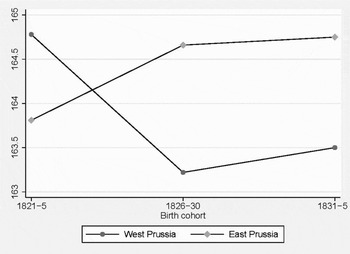
Regional differences also emerge in height trends: with the exclusion of Saxony and Thuringia, the size of the sample allows us to estimate separate regressions in each area, obtaining regional height trends. The results are reported in Table 5, while Figure 10 depicts regional height trends.
Height determinants: regional analysis

Significance levels: †: 10% *: 5% **: 1%
Height trends by region
Source: Regional height trends calculated from the coefficients in Table 4; changes in the price index for animal and vegetal products from Jacobs and Richter (Reference Jacobs and Richter1935, pp. 78–9).

The estimates reveal that the negative differential for the southern states, highlighted already in the cross-sectional analysis, persisted during the first half of the century: for Baden and Württemberg the gap appears even to increase for the cohort born in the 1830s, whose height declined markedly and despite a general decline in grain prices (see the dashed line in Figure 10). The bad performance of this macro-region stands in contrast to that of nearby Bavaria, where height stagnated (although at very low levels) during the 1820s and then increased at the beginning of the 1830s.Footnote 19 The different development path of these two regions might explain the divergent trend.
While Bavaria was mainly a rural region, whose peasants were practising little more than self-sufficient agriculture, Baden and to a greater extent Württemberg had a proto-industrial structure (Ogilvie Reference Ogilvie1997; Tipton Reference Tipton2003b). In these regions there was a close relationship between agricultural and non-agricultural sectors, with peasants producing manufactured goods (such as worsted cloth, linen or clocks) for export to non-domestic markets alongside agriculture. When an increase or a change in demand in those markets promoted profit opportunities, urban merchants and artisans’ guilds usually looked outside the town for additional labour (Tipton Reference Tipton2003b). Peasants, however, were keen to keep their properties and worked in the non-agricultural sector only part-time (Megerle Reference Megerle1982): according to Tipton (Reference Tipton2003b), individuals and families aimed for a certain total income so that an increase in the wage rate paid by the manufacturing sector usually meant a reduction in peasant labour supply in non-agricultural activities. This feature may explain the particular height trend observed in the macro-region of Baden and Württemberg, where height declines for birth cohorts born in years with falling grain prices (1816–25 and 1832–5) while it increases slightly for the cohort born in years when the grain prices were increasing (that is, from 1826 to 1831; see Figure 8 and Jacobs and Richter (Reference Jacobs and Richter1935, pp. 35–40)). For individuals employed in non-agricultural activities, a decline in the price of agricultural products might have implied a reduction in their wages: the falling prices for food items meant in fact a decline in the total income for peasant households, which in turn were more willing to work more in the non-agricultural sector. The increase in labour supply, therefore, might have pushed down wages in the manufacturing sector so that the real wages in the proto-industrial districts might have declined, despite the fall in food prices. The reverse could have been true in periods of rising agricultural prices, reducing labour supply from the countryside and therefore fostering wages in the non-agricultural sector.
Furthermore, the falling grain prices might also have reduced the living standards of the offspring of agricultural workers. In the proto-industrial areas, in fact, women had a higher workload than in purely agricultural areas, as besides raising children and taking care of the house, they had to work both in artisan manufacture and on the farm (Tipton Reference Tipton2003b): declining income from agricultural activity due to falling prices might have pressed the family to take on more manufacturing work, with a consequent increase in stress for women and a negative effect on the adult height of their children.
On top of that, between 1815 and 1830 population density grew on average more in Baden and Württemberg than in Bavaria, accentuating the competition for resources and therefore the effect of market conditions on the biological living standards of the population in this area. Indeed, as Tipton (Reference Tipton2003b) points out, the farms of proto-industrial families were small relative to the needs of the expanded population, leading to greater hardship at times of trade disruption or bad harvests. The comparison between Bavarian height, which was low but did not shrink further, and that of people in Baden and Württemberg, which began from a higher level, but declined more markedly during the nineteenth century, reveals therefore that the more rigid and backward institutional and production setting of Bavaria, although unable to promote high living standards, at least prevented big losses. On the contrary, in the southwestern regions the working classes were paying the price of a now more dynamic and developed economy with a marked decline in their living standards.
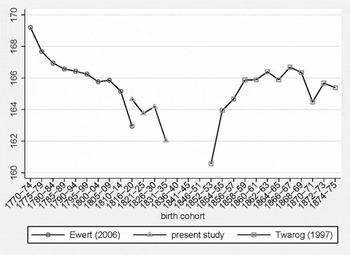
It is particularly reassuring to see that the estimated trend for the macro-region of Baden and Württemberg fits well the picture offered by other studies. Put together, the available evidence shows that the declining height trend in Baden and Württemberg had already started at the end of the eighteenth century and was protracted until the mid nineteenth century (Figure 11).
Height trend in Württemberg and Baden
Sources: Ewert (Reference Ewert2006, table 2, model (a), p. 61); Twarog (Reference Twarog, Steckel and Floud1997, table 8.4. p. 296).

In comparison with the trend in Baden and Württemberg, the height changes in the northern coastal regions follow the development of food prices more closely: in particular, the cohort born between 1826 and 1830, that is, in years of increasing food prices, was shorter than the cohorts born when prices were falling. The different economic structure of the northern regions offers an explanation for the observed trend. In contrast with the southwest, the strong and unidirectional focus on agriculture in the north prevented the development of any kind of rural artisanry. Industry was almost absent and a small number of artisans produced goods for local markets only (Assion Reference Assion and Wiegelmann1985; Tipton Reference Tipton2003b). Particularly in the Baltic regions, different tenurial rights and the progressive adoption of intensive forms of production forced small tenants to dispose of their property, so that a great part of the peasantry was made up of landless farmers (Schröder-Lembke Reference Schröder-Lembke1956; Assion Reference Assion and Wiegelmann1985; Kaak Reference Kaak1991). The increase in height for the cohorts while grain prices were declining reveals an increase in the real wages of the working class in the northern regions. As the western and northern German regions specialized in meat and dairy products (Baten Reference Baten, Ogilvie and Overy2003, p. 388), and given that the prices for animal products remained relatively stable during the 1820s and the 1830s (Jacobs and Richter (Reference Jacobs and Richter1935, p. 36); see also the dashed and the dash-dotted lines in Figure 10), agriculture of these regions may have done relatively better than that of the regions specializing in cereals, whose prices collapsed at the beginning of the 1820s and of the 1830s, so that nominal wages did not decline appreciably and workers could profit from low cereal prices.
In Prussia, finally, heights appear to decline for all the cohorts analysed in this study. Given the wide geographical extension of this state and the marked economic differences between the territories to the west and to the east of the Elbe, a separate analysis is conducted in the next section.
4.2. Industrialization, agrarian reforms and the biological living standards in Prussia
Accounting for about 65 per cent of the surface of the future German empire and for more than 40 per cent of its population, Prussia was certainly one of the most important states within the German confederation. Its territories stretched from the Dutch and Belgian boundaries in the west to the Russian ones in the east, encompassing very different economic and social structures: while large agricultural estates, producing grain for export, were the backbone of the economy in the eastern provinces, the regions to the west of the Elbe river were already predominantly industrial at the beginning of the nineteenth century, with a primary sector increasingly characterized by intensive cultivation, with an emphasis on commercial crops and dairy farming (Dumke Reference Dumke1977; Lee Reference Lee1988; Baten Reference Baten1996). Furthermore, the greater urban diffusion in the framework of denser population in the west stood in contrast with a scarcely populated east, whose towns were relatively far apart (Tipton Reference Tipton2003b; Lee Reference Lee1988; Matzerath Reference Matzerath and Schmal1981).
Not surprisingly, the different economic and social environment affected the living standards of the population in the east and in the west in a distinct fashion. First of all, western regions were richer (Söderberg Reference Söderberg1985; Lee Reference Lee1988) and income more evenly distributed (Bass Reference Bass1991). Demographic indicators also reveal lower living standards in the east: higher mortality from tuberculosis has often been interpreted as evidence of lower nutritional levels and a higher workload in the east; in addition, higher infant mortality has been linked with diffused pauperization and exploitation of female labour (Lee Reference Lee and Fout1984, Reference Lee1988). The better nutritional status in the west is also partially confirmed by the lower proportion of conscripts unfit for the army due to insufficient height (Baten Reference Baten1996, Reference Baten, Ogilvie and Overy2003). Western provinces, finally, also scored better in the ranking of the number of trained physicians per head of population, revealing better medical provision for the inhabitants of these areas (Borchardt Reference Borchardt and Abel1966).
To further explore the extent of these differences, a separate analysis has been conducted for soldiers from the eastern and western Prussian provinces. Indication of the city of provenance was available for approximately half of the Prussian recruits in the sample at hand. For 88 per cent of them it was possible to locate the city in the eastern or in the western part of the kingdom: 62 per cent of the recruits came from the west, while the remaining 38 per cent were from the east. The prevalence of western conscripts in this sample is not surprising given that they lived closer to the recruitment point and also that the majority of the Schleswig-Holstein veterans, the core of the volunteers who enrolled for the Crimean War as discussed in Section 3, came from the western part of Prussia.
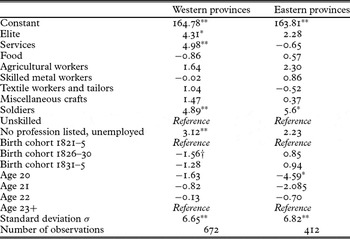
A positive height differential for the recruits from Rhineland and Westphalia, the two Prussian provinces west of the Elbe, is observable also in this sample, at least for the cohort born between 1821 and 1825 (Table 6).Footnote 20 However, the height trend diverges in the two areas in an unexpected way: while in the western part a declining height trend is observable, the height of the eastern soldiers increased slightly at the end of the 1820s and stagnated thereafter (Figure 12). The development over time of the rejection rates in the Prussian army offers a similar picture: between 1831 and 1854 the proportion of conscripts unfit for the army increased considerably in the west, while in the east it remained stable or even declined (Baten Reference Baten, Ogilvie and Overy2003, table 12.1, p. 394).
Height determinants in western and eastern Prussian provinces

Significance levels: †: 10% *: 5% **: 1%
Height trends in the eastern and western Prussian territories
Source: Regional height trends calculated from the coefficients in Table 6.

While the greater distributional equality and the greater availability of protein-rich food may explain the height advantage of the western Prussians, the divergent trend is less intuitive. The different pattern of urbanization followed in the two areas could offer an explanation: between 1816 and 1840 the urbanization ratio (i.e. the ratio between urban population and total population) experienced a rise in the west and a fall in the east (Matzerath Reference Matzerath and Schmal1981; Lee Reference Lee1988). As the disease environment was usually worse in the cities than in the countryside, a higher urban population might have implied an increase in the average disease burden in the west and a consequent decline in average height. Demographic evidence, however, does not offer much support for the idea of a worsening of the disease environment in the west. Indeed, eastern cities appear to be a much more dangerous place to live throughout the nineteenth century: excess urban mortality, in fact, was most pronounced in the eastern towns, which consistently registered a marked graveyard effect (Kearns et al. Reference Kearns, Lee, Rogers, Nelson and Roger1989). Furthermore, between 1819 and 1864 infant mortality rates increased much more in the east than in the west.
Taking into account the fact that this sample, as discussed in Section 3, is mainly representative of the industrial lower classes, a possible further explanation for the divergent trend can be found in the effect the agrarian reforms implemented in Prussia between 1807 and 1816 had on the structure of production in the primary sector.
The traditional reconstruction of the effects of the Prussian reforms points to a concentration of the land in the hands of the Junker aristocracy and large-scale peasant cultivators in the east: small farmers either became daily labourers for the big landowners or migrated to the cities. The comparative advantage enjoyed by these big estates in the production of grain strengthened the tendency toward grain monoculture. As a function of the redistribution of land and the emphasis placed on grain, a marked decline in livestock holding among the peasantry was observable. In the west, by contrast, where the peasants traditionally enjoyed stronger tenurial rights, the reforms produced a more balanced distribution of land. Furthermore, the process of enclosure of common lands, as implemented in the west, encouraged the retention of livestock by peasants with smallholdings, a trend fostered also by the adoption of new fodder crops that improved the milk yields (Lee Reference Lee and Fout1984).
The positive height trend in the east may therefore reveal that the agrarian reforms, and the stronger commercialization that followed, improved the food supply for those not working in the primary sector. On the contrary, in the west the increase in the number of small and medium-size holdings, if beneficial for the peasants, may not have been able to support, at least at the beginning, the food demand of the industrial sector. As a consequence, the poorest in this group may have suffered a decline in their biological living standards. Baten (Reference Baten, Ogilvie and Overy2003) draws a similar conclusion as he notices that the only districts experiencing a decline in the proportion of unfit conscripts between 1831 and 1854 were the large urban trading centres in the east.
A final factor that may explain the height trends in the eastern and the western Prussian provinces is the different degree of occupational freedom (Gewerbefreiheit) in the two areas. Between the end of the eighteenth century and the beginning of the 1820s several major bills were passed in Prussia to dismantle the medieval craft guilds, which monopolized trade and manufacture with their strict regulations: the legal power of the guilds was eliminated and an increasing degree of industrial freedom was introduced. However, the different territorial configurations of Prussia before and after the Congress of Vienna implied that the edicts and laws issued between 1806 and 1824 were applied differently in the various areas: the consequence was a very diversified system, ranging from industrial liberalism along the Rhine to a restrictive guild system still in place in Saxony, Posen or Pomerania (Wendel Reference Wendel1921). Therefore, while during the 1820s in the western part of Prussia increasing freedom implied a higher degree of competition among the industrial workers, in the east the permanence of the guild system offered them a higher degree of protection. Hence eastern Prussians not employed in agriculture would have been able to profit from relatively higher wages and falling prices of agricultural products at the same time, which presumably had a positive effect on their biological living standard; at the same time, the increasing competition in the west certainly induced a decline in real salaries, with a consequent detrimental effect on living standards.
5. Summary and conclusions
Using a sample of German soldiers enrolled as mercenaries in the British army during the Crimean War, the trend and the regional variation in height of recruits born in the early nineteenth century has been investigated. This analysis shed some light on the evolution of living standards in Germany during a period of economic transformation.
A certain degree of inequality in the distribution of the nutritional resources, poor nutritional levels during childhood and a declining height trend during almost the whole period here considered, emerge from the analysis of the whole sample. An increase in the distributional inequality, the worsening of the disease environment, a higher workload for women and a change in food prices not compensated by changes in nominal wages are all factors that may explain the observed trend.
The regional analysis, however, reveals interesting differences in the various German areas, mirroring their different development paths. First of all, the data highlight a north–south gradient in height: although the particular composition of the sample may exacerbate the height premium enjoyed in the north, evidence from other sources confirms the existence of such a differential. Several factors may explain this. First of all, there was greater pressure on resources in the south due to higher population density in the southern states (in particular in Baden and Württemberg), so that people were not able to reach adequate nutritional levels. Secondly, in the Baltic regions of the north that specialized in cattle breeding and dairy farming, protein-rich food (in particular milk) was cheaper, so people could afford a better diet despite their poverty. Finally, the wider diffusion of breastfeeding and a lighter women's workload in the northern regions represent another possible source of height differences between the north and the south.
Height trends also highlight different regional developments in living standards. While Bavaria, with its backward and relatively static economic structure, exhibits a relatively flat height trend during the 1820s, the region of Baden and Württemberg shows a declining trend. The proto-industrial structure of that region, with the peasants also working in the manufacturing sector, can help to explain why heights and grain prices exhibit similar trends there. As manufacturing activities for the small landowners were only of secondary importance and these households aimed at a certain total income, a decrease in grain prices, which reduced the total income of the peasants, should have increased the labour supply in the industrial sector, thus pushing down wages in the non-agricultural sector and therefore reducing the living standards of the workers in the manufacturing sector. Furthermore, taking up non-agricultural work in times of low grain prices to increase income may have implied a higher burden for the peasant women, surely with negative consequences on the nutritional status of their offspring.
In the northern regions, on the contrary, height declined with increasing grain prices, while people grew taller when cereals were cheaper. Also in this case, regional differences in economic structure can explain the result. Peasants in the north, in fact, were mainly landless farmers, not employed in the industrial sector. Furthermore, these regions specialized in meat and dairy products, for which prices remained quite stable during the 1820s and 1830s, so that northern agriculture did not suffer from the huge losses in income the way southern agriculture did and was able to pay roughly constant nominal wages. In contrast with the proto-industrial regions, landless peasants and small artisans in the north may thus have profited from a lower grain price at the beginning of the 1820s and again in the early 1830s, with a positive effect on the final height of people born in those years.
A separate analysis of the soldiers with Prussian origins, finally, reveals two opposite developments: while in the western regions height declined constantly, in the agrarian region of the east it increased for the cohort born at the beginning of the 1820s and stagnated thereafter. This divergent trend can be explained partially by the different outcomes that agrarian and industrial reforms had on the economic structure of the eastern and western territories: the concentration of land and a stronger commercialization of agricultural products may in fact have improved the food supply of the industrial population in the east. Furthermore, the more intense competition in the industrial sector in the west may have contributed to a further decline in the living standards of the working class in comparison with their eastern counterpart.
Acknowledgments
I thank John Komlos for giving me the data and for his support and comments. I also thank Jörg Baten; Joachim Winter; Sascha Becker; Michael Haines; Marco Sunder; Francesco Cinnirella; Luca Tasciotti; Jana Lantzsch; the participants at the sixth EHES conference in Istanbul, September 2005; the participants at the 30th Annual Meeting of the Social Science History Association (SSHA), Portland, Oregon, 3–6 November 2005; and the participants at the 2nd Conference on German Cliometrics, Tübingen, Germany, 7–10 June 2006, for commenting on an earlier version of the article. I am also very grateful to two anonymous referees, who provided invaluable comments. All the remaining errors are mine.