Introduction
Gas sensors play an important role in environmental monitoring, chemical process control, and personnel safety. Metal oxide–based semiconductors (MOSs), such as ZnO, NiO, WO3, and In2O3, have been regarded as promising candidates for gas sensors and investigated intensively because of their fascinating physicochemical properties, i.e., high selectivity and sensitivities to target gases, and simplicity in synthesis for the past ten years [Reference Guo, Zhang, Zhu, Ju, Xu and Cao1, Reference Song, Wang and Yang2, Reference Miao, Zeng and Gao3, Reference Han, Wang, Li, Yu, Yang and Dong4, Reference Xing, Kuang, Lin, Wei, Jian and Song5, Reference Mishra and Adelung6, Reference Malik, Tomer, Dankwort, Mishra and Kienle7, Reference Zhou, Lin, Wang, Zhang, Zhu and Qian8, Reference Poonia, Mishra, Kiran, Sangwan, Kumar, Rai, Malik, Tomer, Ahuja and Mishra9]. It was reported that gas sensing was mainly based on the chemical interaction of gas molecules with the surface atoms of oxides, leading to change in electrical conductivity [Reference Liu, Wu, Yang, Yu, Dong, Wang, Liu, Wang and Zhao10, Reference Poonia, Mishra, Kiran, Sangwan, Kumar, Rai, Malik, Tomer, Ahuja and Mishra11, Reference Tomer, Malik, Chaudhary, Mishra, Kienle, Ahuja and Lin12, Reference Guo, Zhang, Gong, Ju and Cao13]. Thus, the performances of gas sensors are influenced significantly by compositions, particle size, and morphology of microstructures [Reference Liu, Wu, Yang, Yu, Dong, Wang, Liu, Wang and Zhao10, Reference Poonia, Mishra, Kiran, Sangwan, Kumar, Rai, Malik, Tomer, Ahuja and Mishra11, Reference Tomer, Malik, Chaudhary, Mishra, Kienle, Ahuja and Lin12, Reference Guo, Zhang, Gong, Ju and Cao13]. It is confirmed that the special structure and novel morphology are the key issues to exhibit enhanced properties for promising gas-sensing performances [Reference Song, Wang and Yang2, Reference Sang, Park, Choi, Han, Ju, Dong, Nam, Chang and Kim14, Reference Li, Gao, Wang and Zhang15]. Unfortunately, low-dimensional structures such as nanoparticles tend to aggregate, resulting in a decrease in the specific surface area, surface reactivity, and then the gas-sensing performance and stability of gas sensors [Reference Lee16, Reference Min17, Reference Shoyama and Hashimoto18]. By contrast, three-dimensional (3D) porous structures are able to maintain and even enhance the gas-sensing stability and sensitivity for a long time at relatively high working temperatures. Recently, metal oxide semiconductors with hierarchical structures that exhibit higher dimensional microstructures or nanostructures are assembled by low-dimensional nanosized building blocks, i.e., 0D nanocrystals [Reference Li, Li, Zhang and Qian19], 1D nanorods [Reference He, Yin, Liu, Zhang, Cai and Bie20, Reference Kuang, Liu, Shi, Wang, Yang, Hussain, Peng and Pan21, Reference Paulowicz, Hrkac, Kaps, Cretu, Lupan, Braniste, Duppel, Tiginyanu, Kienle, Adelung and Mishra22], and 2D nanosheets [Reference Miao, Zeng and Gao3, Reference Guan, Wang, Zhou, Sun, Wang, Ma and Lu23, Reference Zhang, Zeng and Li24, Reference Tomer, Malik and Kailasam25], present an effectively enhanced gas-sensing performance, which is ascribed to low density, large specific surface area, and the surface permeability. Especially, the nanosheet-assembled hierarchical structures can provide more surface area than others mentioned above and improve gas diffusion effectively within the sensing layer, and then enhance sensor properties [Reference Lee16, Reference Zhou, Jiang, Niu, Zhu, Zhou, Zhu, Liang, Han, Xu, Zhu, Liu, Wang and Qian26]. Moreover, a large inner space between nanosheets provides a facile transport pathway or channel, making the diffusion of gas molecules easily and efficiently.
Tin oxide (SnO2), a stable and well-known n-type wide band gap (3.6 eV @ 300 K) semiconductor, is considered as one of the excellent gas-sensing materials and has been widely used in gas sensors because of its low cost, nontoxicity, convenient fabrication, high sensitivity, and long-term stability [Reference Devi, Manorama and Rao27, Reference Li, Zhang and Kawi28, Reference Wang, Lou, Zhang, Fan and Xu29]. Although the nanosheet-assembled hierarchical SnO2 nanostructures have shown the potential as good candidate for gas-sensing materials, it demands for further optimizing the gas-sensing performance for practical device applications. Thus, the development of gas sensors made of hierarchical SnO2 nanostructures with high sensitivity and remarkable selectivity still remains a challenge. Amount of efforts were made, i.e., doping, constructing heterostructure, and using catalysts [Reference Xue, Xing, Chen, Shi, Wang and Wang30, Reference Zhang, Li, Liu, Han, Tang and Zhou31, Reference Tien, Sadik, Norton, Voss, Pearton, Wang, Kang, Ren, Jun and Lin32, Reference Tomer and Duhan33]. It is worthy of noting that more often noble metals such as Au, Pt, and Pd, were chosen as sensitizers to improve the gas-sensing properties, i.e., MOS loaded by noble metal nanoparticles could significantly improve the gas sensitivity [Reference Guo, Zhang, Zhu, Ju, Xu and Cao1, Reference Li, Zhou, Guo, Wang, Liu, Sun, Liu and Lu34, Reference Choi, Kim, Lee, Kim and Kim35, Reference Korotcenkov36, Reference Yao, Yin, Yan, Yang and Liu37]. Unfortunately, a stabilizer was usually needed to prevent agglomeration of the noble metal nanoparticles prepared by using the conventional method reported in previous literatures [Reference Liu, Kuang, Xie and Zheng38].
In this work, a new method without using the reductive agent was developed to synthesize Au nanoparticles. The pure and Au-loaded SnO2 hierarchical nanoflowers were synthesized and their gas-sensing performances were investigated thoroughly. Because of the advantages of 3D porous hierarchical structure and the sensitizer effect of Au nanoparticles, the obtained Au-loaded SnO2 hierarchical nanoflower sensors presented a superior performance over pristine SnO2 in selectivity, response, response–recovery time, and long-term stability for ethanol sensing.
Results and discussions
Structure characterizations
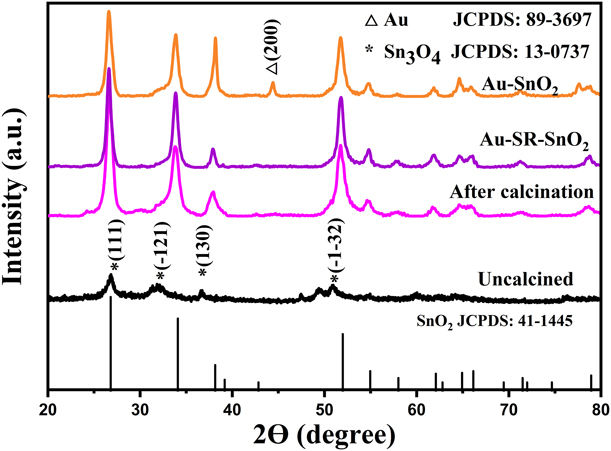
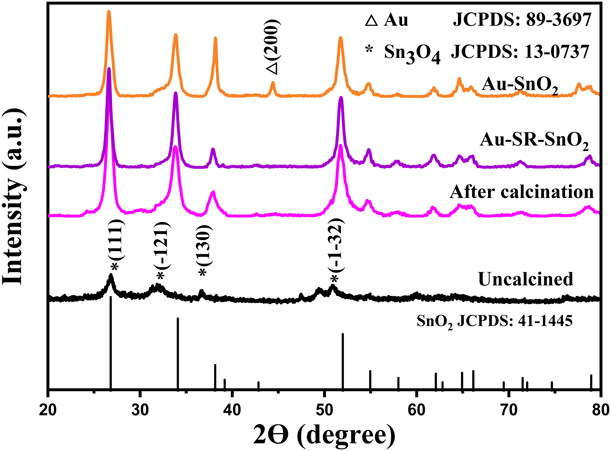
In this work, Au-loaded SnO2 nanoflowers, named as Au-SR-SnO2 or Au–SnO2, were synthesized by using the newly developed self-reductive method or the conventional method reported by the literature [Reference Guo, Zhang, Gong, Ju and Cao13], respectively. The X-ray diffractometer (XRD) characterization was used to investigate the crystal structure of the as-prepared pure and Au-loaded SnO2 nanoflowers, and results are shown in Fig. 1. The XRD pattern of the as-prepared powder synthesized by using the hydrothermal method without calcination indicated the existence of Sn3O4 (JCPDS Card No. 13-0737), which usually showed strong reducibility and acted as a reductant for the subsequent Au-loading process. The XRD patterns for the calcined products could be indexed to the pure rutile SnO2 (JCPDS Card No. 41-1445), and no any impurity diffraction was detected. Moreover, the crystallinity was improved compared with the uncalcined one. All diffractions of Au-SR-SnO2 could also be indexed to the structure of rutile SnO2, but the diffractions from Au nanoparticles were absent, which was probably ascribed to the fact that the content of the high-dispersed Au nanoparticles was lower than the detection limit of XRD measurement. Moreover, it was worthy of noting that one additional diffraction peak positioned at 44.39° could be observed and indexed to Au (JCPDS Card No. 04-0784) in Au–SnO2 pattern, which was probably ascribed to the aggregation or abnormal growth of Au particles.
XRD patterns of the uncalcined and the calcined hydrothermal products, Au–SnO2 and Au-SR-SnO2 samples.
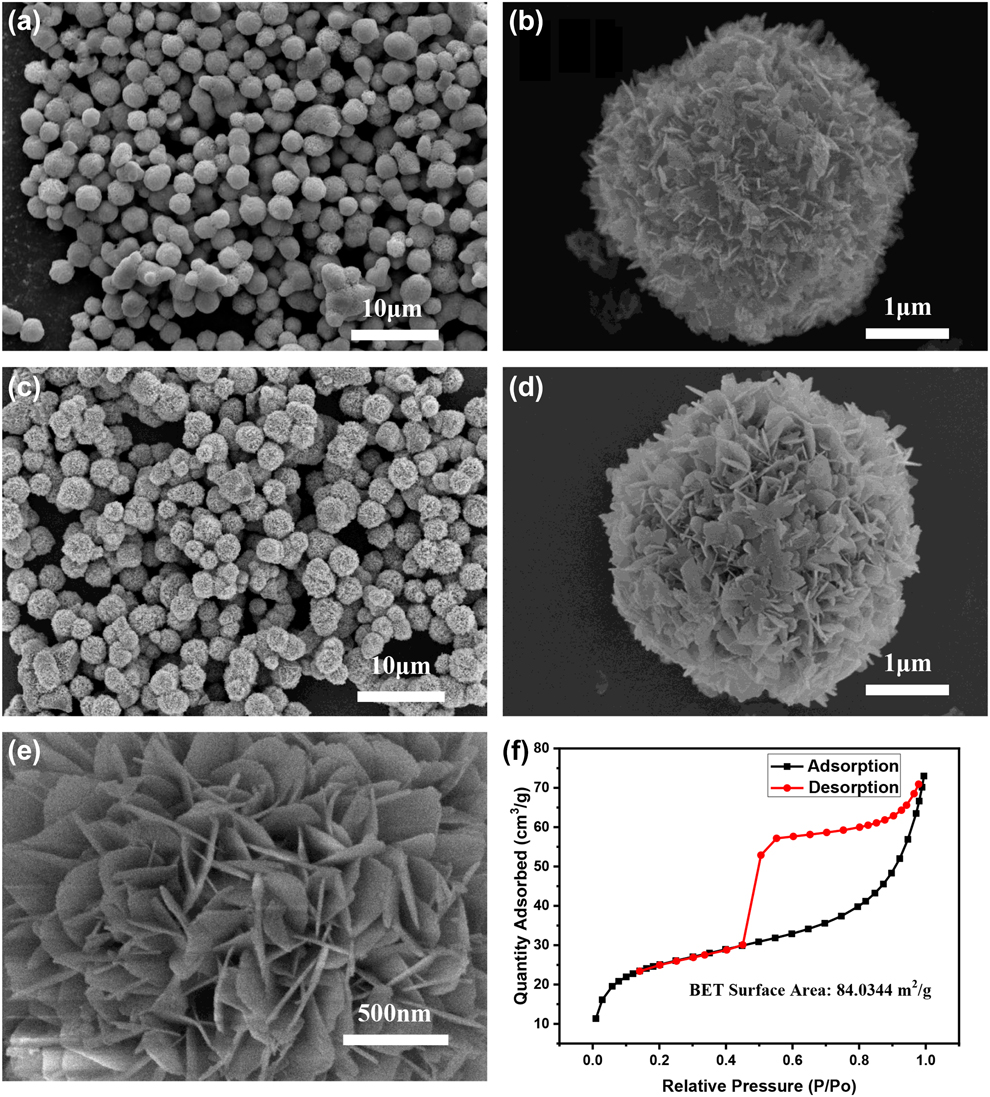
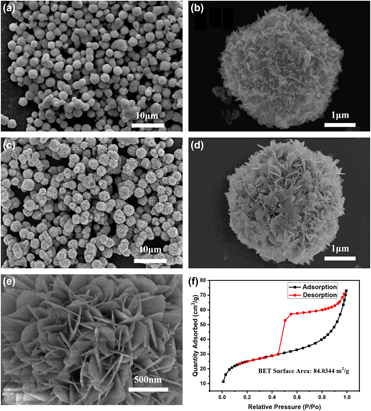
The morphologies of as-prepared pure SnO2 products were characterized by the field-emission scanning electron microscopy (FESEM) and shown in Figs. 2(a)–2(e). As shown in Figs. 2(a)–2(d), a number of flower-like structures with the average diameter of around 3 μm were uniformly distributed and no other kind of morphologies were detected, indicating a high yield of this 3D nanostructure. An enlarged magnified FESEM image was shown in Fig. 2(e), and the hierarchical flower-like SnO2 architectures self-assembled by a bunch of well-defined nanosheets could be observed, of which the lengths and the thicknesses of nanosheets could be roughly estimated at around 300–500 nm and several tens nm (around 10–30 nm), respectively.
SEM images of samples prepared by using the hydrothermal method without (a, b) and with (c, d) the calcination treatment; (e) the enlarged image of the local area of (d); (f) Nitrogen adsorption--desorption measurement isotherm of hydrothermal products without the calcination treatment.

The surface area and porosity of the hierarchical SnO2 nanoflowers were characterized by means of Brunauer–Emmett–Teller (BET) analysis of nitrogen adsorption and desorption isotherm. It was shown in Fig. 2(f) that the shape of BET curve belonged to Type IV isotherm in accordance with IUPAC classification scheme [Reference Sing, Everett, Haul, Moscou, Pierotti, Rouquérol and Siemineiewska39], and the characteristic features of the Type IV isotherm were its hysteresis loop that was associated with capillary condensation taking place in mesopores and the limiting uptake over a range of high pressure [Reference Sing, Everett, Haul, Moscou, Pierotti, Rouquérol and Siemineiewska39]. As shown in Fig. 2(f), a distinct hysteresis loop could be observed between adsorption and desorption branch, and the shapes of hysteresis loops were reported to be closely related with specific pore structures [Reference Sing, Everett, Haul, Moscou, Pierotti, Rouquérol and Siemineiewska39]. In this case, the hysteresis loop of the measured BET curves had the characteristics of both Type H2 and H3 defined in Ref. Reference Sing, Everett, Haul, Moscou, Pierotti, Rouquérol and Siemineiewska39, which was observed frequently in many porous adsorbents with aggregates of plate-like particles [i.e., nanosheets assembling to be nanoflowers as shown in Fig. 2(e)], giving rise to slit-shaped pores. In other words, the measured Type IV isotherm with a hysteresis loop indicated a hierarchical nature of SnO2 nanoflowers. It was worth addressing that the measured BET-specific surface area was about 84 m2/g, which was at least two times higher than previously reported results of other 3D SnO2 hierarchical structures reported in Refs. Reference Li, Zeng, Long and Wang40 and Reference Liu, Jiao, Zhang, Qu, Umar and Wu41.
On the basis of the abovementioned results, the possible chemical reactions of the formation of the SnO2 flower-like architecture were shown as follows. The Sn2+ and OH− ions were supplied by SnCl2 and NaOH and the precursor Sn(OH)2 formed under the hydrothermal reactions (1), and then the Sn3O4 nanocrystals could form as described in reaction (2). Finally, SnO2 were obtained by calcination at 500 °C for hours according to the reaction (3).
 $${\rm{S}}{{\rm{n}}^{2 + }} + 2{\rm{O}}{{\rm{H}}^ - } \to {\rm{Sn}}{\left( {{\rm{OH}}} \right)_2}\quad ,$$
 $$3{\rm{Sn}}{\left( {{\rm{OH}}} \right)_2} + {{\rm{O}}_2} \to {\rm{S}}{{\rm{n}}_3}{{\rm{O}}_4} + 3{{\rm{H}}_2}{\rm{O}}\quad ,$$
 $${\rm{S}}{{\rm{n}}_3}{{\rm{O}}_4} + {{\rm{O}}_2} \to 3{\rm{Sn}}{{\rm{O}}_2}\quad .$$
Because of the chelation between sodium citrate and Sn2+ ions, it was the possibility that Sn2+ ions were precipitated into Sn(OH)2 when Na3C6H5O7 was introduced into the SnCl2 solution [Reference Zeng, Zhang, Li, Chen and Wang42]. Afterward, SnO2 nanocrystals nuclearized and self-assembled to Sn3O4 nanosheets at high temperature and under high pressure of the hydrothermal conditions. Finally, the Sn3O4 hierarchical nanoflowers were synthesized through nanosheet aggregations. It was worth addressing that the ethanol as a chelating agent played a key role to determine the final morphology of the hierarchical architectures. At the beginning, the nanosheets might grow in random orientations because of the random nucleation in different directions, but by the help of the ethanol that could bond easily to Sn2+ to form a relatively stable compound in the solvent and hinder the random growth of the nanosheets, the flower-like hierarchical structure could be finally formed.
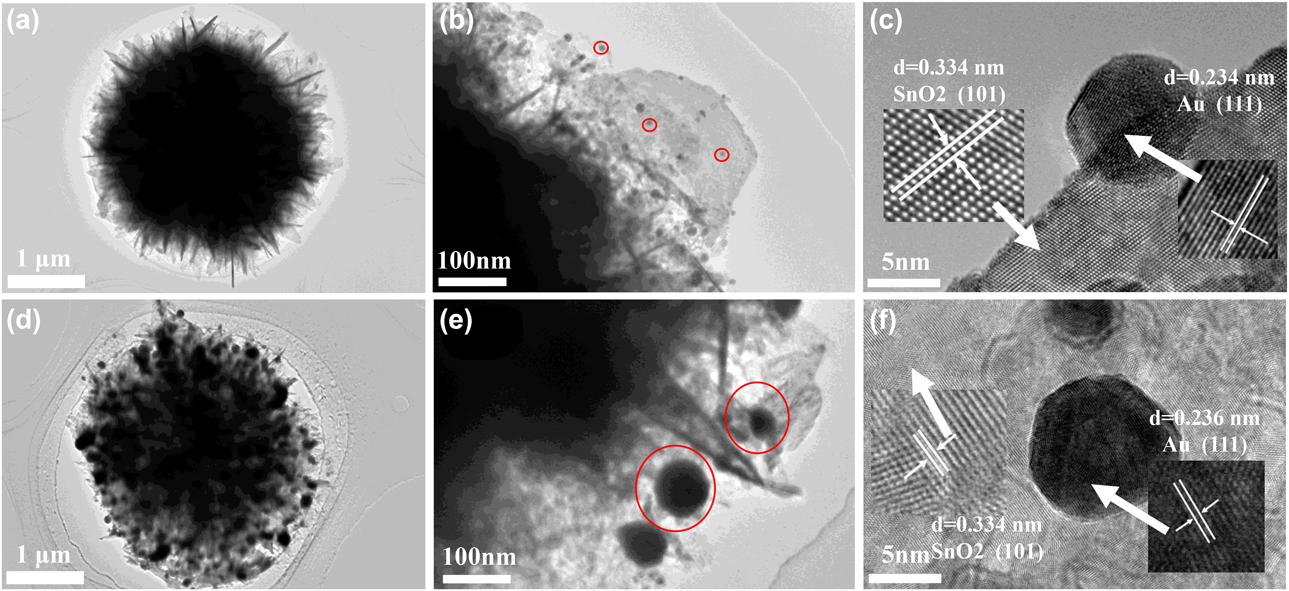
A further detailed structural analysis for the Au-loaded SnO2 samples was carried out using field-emission transmission electron microscopy (TEM) and high-resolution TEM (HRTEM). A typical TEM image shown in Fig. 3(a) revealed an individual flower-like SnO2 nanostructure, which was a hierarchical sphere with a diameter of around 3 μm that was almost the same as that of the pure SnO2 [compared with Fig. 3(d)]. In Fig. 3(a), the dark region in the middle came from the stacking of the numerous nanosheets that constructed nanoflowers. The bright brim illustrated the characteristic of the top of nanosheets. Figure 3(b) showed an enlarged TEM image of the edge of Au-SR-SnO2 sphere shown in Fig. 3(a). As seen in Fig. 3(b), the Au nanoparticles (marked by red circles) with the size of about 10 nm were distributed at the SnO2 sheets without serious aggregation. As seen in Fig. 3(c), the selected area electron diffraction (SAED) images showed that the fringe spacing was around 0.334 nm corresponding to (101) facet (left inset) of SnO2 (JCPDS Card No. 41-1445) and 0.234 nm corresponding to (111) facet (right inset) of Au (JCPDS Card No. 04-0784), respectively. In addition, pretty good crystallinity was confirmed for Au nanoparticles. Figures 3(d)–3(f) showed the TEM and HRTEM images for Au–SnO2 prepared with the conventional method. A large number of black particles (marked also by red circles) could also be observed on SnO2 nanoflowers in Fig. 3(e), which were also confirmed to be Au by SAED as shown in right inset of Fig. 3(f). Compared with Au-SR-SnO2, Au nanoparticles with significantly increased particle size of around 40–90 nm could be observed in Fig. 3(e), indicating that a certain degree of aggregation of Au nanoparticles happened. Hence, this showed that the self-reductive synthesis method used in this manuscript showed advantages in not only simplifying the synthesis process but also controlling the nanoparticle size and to some extent inhibiting the aggregation of Au nanoparticles over the conventional method.
TEM images (a, b) and HRTEM image (c) of Au–SR–SnO2; TEM images (d, e) and HRTEM image (f) of Au–SnO2.

Sensing properties to ethanol
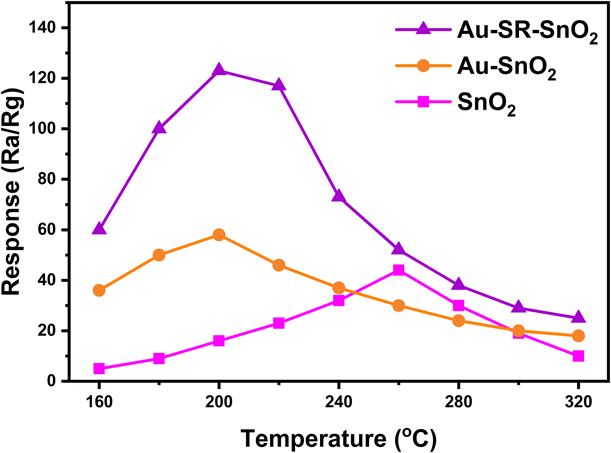
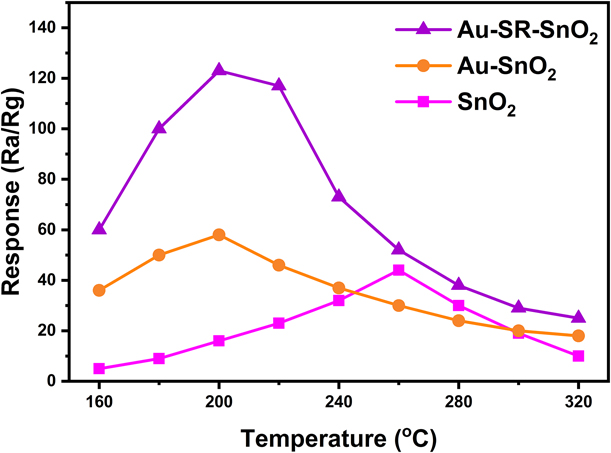
To determine the optimal operating temperature, gas responses to ethanol at 100 ppm for all sensors made of Au-SR-SnO2, Au–SnO2, and SnO2 were examined at different operating temperatures ranging from 160 °C to 320 °C, as shown in Fig. 4. Here, the response of the sensor was defined by R a/R g, where R a and R g were the electrical resistances measured in air and in the test gas, respectively. As seen in Fig. 5, upon increasing temperatures, the gas responses for all sensors increased first and reached the maximum at the optimal temperatures, and then decreased gradually. The temperature dependent of the gas response could be understood as follows: at low temperatures, the inadequate chemical activation led to an inert response. Upon increasing temperatures, on the one hand, the reactive activity increased, and on the other hand, the absorbed gas molecules began to escape more and more heavily. Thus, as a result of the competition of the abovementioned two processes, an optimal operating temperature appeared. Furthermore, the profound enhancement of the gas-sensing performance in two aspects was achieved by the decoration of Au nanoparticles. First, as seen in Fig. 4, the Au-SR-SnO2 sensor displayed the most excellent response of around 123. This behavior was probably ascribed to the fact that the formation of the Schottky barrier between SnO2 and Au nanoparticles resulted in forming an electron depletion layer near the surface of the SnO2 that eventually improved the gas response. As for Au–SnO2, it did not present such a high response as shown in Fig. 4, which could be attributed to the much larger Au particle size induced by the particle aggregations. Second, the optimal operating temperature decreased significantly from 260 °C for SnO2 to 200 °C for Au-loaded SnO2. This could be ascribed to the fact that the incorporation between Au nanoparticles and the surface of SnO2 resulted in a reduction in the energy barrier and then an enhancement in the surface activity. Hence, both the activation energy and the operating temperature were reduced. On the basis of the results obtained in Fig. 4, the optimum operating temperatures were selected for each sensor to further study gas-sensing properties hereafter.
The temperature dependence of response of Au–SR–SnO2, Au–SnO2, and pure SnO2 sensors.
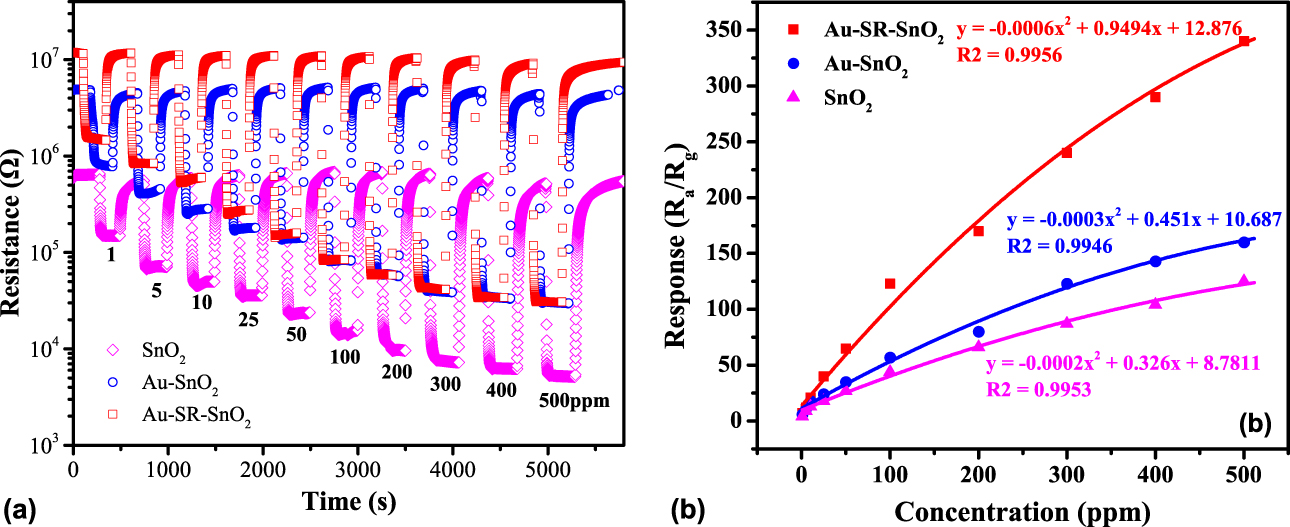
(a) The time dependence of resistance and (b) the ethanol concentration dependent of response for Au–SR–SnO2, Au–SnO2, and pure SnO2 sensors.
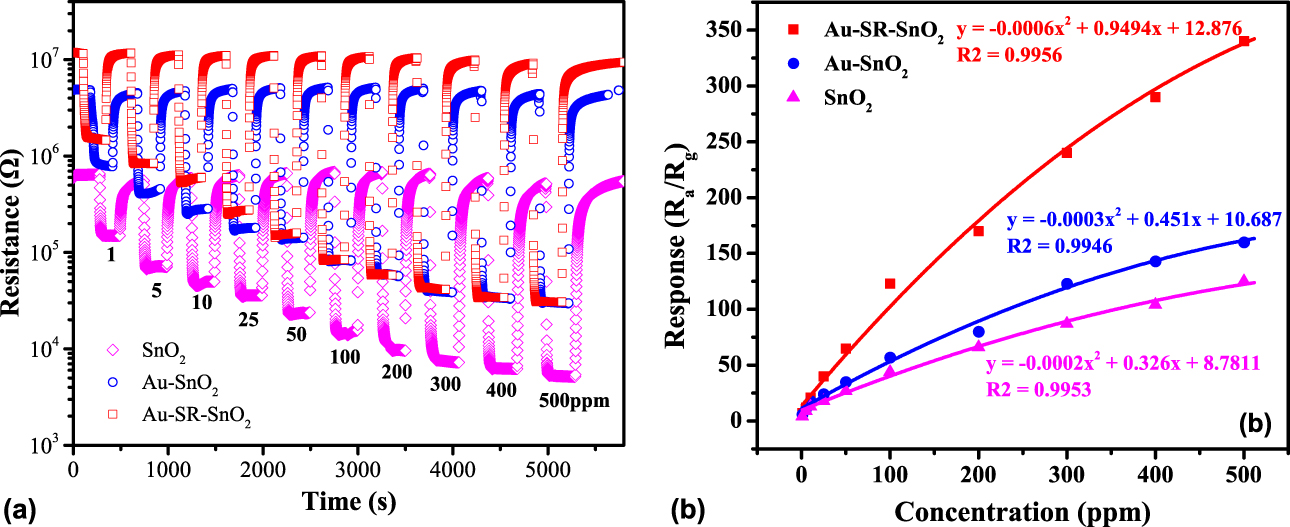
The dynamic response recovery at their optimum operating temperatures for the Au-SR-SnO2, the Au–SnO2, and pure SnO2 gas sensors wsa depicted in Fig. 5(a). As a whole, the response and the recovery curves were considerably sharp; in other words, the responses increased or decreased very quickly while the testing gas was pumping in or out. The dependence of responses on ethanol concentrations are shown in Fig. 5(b). Upon increasing concentrations of ethanol, the responses also showed a remarkable increase, and the responses of the Au-SR-SnO2 sensor increased evidently faster than that of pure SnO2 and the Au–SnO2 sensors, indicating that all sensors showed excellent selectivity to variation of the gas concentrations and the introduction of Au nanoparticles effectively improved the gas response and selectivity. Moreover, a pretty good response and the recovery characteristic curves could still be achieved with reducing the ethanol concentration down to 1 ppm. The responses did not reach the saturation for both Au-SR-SnO2 and Au–SnO2 sensors up to 500 ppm. This meant that all SnO2, Au–SnO2 and Au–SR–SnO2 sensors could present good responses in a considerably wide ethanol concentration range from 1 to more than 500 ppm. In detail, at the ethanol levels of 100, 200, and 300 ppm the response values were about 44, 66, and 87 for pure SnO2 sensor, respectively. The gas-sensing performances were significantly enhanced for the Au-loaded SnO2 nanoflowers, i.e., 123, 170, and 240 at the ethanol levels of 100, 200, and 300 ppm for Au–SR–SnO2, respectively. It improved by nearly 3 times. Compared with Au–SR–SnO2, an improvement in response to ethanol for Au–SnO2 could also be approved, but it was much smaller than that of Au–SR–SnO2, indicating that Au–SR–SnO2 had an advantage over Au–SnO2 in response and sensitivity. The superior gas-sensing performances of Au–SR–SnO2 could be attributed to its particular Au nanoparticles decorated 2D sheet-like nanostructures, which could shorten the gas diffusion distance and provide highly accessible open channels and active surfaces for the detected gas [Reference Wen, Wu and Wang43].
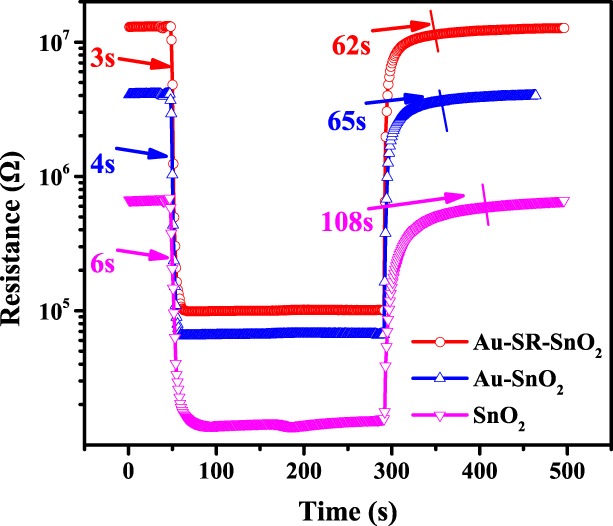
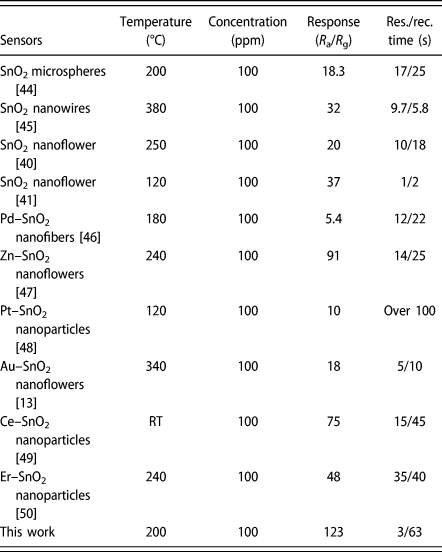
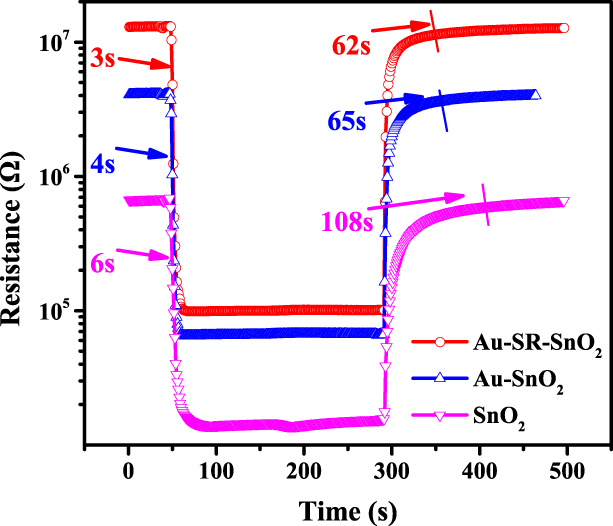
To further investigate the sensing performances, the response/recover transients toward 10 ppm ethanol measured at the optimal operating temperature are shown in Fig. 6. It was seen that the resistance descended quickly and sharply as soon as the sensor was exposed to ethanol and the response time was about 3 s for Au–SR–SnO2, which was around 1 s faster than that of Au–SnO2 and 3 s faster than that of pure SnO2 sample. Then, the resistance gradually changed and reached a steady value, which was probably due to the gradual occupations of the remaining reactive sites at surface through gas diffusion. Afterward, the sensors were taken out from ethanol to determine the recovery time and it was around 62 s, 65 s, and 108 s for the Au–SR–SnO2, the Au–SnO2, and pure SnO2 samples, respectively. This indicated that with loading Au nanoparticles both the response and the recovery times decreased effectively, which could be related to the chemical sensitization of Au nanoparticles that accelerate charge transfer near the surface. Furthermore, some data of gas-sensing performances for SnO2-related sensors gathered from literatures and this work were tabulated in Table I. The Au–SR–SnO2 sensor presented excellent ethanol-sensing performances among all sensors shown in Table I. In addition, we could notice that the recovery time in this work was a little bit longer than most of the gas sensors. This was partially attributed to the shortcoming of the gas-sensing test setup used in this work. In this work, the measured recovery time included the extra time for pumping ethanol out of the chamber, resulting in the much longer recovery time than the actual value that it was. The improvement of the setup to solve this problem is ongoing. Taken the excellent gas-sensing performance in response and sensitivity into account, Au–SR–SnO2 could be regarded as a promising candidate material for ethanol sensor although the working temperature and the recovery time need to be further optimized.
Dynamic sensing transient response and recovery of Au–SR–SnO2, Au–SnO2, and SnO2 sensors measured at 100 ppm ethanol.
The SnO2-based ethanol sensors reported before and synthesized in this work.

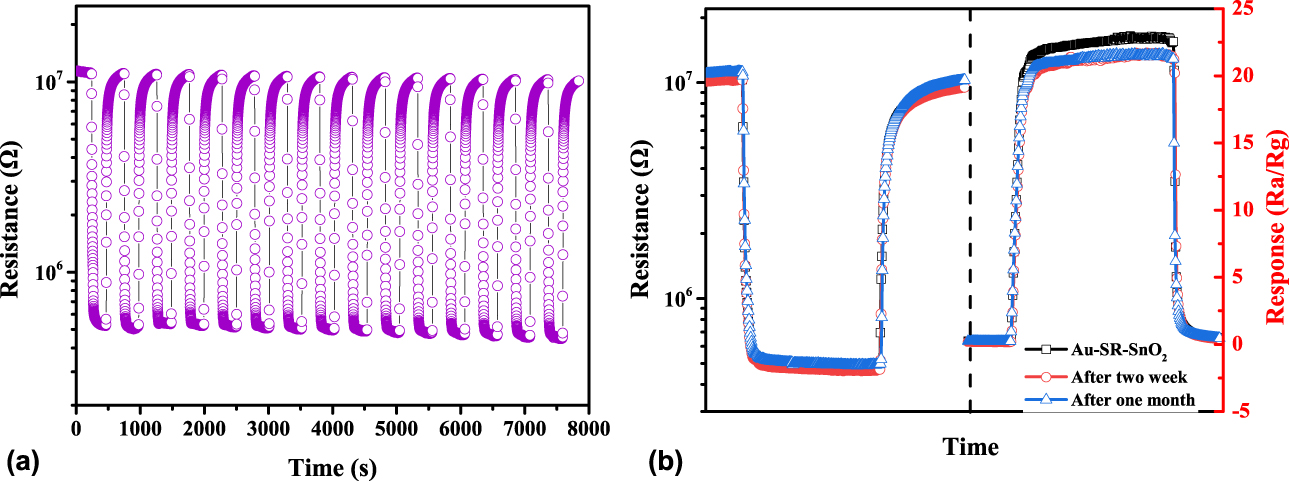
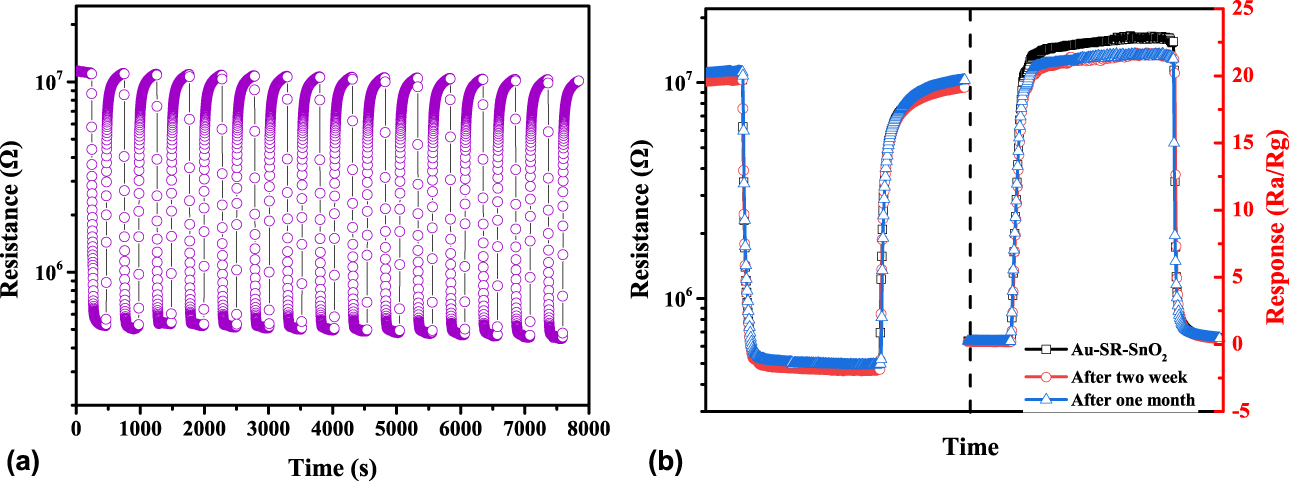
To check the repeatability of the gas sensing, a continuous multiple-cyclic test was carried out at 100 ppm ethanol for the Au-SR-SnO2 sensor and the results were shown in Fig. 7(a). After rough observation, the fifteen cycles were reversible and almost identical, indicating a good repeatability in gas sensing. To quantify its repeatability, the standard deviation was calculated by using R a and R g data from Fig. 7(a). The arithmetic mean and standard deviation of the response were around 21.65 and 0.80, respectively. Only a very small dispersion of responses was obtained, indicating that the repeatability of the gas-sensing responses to ethanol of Au-SR-SnO2 sensor was pretty good. Moreover, as shown in Fig. 7(b), after 14-days and 30-days aging treatments the response and recovery curves barely showed any changes from the as-prepared one, presenting an excellent long-term stability for the Au-SR-SnO2 sensor.
(a) Repeatability and (b) long-term stability of Au–SR–SnO2 to 10 ppm ethanol.
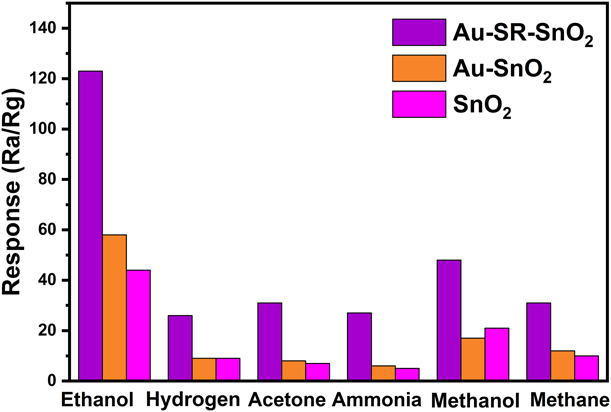
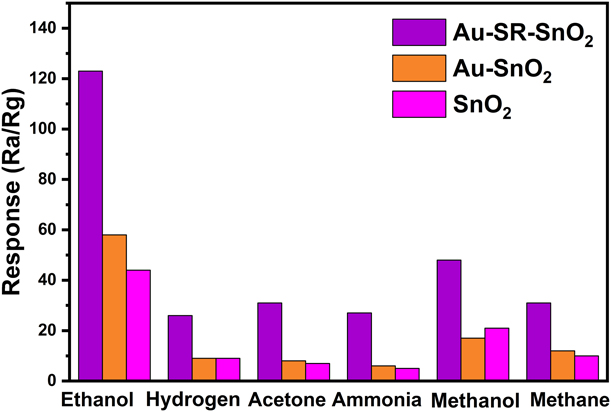
Finally, six kinds of gases, i.e., ethanol, methanol, acetone, ammonia, hydrogen, and methane, were chosen to test the gas selectivity for Au-SR-SnO2, Au–SnO2 and pure SnO2 sensors and the experiments were carried out at 100 ppm for all kinds of gasses. As shown in Fig. 8, for all kinds of gasses, the Au–SR–SnO2 sensor obviously showed the highest response in all three sensors and optimal selectivity of ethanol, indicating that the Au-SR-SnO2 sensor had much better gas-sensing performances and selectivity than Au–SnO2 and pure SnO2 sensors. Besides, the Au–SnO2 sensor did not show better gas-sensing performances than the pure SnO2 one for all kinds of gasses but ethanol. Hence, to some extent, we could draw a conclusion that the Au–SR–SnO2 sensor prepared by using the self-reductive method developed in this work was much better than that of Au–SnO2 synthesized by the conventional technique, interpret ting that the self-reductive technique could effectively improve the gas-sensing properties and simplify the synthesis process somewhat.
Selectivity of Au–SR–SnO2, Au–SnO2, and pure SnO2 sensors to 100 ppm ethanol, hydrogen, acetone, ammonia, methanol, and methane.
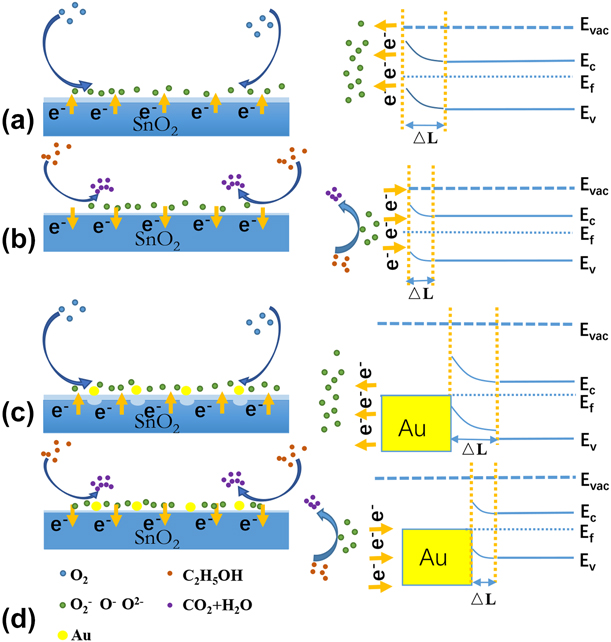
The sensor produced in this experiment was a surface-resistance gas sensor, and the sensing performance came from the resistance change induced by the gas adsorbed on the surface of the material and the gas-sensing mechanism was schematically shown in Fig. 9. Tin dioxide is an n-type semiconductor and carriers are free electrons. When the sensor is exposed to air, the semiconductor surface undergoes a series of reactions with adsorbed (ads) oxygen.
 $${{\rm{O}}_2}\left( {{\rm{gas}}} \right) \to {{\rm{O}}_2}\left( {{\rm{ads}}} \right)\quad ,$$
 $${{\rm{O}}_2}\left( {{\rm{ads}}} \right) + {{\rm{e}}^ - } \to {{\rm{O}}_2}^ - \left( {{\rm{ads}}} \right)\;\left( {T \lt 100\;^\circ {\rm{C}}} \right)\quad ,$$
 $${{\rm{O}}_2}^ - \left( {{\rm{ads}}} \right) + {{\rm{e}}^ - } \to 2{{\rm{O}}^ - }\left( {{\rm{ads}}} \right)\;\left( {100\;^\circ {\rm{C \lt }}T \lt 300\;^\circ {\rm{C}}} \right)\quad ,$$
 $${{\rm{O}}^ - }\left( {{\rm{ads}}} \right) + {{\rm{e}}^ - } \to {{\rm{O}}^{2 - }}\left( {{\rm{ads}}} \right)\;\left( {T > 300\;^\circ {\rm{C}}} \right)\quad .$$
The schematic of the gas-sensing mechanism, (a) O2 (ads) captures electrons from the surface of SnO2 and a depletion layer forms near the SnO2 surface, (b) the sensor contacts with reductive ethanol gas and the depletion layer becomes thinner, (c) the formation of the Schottky barrier induced by the contact between Au and SnO2, and (d) the enhanced gas-sensing properties due to the chemical sensitization of Au nanoparticles and the formation of the Schottky barrier.
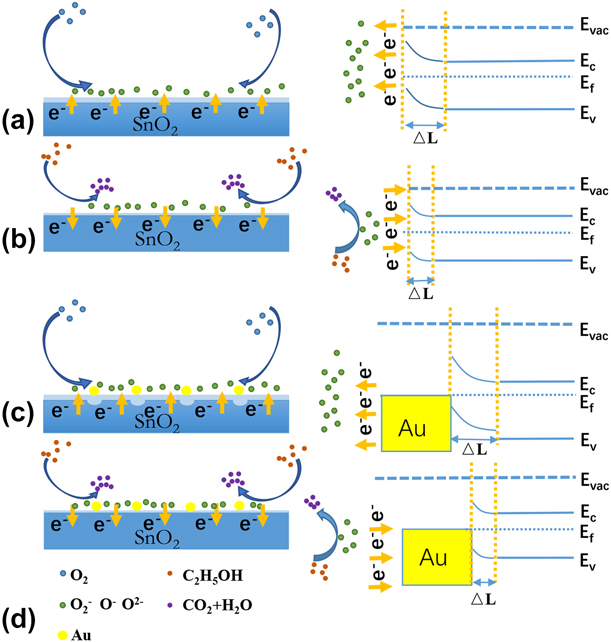
Since the electron affinity of O2 is greater than that of SnO2, O2 (ads) captured electrons from the surface of SnO2 and produced O2− (ads) at the appropriate temperature, as shown in Eq. (5). As a result of the electron loss, a depletion layer formed near the SnO2 surface and the resistance increased. As shown in Fig. 9(a), once the sensor contacted with reductive ethanol gas, ethanol reacted with O−(ads), and O−(ads) released electrons. Thus, the depletion layer became thinner and the resistance decreased again [as shown in Fig. 9(b)] [Reference Wang, Fei, Lou and Zhang51].
 $${{\rm{C}}_2}{{\rm{H}}_5}{\rm{OH}}\left( {{\rm{ads}}} \right) + {{\rm{O}}^ - }\left( {{\rm{ads}}} \right) \to {\rm{C}}{{\rm{H}}_{\rm{3}}}{\rm{CHO}} + {{\rm{H}}_{\rm{2}}}{\rm{O}} + {{\rm{O}}^ - }\quad ,$$
 $${\rm{C}}{{\rm{H}}_3}{\rm{CHO}}\left( {{\rm{ads}}} \right) + 5{{\rm{O}}^ - } \to 2{\rm{C}}{{\rm{O}}_2} + 2{{\rm{H}}_{\rm{2}}}{\rm{O}} + 5{{\rm{e}}^ - }\quad .$$
Compared with the pure SnO2 sensor, the Au nanoparticle decoration enhanced gas-sensing properties of SnO2 mainly in two aspects. As shown in Figs. 9(c) and 9(d), first, it was ascribed to the chemical sensitization of noble metals, which activated the oxidation of gas molecules on the surface of semiconductors, enhanced the chemical reaction rate, and then improved the gas-sensing performance. Second, the metal (Au) –semiconductor (SnO2) contact resulted in the formation of the Schottky barrier at the interface and a depletion layer near the surface of SnO2, leading to an increase in resistance [Reference Zhang and Yates52, Reference Das and Jayaraman53]. This was verified by our experimental results shown in Fig. 6, the resistances of Au–SR–SnO2 and Au–SnO2 sensors were both much higher (almost an order of magnitude) than that of pure SnO2 one. Hence, a remarkable enhancement in resistance change could be expected when the ethanol molecule reacted with O− (ads) at the surface of SnO2, and this could directly strengthen the response and the sensitivity.
Conclusions
In summary, the hierarchical undoped and Au-doped SnO2 nanoflowers were synthesized by using a simple hydrothermal method. The results of characterization indicated that the hierarchical SnO2 nanoflowers were assembled from low-dimensional nanosheets. A significantly enhanced response to ethanol for the hierarchical Au-doped SnO2 nanoflowers was approved compared with their unloaded counterpart. Furthermore, a new developed self-reductive method was used to synthetize Au nanoparticles and disperse them to SnO2 nanoflowers. Compared with the traditional method that used NaBH4 for reduction, Au nanoparticles with smaller size and better dispersibility could be obtained by using the self-reductive method reported by this work. Reasonably, a much more significant enhancement of the gas-sensing performances for the Au–SR–SnO2 sensor could be achieved, of which the chemical sensitization of noble metals and the Schottky barrier at the metal–semiconductor interface were considered to be responsible for the enhanced gas-sensing properties.
Materials and methods
Materials
All chemical reagents, including SnCl2·2H2O, Na3C6H5O7·2H2O, NaOH, and ethanol were of analytical grade and used as-received without any further purification. Deionized (DI) water (resistance higher than 18.2 MΩ cm) was used in this work.
Synthesis of SnO2 and Au-loaded nanoflowers
The SnO2 nanoflowers were synthesized by using a hydrothermal method. In a typical synthesis process, 5 mmol SnCl2·2H2O and 10 mmol Na3C6H5O7·2H2O were dissolved in 20 mL ethanol and 20 mL DI water under stirring, respectively. Then, 0.15 g NaOH was added into aqueous solution. After stirring for about 15 min, the ethanol solution was added into the aqueous solution dropwise with vigorous magnetically stirring for around 1 h. Afterward, the mixture was loaded into a 50 mL Teflon-lined stainless autoclave, which was sealed and heated to 180 °C for 12 h. The autoclave was naturally cooled to room temperature. The obtained precipitate was centrifuged and washed with ethanol and deionized water sequentially. Finally, the samples were drying at 70 °C in air.
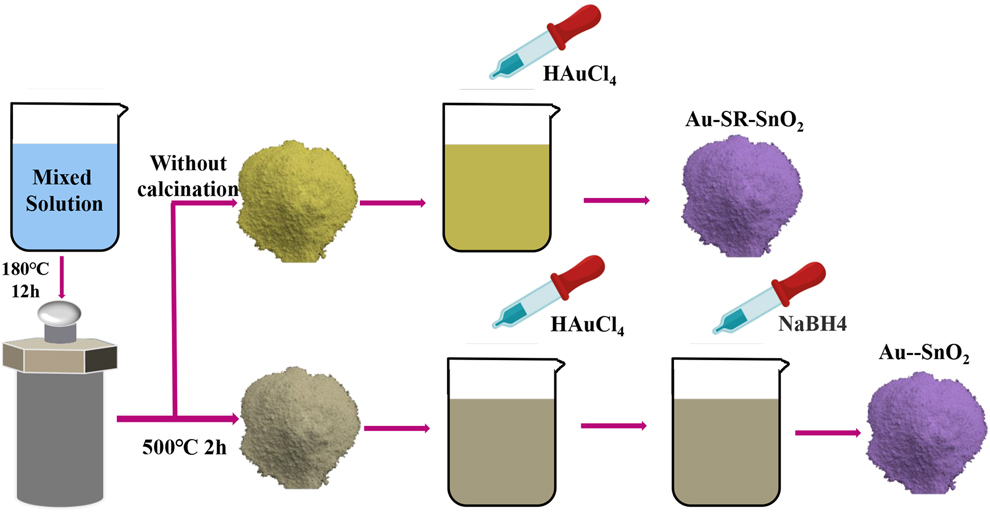
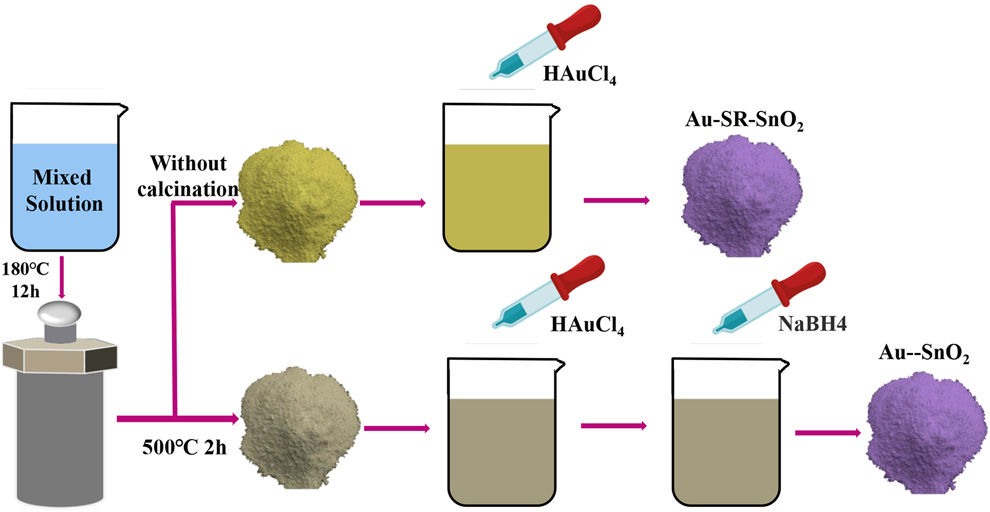
In this work, the Au–SR–SnO2 composite were synthesized with a self-reductive method. Without calcination employed by the conventional method [Reference Guo, Zhang, Gong, Ju and Cao13], the as-prepared hydrothermal products were directly impregnated into 20-mL DI water. An appropriate amount of HAuCl4 solution (with the atomic ratios of Au over SnO2 by 1%) was mixed with the above solution under vigorous stirring for 30 min. After stirring, the obtained solution was removed using vacuum filtration and dried at 70 °C. Finally, the products were subsequently annealed at 500 °C for 2 h in a muffle furnace.
By comparison, the Au–SnO2 nanoflowers were prepared by using the conventional method reported by the literatures [Reference Guo, Zhang, Gong, Ju and Cao13]. First, a similar hydrothermal method was applied to synthesize the SnO2 nanoflowers, but a calcination was needed and performed in a muffle furnace at 500 °C for 2 h that was carried out right after the hydrothermal process. After that, the value of Au content (around 1 at.%) was estimated by calculating the molar ratio of Au over SnO2. The as-prepared SnO2 products were dispersed in 20 mL of HAuCl4 aqueous solution under incessantly stirring. Then, the mixed solution was subsequently prepared by adding NaBH4 solution (0.1 M) dropwise into the above aqueous solution under vigorous stirring. After stirring, the precipitate was collected by centrifugation, washed with absolute ethanol and DI water sequentially, and then dried at 70 °C. Finally, the Au–SnO2 products were obtained after annealing at 500 °C for 2 h in a muffle furnace. A brief route diagram for the two synthesis methods is shown in Fig. 10.
Schematic route diagram for the self-reductive and the conventional hydrothermal methods.
Characterizations and gas-sensing measurement
The crystal structures of the as-prepared samples were characterized by XRD (Shimadzu XRD-7000, Shimadzu, Kyoto, Japan) using Cu Kα radiation with λ = 1.5045 Å, employing a θ–2θ scan in a 2θ range from 20° to 80° operated at 40 kV and 30 mA. The morphologies and microstructures were characterized with FESEM (Hitachi S4800, operated at an accelerating voltage of 15 kV; Hitachi, Tokyo, Japan), TEM/SAED (FEI Tecnai G2 F30, operated at 200 kV; FEI, Hillsborough, Oregon), and HRTEM, respectively.
The fabrication of the gas sensors and gas-sensing measurements were carried out as follows. The as-prepared sensing materials were mixed with ethanol to form a homogeneous paste, which was coated onto a ceramic tube. Pt wires were connected at the ceramic tube as electrodes. To improve their stability and repeatability, the gas sensors were aged at 300 °C for 36 h in air heated by a Ni–Cr wire that was inserted into the ceramic tube. The gas-sensing properties were investigated by using a self-developed dynamic gas-sensing characterization system. During the whole test procedure, a constant flow rate of 200 sccm was maintained and the gas composition was controlled by tuning the gas ratio between air and the target gas. A heating voltage was applied by a Keithley 2636B Digital Source-Meter (Tektronix, Beaverton, Oregon) and the electrical resistances were measured using an Agilent 34401a digital multimeter (Agilent, Palo Alto, California). Thus, the response of the sensor defined as R a/R g could be obtained. The sensor response time and recovery time were defined as the time taken by the sensor to reach 90% of the total resistance change in the case of adsorption and desorption, respectively.
Acknowledgments
This work was financially supported by National Natural Science Foundation of China (11774017), the National Key Research and Development Program of China (2018YFB0703500), and Beijing Municipal High Level Innovative Team Building Program (IDHT20170502).