Introduction
Most of the ecological studies of fish assemblages that address geographic distributions, diversity, biomass and abundance in European Continental (Atlantic) waters have been based on trawl surveys. However, these surveys do not usually cover strata deeper than 600 m (ICES, 2018), and few are specifically designed for sampling deep-water species (Massutı & Moranta, Reference Lucio, Diez, Iriondo, Santurtún, Prellezo, Artetxe and Quincoces2003; Neat et al., Reference Mugerza, Díez and Artetxe2015). In many areas, such as the Iberian continental shelf, trawling is not suitable, either due to the rocky bottoms, because they can affect protected areas and coral reefs, or because trawling is forbidden.
The Basque continental shelf (ICES Division 8c east) is characterized by its narrowness and rocky bottom. Beyond the 200 m depth there is a steep slope with submarine canyons often obliquely oriented to the shelf (Pascual et al., Reference Neat, Burns, Jones and Blasdale2004). These canyons can reach a depth of 2500–3000 m and connect to the Biscay Abyssal Plain below 4500 m in depth. Therefore, this area is considered inappropriate to conduct scientific trawling surveys, thus leading to the consideration that longline is the most appropriate gear to be used (Menezes & Sigler, Reference Massutı and Moranta2016). One of the key benefits of longline is that it is a very efficient fishing gear for fish sampling, and it allows quantification of the catch and fishing effort in a replicable manner. In this sense, successful longline surveys to assess the abundance and biodiversity of several demersal and deep-water fish species have been carried out in the Canary Islands, North-east Atlantic seamounts, Alaska, Greenland, Madeira and Azores (Connolly & Kelly, Reference Connolly and Kelly1996; Uiblein et al., 1996; Simonsen et al., Reference Santos, Silva, Novoa-Pabon, Silva and Pinho2000; Clarke & Moore, Reference Clarke and Moore2002; ICES, 2005, 2008; Menezes et al., Reference Menezes, Sigler, Clark and Rowden2006, Reference Menezes, Sigler, Silva and Pinho2009, Reference Menezes, Rosa, Melo and Pinho2015; Rodgveller et al., Reference Pascual, Cearreta, Rodríguez-Lazaro and Uriarte2008; Aranha et al., Reference Aranha, Menezes and Pinho2009; Clausen & Rodgveller, Reference Clausen and Rodgveller2013; Christiansen et al., Reference Christiansen, Vieira, Christiansen, Denda, Oliveira and Gonçalves2015; Biscoito et al., Reference Biscoito, Araújo, Henriques, Martins, Sousa, Freitas and Delgado2017; Santos et al., Reference Rodríguez-Cabello, Díez, Pérez and Bañón2019).
The Bay of Biscay has great fish biodiversity, especially of deep-water species, and some of these have been reported for the first time in recent years (Caballero-Alfonso et al., Reference Caballero-Alfonso, López, Díez and Castro2008; Rodríguez-Cabello et al., Reference Rodgveller, Lunsford and Fujioka2012, Reference Rodríguez-Cabello, Arronte, Sánchez and Pérez2013, Reference Rodríguez-Cabello, Pérez and Sánchez2015; Díez & Mugerza, Reference Díez and Mugerza2017). Until 2010, a small bottom longline fleet of 1–2 vessels targeted deep-water sharks along the Cantabrian seas, landing in the Basque Country port of Ondarroa. In 2010, the EU TAC for deep-sea sharks was adopted in the European Community and in international waters, in ICES subareas 5, 6, 7, 8, 9, 10, 12, and since 2013, the list of deep-sea sharks has extended to 15 species (Council regulation (EC) No 1182/2013). In 2015, some of these species were included in the EU prohibited species list in several ICES Divisions (Council regulation (UE) No 2015/104). The adoption of zero TAC for deep-water sharks prevented the assessment of their population status, due to the lack of fishery-independent data and specific surveys designed for deep-water species. Currently, deep-water species are only caught as by-catches of directed and mixed demersal fisheries, and the market for these species is scarce in the region (Lucio et al., 2004).
In 2013, the Scientific, Technical and Economic Committee for Fisheries (STECF, Reference Simonsen, Boje and Kingsley2013) concluded that a ‘long-line survey would be an appropriate method for monitoring the status of some of the species present in areas spanning the 300 to 2100 m isobaths in subareas 8 and 9', and recommended:
(i) the inclusion of measures to minimise the mortality of deep-water sharks and,
(ii) an assessment of the extent to which any mortality of deep-water sharks resulting from this survey will affect their rates of recovery.
Following these recommendations, in 2015 a longline deep-water pilot survey for the assessment of the biomass and abundance of deep-water sharks and other teleost species started in the Basque Country coast (ICES Division 8c east), in one of the canyons that connects the continental shelf of the Basque Country and the Biscay Abyssal Plain from 600 to 2500 m (Diez et al., Reference Diez, Arregi, Basterretxea, Onandia and Mugerza2016).
Based on the conclusions obtained in the pilot survey in 2015 on the suitability of the hauling methodology and the equipment on board, the objective of this work is to analyse the data collected and assess the variations in abundance, biomass, CPUE and diversity of deep-sea shark species in the area described above during the period from 2015 to 2019.
Materials and methods
Data from longline surveys conducted annually on the Basque Coast (ICES Division 8c) between 2015 and 2019 on a commercial longliner were analysed. The experimental design was implemented to estimate and assess the inter-annual variation of the abundance and biomass indices of the deep-water ichthyofauna in the area of study. To get homogeneous and comparable data series, the six hauls were carried out every year in the same position and period, covering depths from 650 to 2400 m. The stratification was based on 400 m intervals following the profile of the canyon valley.
Survey area
The Bay of Biscay is located in the North-east Atlantic Ocean, in waters belonging to Spain and France. Below 4500 m depth, there is an abyssal plain with some submarine mountains that rise up, often aligned in an east–west direction, reaching a height of 2000 m above the abyssal plains. Bordering to the south of the abyssal plain, appears the Basque continental shelf in the eastern section of the northern Iberian Peninsula. On the southern border of the Bay of Biscay, the continental shelf is as narrow as 12 km. The inner shelf is covered by a continuous belt of rocks which constitutes an extension of the continental cliffs. Beyond 200 m in depth, there is a steep slope (10–30%) with submarine canyons, often obliquely oriented to the shelf edge (Pascual et al., Reference Neat, Burns, Jones and Blasdale2004; ICES, 2008).
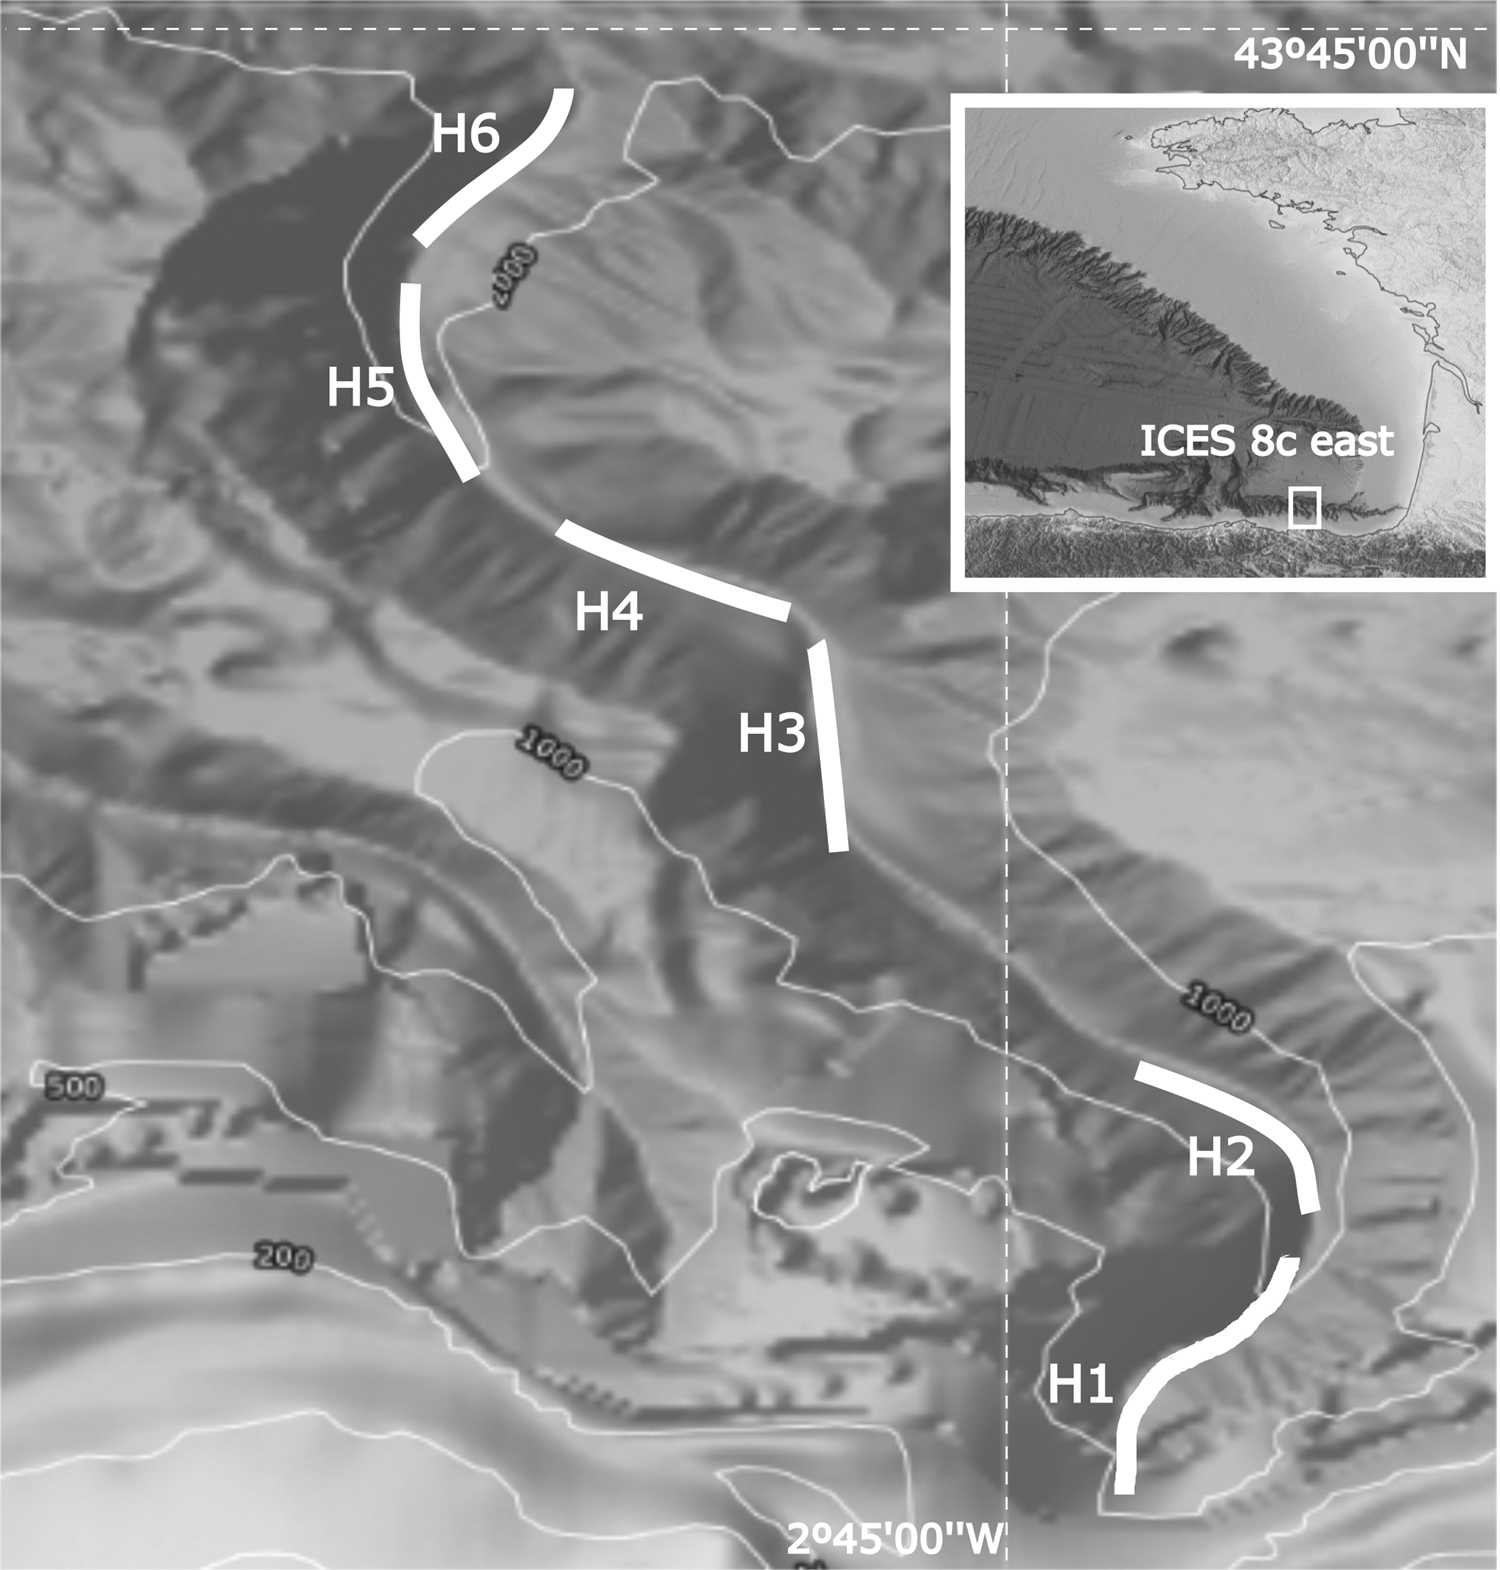
The surveys were conducted annually from 2015 to 2019 between 15 September and 15 October. The sampling stations were located in an area 10.5 km north of Cape Matxitxako in a narrow canyon of about 28 km long that progressively decreases in depth from 500 to 2500 m. The six hauls covered the whole depth range along the canyon valley in four 400 m strata: 650–1050 m, 1051–1450 m, 1451–1850 m and 1851–2250 m (Figure 1).
Bathymetric map showing the position of the six hauls in the Matxitxako Canyon in the south-east of the Bay of Biscay (ICES Division 8c). The correspondence of the hauls with the deep strata is: H1 (650–1050 m); H2 (1051–1450 m); H3 (1451–1850 m); H4 (1451–1850 m); H5 (1851–2250 m); H6 (1851–2250 m).

Fishing gear and fishing operations
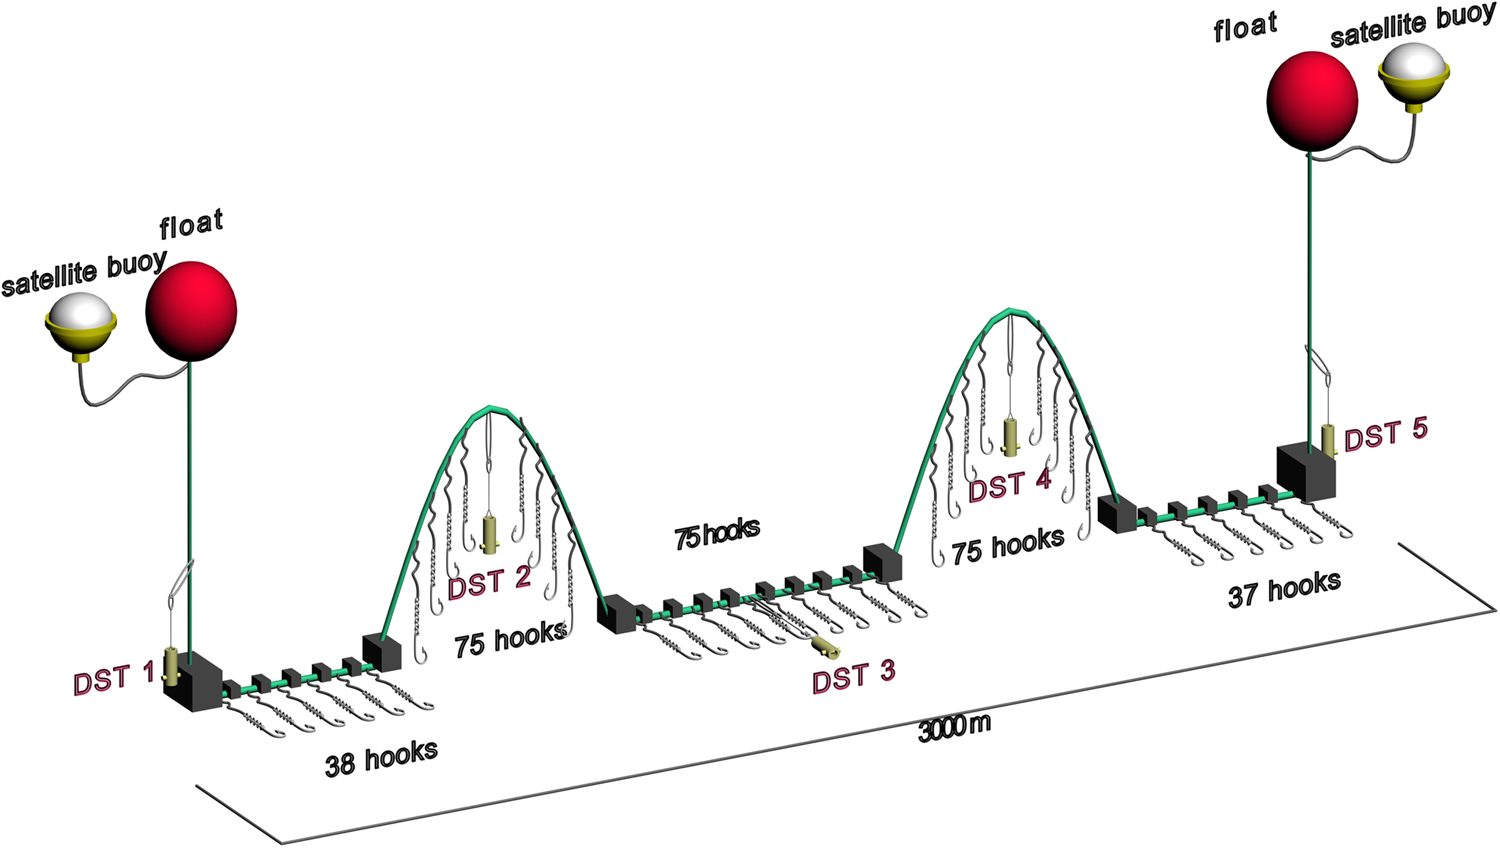
A modified former commercial bottom longline fishing gear, specific for deep-water sharks, was adapted for the survey. The commercial gear used six mother lines with 1800 hooks (Mustad Model 7690-9/0) fishing overnight (soak time = 8–9 h), but in order to minimize the mortality of deep-water sharks in the scientific fishing gear, the number of hooks was reduced to 300, and the soak time was set at 4 h (STECF, Reference Simonsen, Boje and Kingsley2013). The vessel was equipped with a specifically designed device for recovering fishing gear from deep waters at a depth of more than 2500 m. Several modifications to the fishing gear were tested during the 2015 pilot survey, and the final design was a double gear divided into two equal main line sections of 1750 + 1750 m, each with 150 hooks. Each hook was baited with a third of Atlantic mackerel (Scomber scombrus), and the main line was attached to the bottom by means of a 1.5 kg stone for every five hooks. In order to improve the catch efficiency of species that feed above the sea bottom, the stones of the main line were removed, resulting in two floating sections of 75 hooks. Therefore, the fishing gear consisted of 150 hooks in contact with the bottom, and 150 hooks in the floating sections (Figure 2). The fishing gear was linked to the surface by two head ropes (without hooks) and two marker floats, placed at the beginning and end of the main line. For the continuous recording of depth, temperature and salinity, the longline was monitored every 30 s by means of five small DST CTD and DST centi sensors (www.star-oddi.com), able to withstand 2400–3000 m in depth, respectively. Three of these sensor devices were attached to the beginning, mid-point and end of the main rope, and the remaining two at the top of each of the ‘floating’ sections. To locate and monitor the fishing gear after each haul, two satellite buoys (https://zunibal.com/en/product/zunliner-longline-buoy/) were installed in the marker floats. One haul was accomplished per day; starting at 8 a.m. and ending in the evening after recovering the longline and the hauling data collected by the sensors.
Scheme of the final design of the long-line fishing gear used in the pilot survey. The positions of DST 1, 3 and 5 correspond to the main line sections fishing at the bottom, and DST2 and 4 to the floating sections.

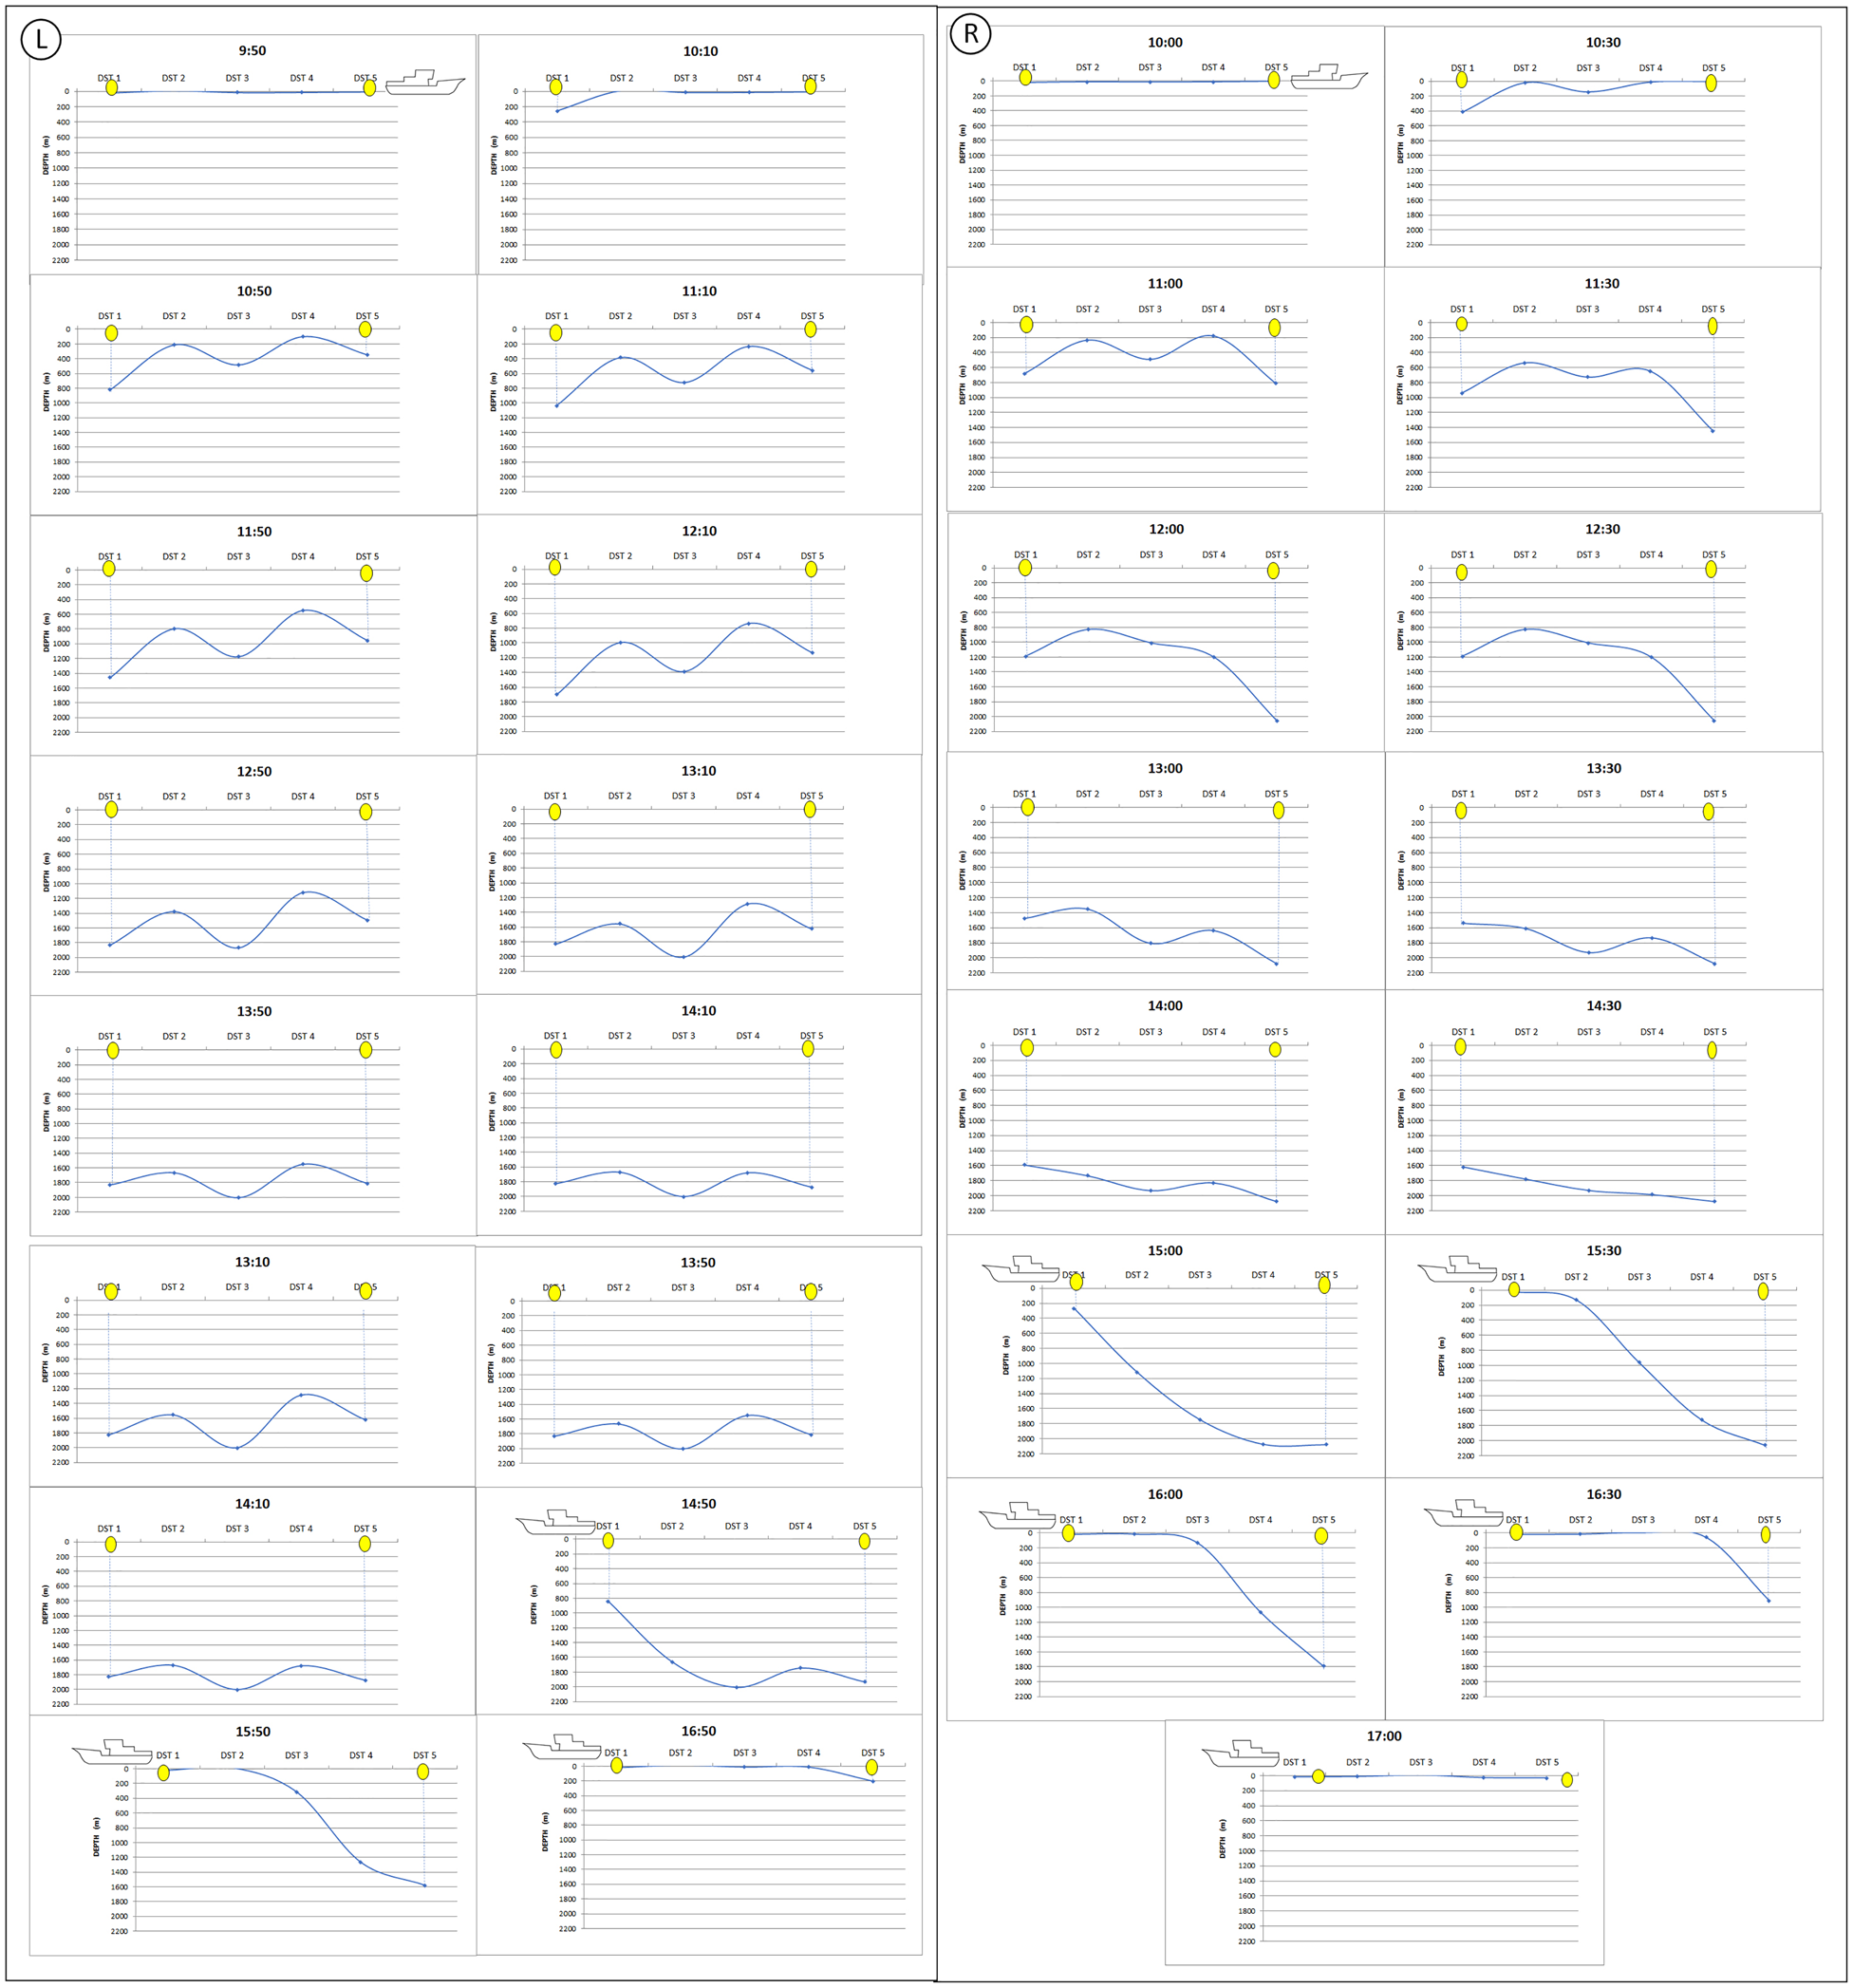
As a general behaviour, the fishing gear was deployed along the water column in an M-shape like profile because of the difference in weight between floating and ballasted sections. Usually, the first deployed section also arrived at the bottom before the last one, but, in a few hauls, due to the strong currents in the survey area, the first hauled part arrived at the bottom after the last part (Figure 3). In these cases, the estimated soak time could be accurately calculated thanks to the information provided by the DST sensors.
Sequence of fishing gear deployment monitored every 30 min from the start of hauling until arrival of the part on the surface. Each point on the line in the graphs shows the position of the five DST sensors placed at the beginning (DST1), end (DST5) and intermediate points (DST 2, 3 and 4) of the main line. Left figure: normal deployment; Right figure: irregular deployment with the end part of the gear (DST 5) arriving at the bottom earlier than the first one (DST 1).

Environmental data
Several data were recorded in each haul: longitude, latitude, horizontal distance between the start and end positions from the vessel deck, salinity, temperature and depth recorded by the DST sensors. The depth profile for each haul was obtained from the European Marine Observation and Data Network (http://portal.emodnet-bathymetry.eu/).
Biomass estimation: catch per unit effort (CPUE)
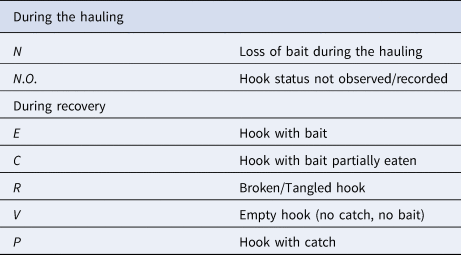
To calculate fishing effort and CPUEs in each haul, the hooks were classified according to the seven categories (R, V, N, C, E, P, N.O.), during both the hauling and recovery of the longline (Table 1).
Hook status categories

During the recovery of the longline, the hooks were numbered from 1 to 300 to identify the position of the catches and to identify whether the catches belonged to the floating or the bottom sections.
Percentage of Ineffective Hooks (PIH) was defined as the number of hooks not able to fish divided by the total number of hooks:
PIH: (R + V + N)/(C + E + N + P + R + V) (see Table 1 for the meaning of the categories).
Fishing Gear Catchability (FGC) was defined as the proportion of hooks that had fished (P) divided by the number of hooks able to fish (P + E + C):
FGC = P/(P + E + C).
Total Catchability (TC) was the proportion of hooks with catch in the total hooks hauled:
P/ = N + N.O. + E + C + R + V + P
Soak time was calculated from the time the first hook reached the bottom (indicated by sensor DST 1) until this hook was hauled back.
Soak time was different in each haul strata, since the time it took for the first hook to reach the bottom became longer as the depth of the bottom increased.
To be able to compare the analysis of catches by haul, fishing effort and CPUE were standardized to the number of hooks and duration of soak time. Thus, fishing effort in each stratum (EFFORTst) was estimated as the number of hooks able to fish during the haul (P + E + C), divided by the total of hooks and multiplied by soak time (minutes):
EFFORTst: ((P + E + C)/total hooks) × min
Catch per Unit of Effort of each stratum (CPUEs) was calculated as the catch (kg) divided by the EFFORTst:
CPUEst = kg/EFFORTst = kg/(hook × min)
Biological and catch data
All fish species caught were sorted and identified on board to the lowest taxonomic level possible, counted and measured. The deep-water sharks were also sexed, the maturity status following the WKMSEL scale (ICES, 2013) and the status condition (dead or alive) were annotated. The weight was estimated from the length/weight ratios for each species. To analyse fishing effort and CPUEs in each haul, the catches were grouped into four 400 m deep strata: 650–1050 m, 1051–1450 m, 1451–1850 m and 1851–2250 m.
Statistical analysis
ANOVA analyses were used (F-test) to determine whether the means of the CPUE data series by year and strata were different. Statistical analyses were performed in Statgraphics Centurion XVI, Version 16.2.04 (StatPoint Technologies, Inc.).
Results
Temporal changes in the biomass, abundance and CPUE
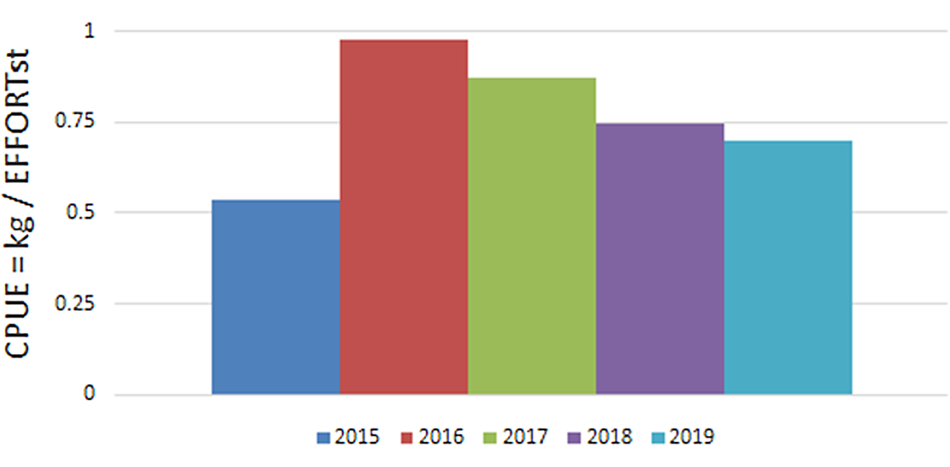
CPUE, throughout the five years of the survey, was between 0.54 and 0.98 kg/hook × min with the lowest value recorded in 2015 and the highest in 2016, mainly due to the significant catches of Centroscymnus coelolepis in this year (Figure 4). However, the differences in the mean CPUE between years were not statistically significant (P < 0.05).
Total CPUE in the period 2015–2019.

The highest abundance and biomass were also recorded in 2016 (257 individuals and 840 kg) (Figure 5). Regarding the catches by depth, the highest CPUE and biomass were recorded in the first three years at the 1051–1450 m strata, and in 2018 and 2019 in the 1451–1850 strata (Figures 6 & 7).
Total abundance and biomass in the period 2015–2019.

CPUE by depth stratum and year in the period 2015–2019.

Total abundance and biomass by stratum in the period 2015–2019.

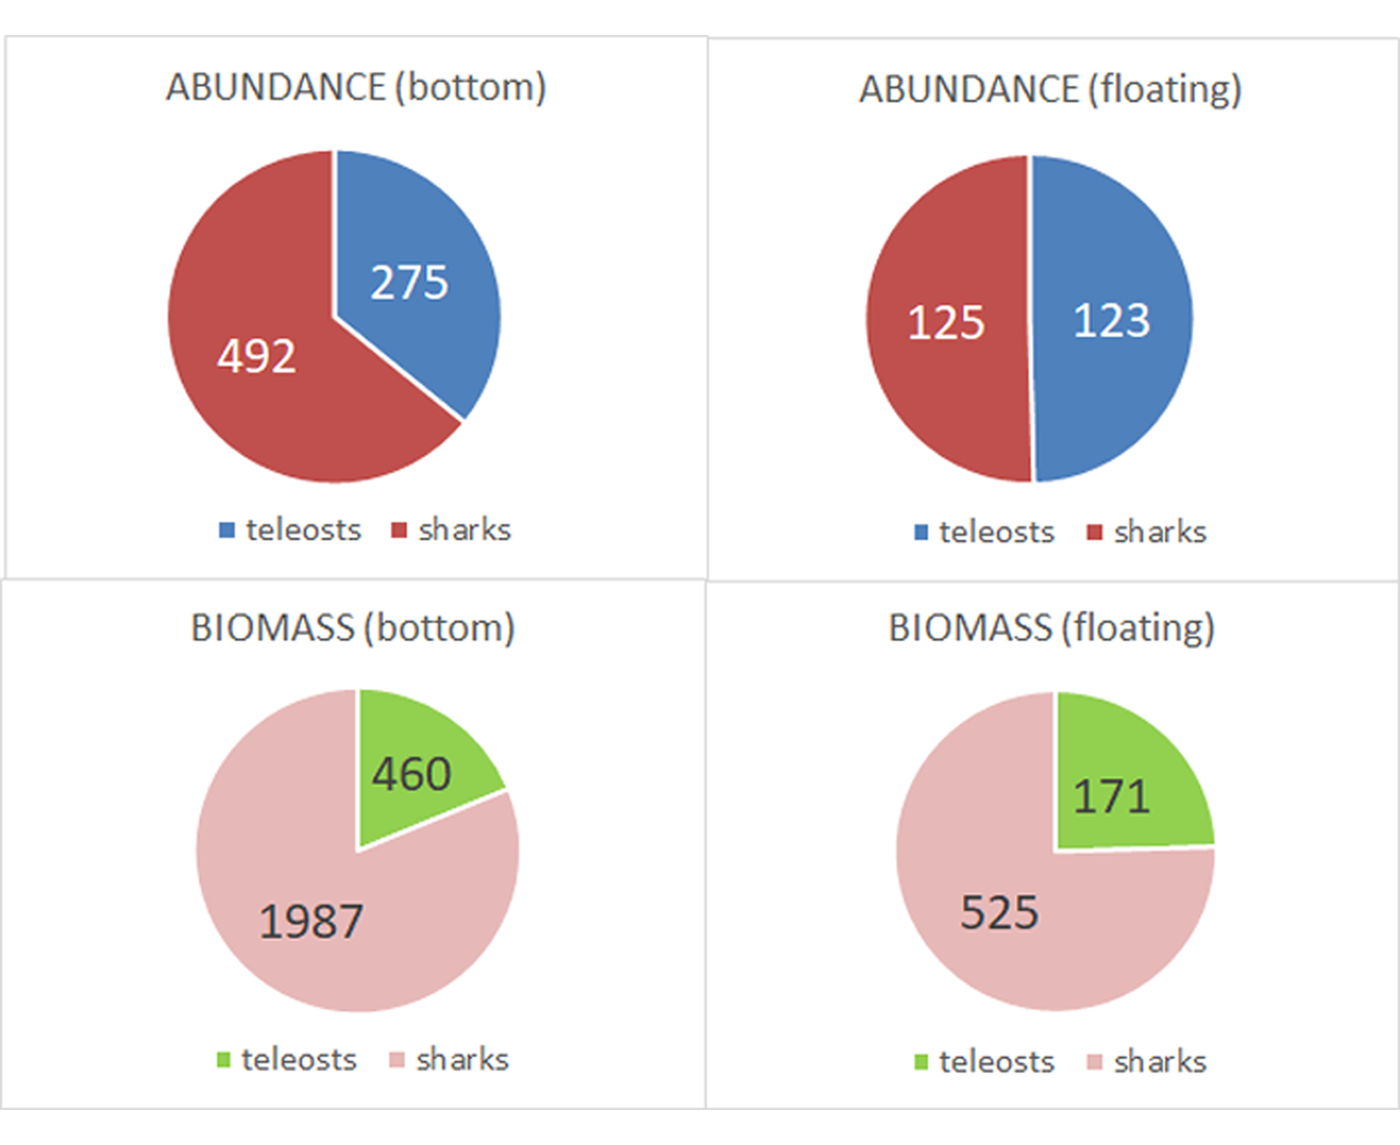
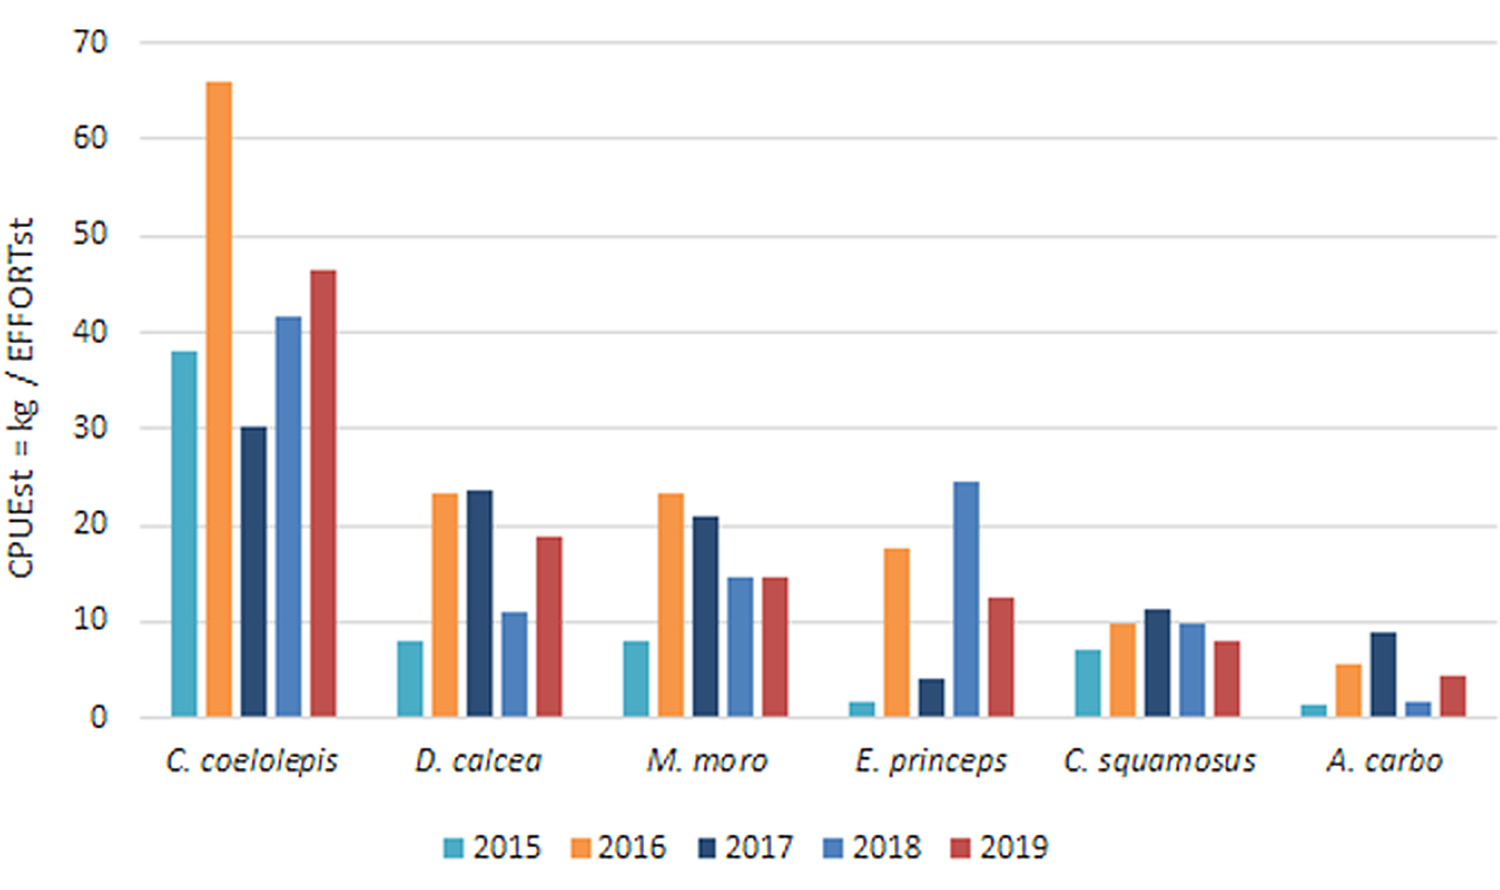
The abundance and biomass of elasmobranch and teleosts on the hooks attached to the bottom were between three and four times higher than in the floating sections, and the percentage of sharks and chimeras caught in the bottom sections was also higher than the percentage registered in the floating sections (Figure 8). The species-specific CPUE showed that the highest values were recorded for C. coelolepis, especially in 2016 and 2018, with 41.6 and 66.0 kg/(hook × min), respectively (Figure 9). Other species with high values of CPUE were Deania calcea, Mora moro and Centrophorus squamosus.
Total abundance (No.) and biomass (kg) in the bottom and floating sections in the period 2015–2019.

Evolution of the specific CPUE of the main fish species caught in the survey during the period 2015–2019.

Fishing gear parameters: Catchability and soak time
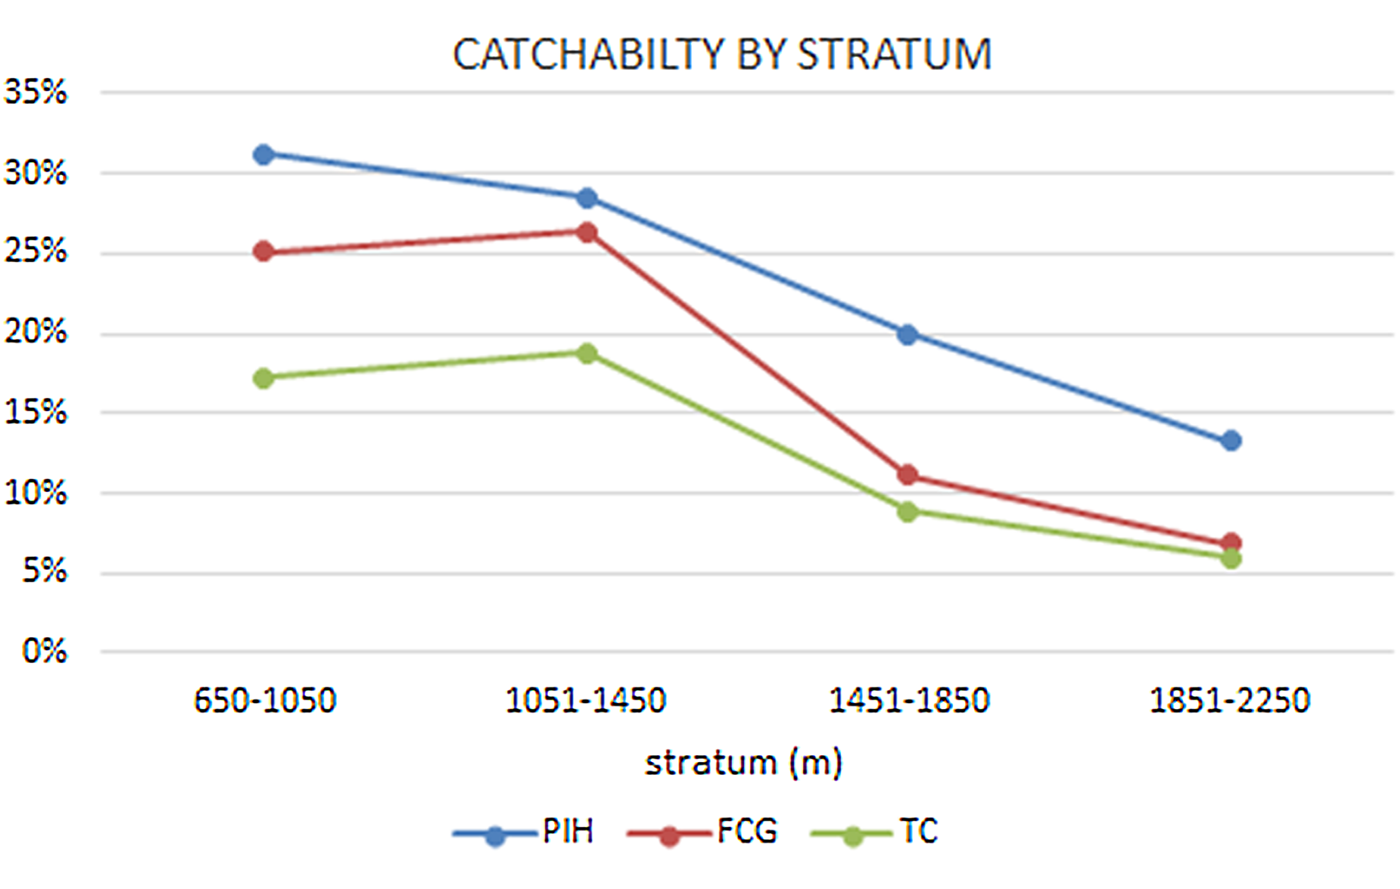
The parameters of the fishing gear catchability in the five years of the survey are shown in Figure 10. Percentage of Ineffective Hooks (PIH) increased in the shallowest depths, reaching more than 31% in the 650–1050 m stratum, probably due to hard and rocky bottoms that often resulted in the loss of baits and hooks in some sections of the main line. In this sense, PIH in the bottom section was 36% compared with 9% in the floating hooks. However, despite the higher PIH values registered in the 650–1050 m stratum, the proportion of hooks that had fished (values of the FGC and TC) was also higher in the shallower strata and decreasing in the deepest strata due to their lower soak time.
Percentage of ineffective hooks (PIH), Fishing Gear Catchability (FGC) and Total Catchability (TC) by stratum in the period 2015–2019.

On average, the soak time in the shallowest stratum was 253 min, and in the deepest one 126 min. Depending on the haul depth, the time it took the first hook (DST 1) to reach the bottom was between 20 and 216 min, with a recorded descent speed of between 7 and 25 m min−1.
Biodiversity
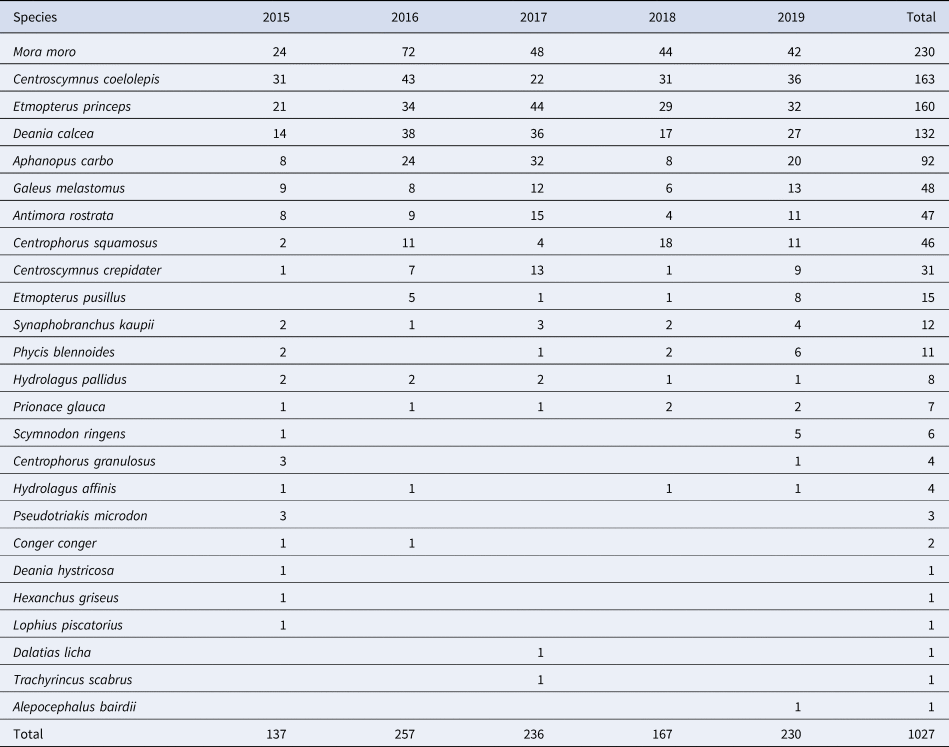
During the five years of the survey, 14 different species of sharks, two chimaeras and nine teleosts were caught. The most abundant species were gadiform M. moro (230), deep-water sharks C. coelolepis (163), Etmopterus princeps (160), D. calcea (132) and the black scabbard fish A. carbo (92) (Table 2). Some species such as Pseudotriakis microdon, Deania hystricosa, Hexanchus griseus, Lophius piscatorius, Dalatias licha, Trachyrincus scabrus and Alepocephalus bairdii were scarce in number and were only found in one year of the series. A higher number of different species was found on the hooks in contact with the bottom (24 species) than in the floating section (15 species).
Abundance of species (no.) in the catches during the period 2015–2019

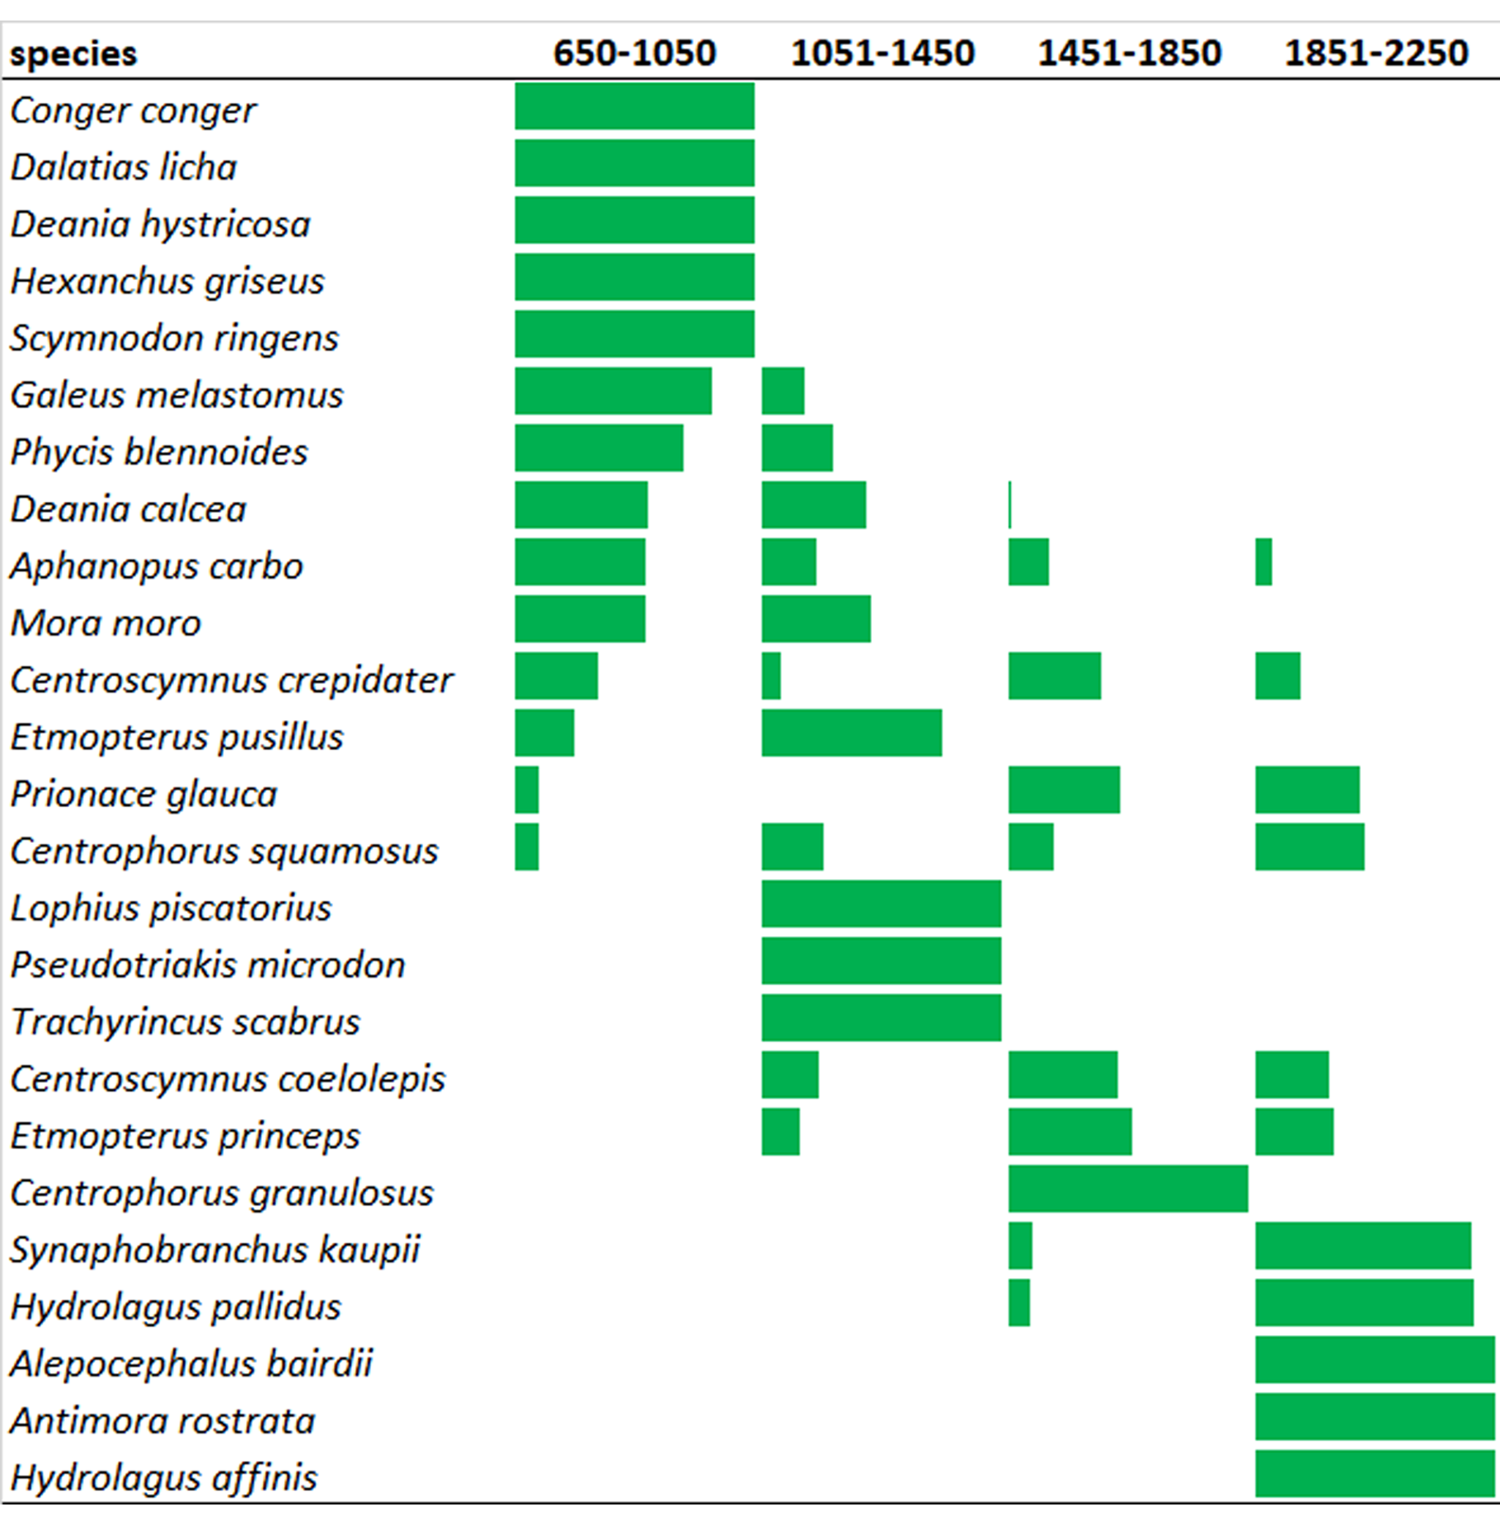
In relation to the bathymetric distribution of the species, Figure 11 shows the individual CPUE by depth strata. Conger conger, D. hystricosa, H. griseus, S. ringens and D. licha were only caught in the first strata (650–1050 m), while A. carbo, M. moro, C. crepidater, E. pusillus, P. glauca and C. squamosus were found in the entire depth range. In contrast, species such as S. kaupii, H. pallidus, A. rostrata and H. affinis mainly appeared in the deepest stratum.
Bathymetric distribution of the species. Bars indicate in percentage the CPUE of each species by depth strata during period 2015–2019.

Discussion
The Matxitxako Canyon's length and its smooth downward slope profile permitted sampling of one haul per day covering a bathymetric range of 650–2250 m. The proximity of the survey area to the port base also permitted performing the hauls during daytime, thus reducing trip duration and minimizing the survey cost.
In spite of the small number of hooks and the short soak time, the fishing gear was able to catch a significant number of different species. However, the overall catchability was considered low, and only 15% of the total hooks deployed in the five years of the survey were able to fish. The lowest FGC and TC were particularly observed in the strata from 1851–2250 m, probably due to the lower soak time reached in deepest strata. In this sense, the low catchability was also partially due to the large number of hooks returned empty, tangled or broken by rubbing against the rocks on the bottom. Further, 50% of the hooks were placed on the two ‘floating’ sections of the main line, where lower abundance of species was recorded. To increase the Fishing Gear Catchability FGC, it would be necessary to undertake a longer effective fishing time (soak time), and therefore the extension of the period on board to recover the gear and collect the catch data. A longer soak time by haul would consequently lead to a longer trip duration (up to 12 h), and therefore an increase in the survey cost. However, the aim of the short soak time set was to reduce mortality in the fishing gear as much as possible, especially if deep-water sharks were affected. In this sense, Haimovici & Ávila-da-Silva (Reference Haimovici and Ávila-da-Silva2007) concluded that for short soak times, hauls in longline surveys can provide reliable information on CPUE, distribution and relative abundance of the target fish. In this sense, a longer soak time could lead to hooked fish being eaten by other fish. Normally, due to the relatively large individuals caught with the fishing gear, these fishes appear hooked but with the body only partially eaten and therefore could be easily identified and the hooks with these characteristics annotated as category P (hook with catch).
Due to the unpredictable profile of deployment of the longline in each haul, it was not possible to predict the time for the longline to arrive at the bottom, and consequently, the estimation of the effective fishing time (soak time) before hauling. In deep-water deployments, the longline is affected by technical and oceanographic factors such as the hauling method (straight or zig-zag), depth, bottom profile, and especially the current strength along the water column that displaces, accelerates or delays the arrival of the longline to the bottom, regardless of the depth. The post-analysis of the data showed that the DST sensors were able to accurately record the fishing gear deployment pattern (time and depth). Thus, we were able to estimate the effective fishing time in each haul, and thus standardize the CPUE calculation. Besides, the CPUE was improved by omitting the ineffective hooks (broken, bent or tangled) from the calculations in each haul. This sampling design made the information strata of the same depth comparable from haul to haul and from year to year.
The sensors installed in the fishing gear were easy to use and install in the longline. Five sensors were enough and showed sufficient accuracy to monitor the deployment and movements of the longline from the surface to the bottom. However, the sensors placed at the top of the floating sections, while properly indicating the depth of the main line at that point, could not report directly the absolute distance to the bottom because it was impossible to know the exact ground profile where the line touched the seafloor. However, the distance of the floating section to the seafloor was very variable and was estimated within a range of 50–500 m by analysing the information recorded by DST 2 and 4 when the whole longline was stable at the bottom.
Of the 25 species identified in the valid hauls, 13 were deep-water shark species, nine teleosts, two chimaeras, and one species of pelagic shark (P. glauca), probably caught when the main line was still near the surface during the hauling.
The gear proved to be able to catch a wide range of elasmobranch species and sizes, from the largest to the smallest ones, such as Hexanchus griseus and E. princeps of 45 cm, and exceptionally chimaeras belonging to the genus Hydrolagus. One skate, Rajella kukujevi, and a single deep-water shark, Somniosus microcephalus, were also caught in a failed haul in 2017. Rajella kukujevi was described for the first time by Dolganov (Reference Dolganov1985) in the northern part of the Mid-Atlantic Ridge, and first recorded in the Bay of Biscay in 2012 during a scientific trawling survey, also in the Cantabrian sea (ICES 8c Division) (Rodríguez-Cabello et al., Reference Rodgveller, Lunsford and Fujioka2012, Reference Rodríguez-Cabello, Arronte, Sánchez and Pérez2013). In the present survey, the most abundant elasmobranch species were C. coelolepis, D. calcea and E. princeps. All these species were common in the catches of former commercial deep-water fisheries and in scientific surveys in the Cantabrian sea (ICES 8c) and the Bay of Biscay (ICES 8abd). Alcázar et al. (Reference Alcázar, González, Fernández, García, Rucabado, Lloris and Castellón1992) described the result of the catches of the only bottom longline scientific survey carried out in 1988 in the Cantabrian sea within a depth range of 400–3400 m. Although the ‘piedra-bola’ fishing gear used by these authors was different to the one described in the present study, the biodiversity and proportion of elasmobranchs in the catches was very similar (11 species of deep-water sharks). According to these authors, the longline ‘piedra-bola’ was able to catch a higher biodiversity of different teleosts, especially of gadiform fishes, but showed less suitability for catching deep-water skates and rays compared with the ability of the trawling gear to pick up almost all species living on the seabed.
The almost negligible catches of deep-water skates in the present survey were probably due to the large size of the hooks, not suitable to entangle small species; the bait used, which was also especially suitable for sharks; or the fact that sharks can reach the fishing gear faster than skates. On the contrary, the diversity of teleost species in the present study was relatively low, and catches were more abundant in the longline floating zone, while the highest proportion of elasmobranchs were caught in the section of the line where the hooks were in contact with the seabed. Among the teleosts, the gadiform M. moro was the most abundant, especially in the two shallower strata. Aphanopus carbo was found in the whole bathymetric distribution but was less abundant in the deepest strata. On the other hand, A. rostrata was only caught in the stratum of 1851–2250 m.
The Centrophorus genus species was less abundant in our area compared with reported catches in longline surveys carried out in European waters at similar depths. Alcázar et al. (Reference Alcázar, González, Fernández, García, Rucabado, Lloris and Castellón1992) reported that the C. squamosus, C. granulosus and C. uyato species in the Cantabrian Sea represented 19.2% of total catches in numbers, whereas Clarke & Moore (Reference Clarke and Moore2002) in Porcupine, Rockall and Hatton Banks, recorded C. squamosus as the third most abundant species in biomass (13.6%). In our survey, this species was one of the less abundant sharks, accounting for 3.2% in number and 5.9% in biomass, and no other species of this genus were found. Moreover, in a more recent trawl survey in the Cantabrian sea, the species of this genus were among the least abundant deep-water sharks present in the catches (Rodríguez-Cabello et al., Reference Rodríguez-Cabello, Arronte, Sánchez and Pérez2013).
Clarke et al. (Reference Clarke, Borges and Officer2005) reported in West and North of Ireland waters highest catch rates (kg per 1000 hooks) of C. squamosus and D. calceus between 700 and 900 m and of C. coleolepis deeper than 1300 m. The two first species were found in a range of depths from 300–1500 m and C. coelolepis from 500–1800 m, although with very lower catches until 800 m. The bathymetric range of distribution and CPUE of these three species in the present survey were very similar although the depth ranges considered in each study were slightly different, with the lower depth of 300 and 650 m and higher of 1800 and 2250 m in Clarke et al. (Reference Clarke, Borges and Officer2005) and the present study, respectively.
Catches of S. ringens were very low (only five individuals caught in 2015 and in 2019). However this species is the most abundant in the by-catches of the commercial deep-water-gillnet fishery that takes place in the same fishing grounds of the survey, reaching 51.3% in total weight of sharks caught by this fleet (Canive et al., Reference Canive, Mugerza and Diez2015). In this sense, the fishing gear used by the commercial deep-water-gillnet fleet is hauled mainly from 600–800 m (sometimes reaching 1000 m in depth), and the soak time is usually 5–6 days, which implies net fishing at night time (Mugerza et al., Reference Menezes, Tariche, Pinho, Sigler and Silva2013). On the contrary, the longline in the survey is only hauled during daytime. This fact led to the assumption that S. ringens could be a species with different feeding behaviour or preference for nocturnal habits.
In a deep-water longline survey carried out in 2000 in western Irish waters, the catch per unit effort showed the highest abundances in the Porcupine Bank at 600–700 m, and at depths of 1000–1200 m in the western slopes of Rockall and Hatton Banks (Clarke & Moore, Reference Clarke and Moore2002). Similarly to Clarke & Moore's findings, in our study the strata at mid-depths (1051–1450 m and 1451–1850 m) recorded higher average CPUE than the shallowest and deepest strata, particularly due to the significant catches of deep-water sharks and M. moro.
The highest CPUE recorded in 2016 and 2017 was mainly due to the high catches of C. coelolepis, and to a lesser extent, to D. calcea, C. squamosus and M. moro. Although in all the years of the series, the main species caught were the same, the species-specific CPUE series did not show a clear trend throughout the survey period. For the five main species caught, the maximum CPUE always coincides in 2016 and 2017, except for C. squamosus in 2018. The maximum CPUE in 2016 and 2017 was also observed for the two shallower strata, but for strata deeper than 1450 m, thus, the interannual trend is not clear.
Conclusions
Although the deep-water longline used in the surveys was based on former commercial gear (specifically designed for catching sharks), it has been very effective in fishing a wide number of different species in all depth ranges thanks to the modifications implemented.
Based on recommendations to reduce mortality in fished sharks, we decreased the number of hooks and the soak time (compared with commercial fishing). This resulted in lower catchability of the gear. The bottom longline survey was able to provide reliable information on the fluctuation of relative biomass and abundance at the different strata. The data series obtained in the 5 years of the campaign has been able to record the interannual variations in the CPUE, and abundance of deep-water sharks and other species in a specific area of the Cantabrian sea (ICES Division 8c east).
Monitoring the fishing gear by means of the DST sensors has allowed us to know the deployment of the longline along the water column, and its arrival at the bottom, and thus set an accurate soak time for each haul. The exact knowledge of the soak time led to the calculation of the fishing effort and CPUE, standardized to the number of hooks and the effective fishing time in each haul.
Acknowledgements
This work has been supported by the Arrantza eta Akuikultura Zuzendaritza – Directorate of Fisheries and Aquaculture of the EUSKO JAURLARITZA – BASQUE GOVERNMENT (Ekonomiaren Garapen eta Azpiegitura Saila – Department of Economic Development and Infrastructures, Nekazaritzako, Arrantzako eta Elikagai Politikako Sailburuordetza – Vice. of Agriculture, Fisheries and Food Policies). The authors would like to thank the skippers, J.R Badiola, A. Bilbao, the crew members of the longliner ‘ITOITZ’ and the staff of the company ARLANPI S.A. for their technical assistance in preparing the survey tasks and their experience in deep-water fishing grounds during the surveys at sea.