


Food consumption patterns are changing rapidly in the Italian population. Important factors of change are the evolution of lifestyle, the availability of a large variety of new intensively advertised food products and the progressive ageing of the population. A steady increase of meals consumed away from home and of convenience foods has been observed(1). The traditional Mediterranean diet, rich in plant foods, is being modified(Reference Branca, Nikogosian and Lobstein2).
The availability of data collected at individual level in various sections of the population is crucial to characterize food consumption patterns. These data are needed to perform a number of research and surveillance activities in the area of consumer science, nutrition and food safety. Nationwide Italian food consumption surveys had been performed in 1980–84(Reference Saba, Turrini, Mistura, Cialfa and Vichi3) and 1994–96(Reference Turrini, Saba, Perrone, Cialfa and D’Amicis4). The Italian Ministry of Agriculture funded the third national food consumption survey, named INRAN-SCAI 2005–06, to update current dietary information.
The current paper aims to present the main results of the Italian National Food Consumption Survey INRAN-SCAI 2005–06.
Methods
A cross-sectional survey was conducted on a random sample of the Italian population.
Sample
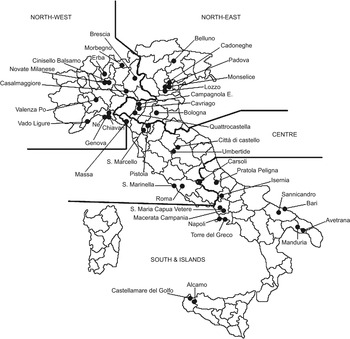
A target sample of 1300 households was considered with the aim of characterizing average food consumption in the four main geographical areas of Italy (North-West, North-East, Centre and South and Islands). The Census performed in 2001 by the Italian National Institute of Statistics (ISTAT)(5) was used for the multistage stratification of the sample into: (i) four geographical area strata; (ii) three provinces population size strata (low, medium and large); (iii) two municipalities population size strata (large–medium and small); and (iv) four household composition strata (one member less than 65 years of age, one member aged 65 years and above, two or three members, four or more members). A total of forty municipalities belonging to twenty-three provinces were involved in the survey (Fig. 1).
Location of the forty municipalities and the twenty-three provinces randomly selected to represent the four main geographical areas of Italy: Italian National Food Consumption Survey INRAN-SCAI 2005–06
In each municipality, households were randomly selected from the telephone guide TELECOM (2005 edition) and were phoned up several times during the daytime and in the evening until contact was established. Each contacted household was invited to participate until the municipality’s target number of households was reached for the category in terms of household composition. Each individual who had his/her main meals in the household on a regular basis during the period of the survey was considered as a member of the household, even if he/she was not a relative of other members. Criteria for inclusion of the household were that all members would participate in the case of households with up to three members and that no more than one member would refuse to participate in the case of households with more members. Information on the motivation for refusal was collected. The sampled households were distributed in the four seasons (excluding Christmas and Easter periods). The survey calendar was organized to capture an adequate proportion of weekdays and weekend days at group level.
Food survey
The food survey was conducted from October 2005 to December 2006 by a team of thirty trained field workers. Food consumption was self-recorded by subjects for three consecutive days on hard-copy diaries structured by meal. All foods, beverages, food supplements and medicines ingested were to be registered. The survey protocol is described in detail in publications related to previous food surveys performed by the National Research Institute for Food and Nutrition (INRAN) with the same methodology(Reference Leclercq, Berardi, Sorbillo and Lambe6, Reference Leclercq, Piccinelli, Arcella and Le Donne7). For children below 8 years of age and for any subject who was not able to do so, the diaries were filled in by the person who took care of him/her. Each field worker individually met each participant three times during the survey period. For every eating occasion, subjects were asked to carefully record: time, place of consumption, detailed description of foods (or beverages), quantity consumed and brand (for manufactured foods). Portion sizes were reported by subjects with the help of a picture booklet. The booklet was based on a selection of photo series from the original EPIC-SOFT picture book(Reference Van Kappel, Amoyel, Slimani, Vozar and Riboli8), with foods and dishes of different standard portion sizes (small, average or large) relevant for the Italian diet. The booklet included photos of household measures (glasses, spoons, cans, etc.) and instructions to quantify the portions used by children.
For each of the three days, subjects were asked if they were following a particular diet and if the consumption they had reported differed from their usual consumption. Field workers subsequently registered their judgement on the reliability of the information recorded in each single day.
Height and body weight were self-reported.
Ancillary databases
Four databases were used to transform the data reported by subjects into the weight of single raw ingredients and into the amounts of nutrients consumed: (i) the ‘Food descriptors database’: (ii) the ‘Household unit of measurements database’; (iii) the ‘Standard recipes database’; and (iv) the ‘Food composition database’. In the ‘Household unit of measurement database’, the portions estimated by subjects with the help of the picture booklet are linked to the specific weight of each food item. This database contains a total of 9450 entries (weight of standard portions of specific dishes or units of measurement) for 2460 foods, i.e. on average approximately four entries per food.
Data coding, data entry and data processing
The data management system INRAN-DIARIO3.1 developed by INRAN(Reference Le Donne, Arcella, Piccinelli, Sette, Berardi and Leclercq9) and used in previous surveys(Reference Leclercq, Berardi, Sorbillo and Lambe6, Reference Leclercq, Piccinelli, Arcella and Le Donne7) was used for data coding, data entry and data processing. The food description reported on the diary was entered as such by the field worker in an open format text field. The quantity consumed was entered together with the unit of measurement (e.g. grams, glasses, spoons) and a food descriptor was selected from the relevant database.
The data entry procedure included a consistency check between units of measurements and food descriptors. A central procedure (MASTER) applied quality control routines.
The predicted energy expenditure (EE) was calculated for each subject based on the reported body weight and the equations reported by the Scientific Committee for Food(10). For infants and children below 10 years of age, equations are available to assess directly predicted EE. For subjects above 10 years of age, the estimated BMR (BMRest) is first calculated and then multiplied by the estimated physical activity level (PAL). In adults and the elderly, the values considered were those of sedentary subjects with ‘desirable physical activities’.
Thus, the hard copies of the diaries were checked to identify possible data entry errors when no eating occasion had been entered for one of the meals or when the total energy from food and beverages reported in a diary was more than 120 % or less than 70 % of the predicted EE of the subject.
Once the digit errors and codification errors were corrected, the average food consumption and the average energy intake (EI) during the survey period were calculated for each individual.
During the data processing, mixed dishes were disaggregated into their ingredients. Exceptions were some industrial processed products which contain a major ingredient from one category. Thus, fish fingers are reported in the category ‘Fish, seafood and their products’ even though they contain breading.
The classification of food items at ingredient level into fifteen large food categories and fifty-one subcategories was based largely on the classification developed by the European Food Safety Authority(11). Any subject who consumed at least one item within the food category on at least one eating occasion during the survey was classified as a consumer of the category.
The water used in the reconstitution of dehydrated products was included in the subcategories ‘Tap water’ or ‘Bottled water’ together with water consumed as such. The Appendix provides a list of the major food items classified in each subcategory together with a list of the most frequent minor ingredients of composite foods belonging to other categories.
Subjects were classified according to age category: infants (0–2·9 years), children (3–9·9 years), teenagers (10–17·9 years), adults (18–64·9 years) and elderly (65 years and above).
Statistical analyses were carried out using the SAS for Windows statistical software package release 8·01 (SAS Institute Inc., Cary, NC, USA).
Results
Among all households that had been randomly extracted, 14 % could not be contacted (they had moved or were absent) whereas 2 % were contacted but not invited to participate because the target number of households for their category had been reached in the municipality. Among households invited to participate, the participation rate was 33 %. The most frequently reported motivation for refusal was lack of time (49 %).
A total of 3328 individuals belonging to 1329 households participated in the food survey. Among these, five subjects were excluded because their food diaries were considered unreliable by the field worker due to a low level of collaboration and repeated omissions in the recording of eating occasions. The final study sample therefore comprised 3323 subjects. Males were aged 0·1 to 92·9 years and females were aged 0·1 to 97·7 years. Physical characteristics of the study sample by age and sex are described in Table 1.
Physical characteristics of the study sample by age and sex: Italian National Food Consumption Survey INRAN-SCAI 2005–06

*Weight and height were self-reported. Data are missing for one female in the age class 18–64·9 years.
Overall, the analysed records represent 9969 days. Weekdays (Monday to Friday) represented 78 % of all survey days, i.e. slightly more than 5/7. Survey days were proportionally distributed among seasons: 25 % in autumn, 25 % in winter, 26 % in spring and 24 % in summer.
Overall 199 subjects (141 females and fifty-eight males) declared to be on a specific diet during the survey, most often a slimming diet (fifty-nine females and seventeen males). Other diets were related to health conditions or other reasons (e.g. vegetarian diet). Moreover, 208 subjects declared that their food consumption on at least one of the survey days had differed from usual, leading to either increased (e.g. feast) or reduced (e.g. subjects feeling unwell) food consumption.
Mean EI in the study sample (3323 subjects) is reported in Table 2 by age and sex. In the same table, EI and the ratio of EI to predicted EE are reported in a selected sample of 2890 subjects, after exclusion of females who were either pregnant (n 19) or lactating (n 10) and of all subjects who had reported a food consumption pattern different from usual or who were on any kind of diet.
Estimated energy intake (EI) and ratio of EI to predicted energy expenditure (EE) by age and sex: Italian National Food Consumption Survey INRAN-SCAI 2005–06

*The selected sample was obtained after exclusion of all female subjects who were either pregnant or lactating and of subjects who had declared to be on any kind of diet or who had reported that their food consumption pattern was different from usual during the survey days.
The mean EI:BMRest ratio in adults of the selected sample was 1·41 (1·36 in males and 1·46 in females; data not in table).
Results in terms of food consumption are presented in Table 3 for the total sample and in Tables 4–11 by age and sex categories.
Mean, standard deviation, median and high percentiles of individual daily consumption (3 d average) by food category in the total population and in consumers (g/d) – all ages, males and females: Italian National Food Consumption Survey INRAN-SCAI 2005–06

*High percentiles of consumption assessed on the basis of a 3 d survey provide an overestimate of long-term high levels of consumption. Values are enclosed in parentheses when the number of subjects to which they refer is lower than 160 and 800 for the 95th and 99th percentile, respectively, since these values bear a large uncertainty and provide only a rough indication of high levels of consumption.
†All beverages and milk in liquid state were classified as liquid foods; all other items were classified as solid foods.
Mean, standard deviation, median and high percentiles of individual daily consumption (3 d average) by food category in the total population and in consumers (g/d) – infants (0·1 to 2·9 years), males and females: Italian National Food Consumption Survey INRAN-SCAI 2005–06

*High percentiles of consumption assessed on the basis of a 3 d survey provide an overestimate of long-term high levels of consumption. Values are enclosed in parentheses when the number of subjects to which they refer is lower than 160 and 800 for the 95th and 99th percentile, respectively, since these values bear a large uncertainty and provide only a rough indication of high levels of consumption.
†All beverages and milk in liquid state were classified as liquid foods; all other items were classified as solid foods.
Mean, standard deviation, median and high percentiles of individual daily consumption (3 d average) by food category in the total population and in consumers (g/d) – children (3 to 9·9 years), males and females: Italian National Food Consumption Survey INRAN-SCAI 2005–06

*High percentiles of consumption assessed on the basis of a 3 d survey provide an overestimate of long-term high levels of consumption. Values are enclosed in parentheses when the number of subjects to which they refer is lower than 160 and 800 for the 95th and 99th percentile, respectively, since these values bear a large uncertainty and provide only a rough indication of high levels of consumption.
†All beverages and milk in liquid state were classified as liquid foods; all other items were classified as solid foods.
Mean, standard deviation, median and high percentiles of individual daily consumption (3 d average) by food category in the total population and in consumers (g/d) – teenagers (10 to 17·9 years), males: Italian National Food Consumption Survey INRAN-SCAI 2005–06

*High percentiles of consumption assessed on the basis of a 3 d survey provide an overestimate of long-term high levels of consumption. Values are enclosed in parentheses when the number of subjects to which they refer is lower than 160 and 800 for the 95th and 99th percentile, respectively, since these values bear a large uncertainty and provide only a rough indication of high levels of consumption.
†All beverages and milk in liquid state were classified as liquid foods; all other items were classified as solid foods.
Mean, standard deviation, median and high percentiles of individual daily consumption (3 d average) by food category in the total population and in consumers (g/d) – teenagers (10 to 17·9 years), females: Italian National Food Consumption Survey INRAN-SCAI 2005–06

*High percentiles of consumption assessed on the basis of a 3 d survey provide an overestimate of long-term high levels of consumption. Values are enclosed in parentheses when the number of subjects to which they refer is lower than 160 and 800 for the 95th and 99th percentile, respectively, since these values bear a large uncertainty and provide only a rough indication of high levels of consumption.
†All beverages and milk in liquid state were classified as liquid foods; all other items were classified as solid foods.
Mean, standard deviation, median and high percentiles of individual daily consumption (3 d average) by food category in the total population and in consumers (g/d) – adults (18 to 64·9 years), males: Italian National Food Consumption Survey INRAN-SCAI 2005–06

*High percentiles of consumption assessed on the basis of a 3 d survey provide an overestimate of long-term high levels of consumption. Values are enclosed in parentheses when the number of subjects to which they refer is lower than 160 and 800 for the 95th and 99th percentile, respectively, since these values bear a large uncertainty and provide only a rough indication of high levels of consumption.
†All beverages and milk in liquid state were classified as liquid foods; all other items were classified as solid foods.
Mean, standard deviation, median and high percentiles of individual daily consumption (3 d average) by food category in the total population and in consumers (g/d) – adults (18 to 64·9 years), females: Italian National Food Consumption Survey INRAN-SCAI 2005–06

*High percentiles of consumption assessed on the basis of a 3 d survey provide an overestimate of long-term high levels of consumption. Values are enclosed in parentheses when the number of subjects to which they refer is lower than 160 and 800 for the 95th and 99th percentile, respectively, since these values bear a large uncertainty and provide only a rough indication of high levels of consumption.
†All beverages and milk in liquid state were classified as liquid foods; all other items were classified as solid foods.
Mean, standard deviation, median and high percentiles of individual daily consumption (3 d average) by food category in the total population and in consumers (g/d) – elderly (≥65 years), males: Italian National Food Consumption Survey INRAN-SCAI 2005–06

*High percentiles of consumption assessed on the basis of a 3 d survey provide an overestimate of long-term high levels of consumption. Values are enclosed in parentheses when the number of subjects to which they refer is lower than 160 and 800 for the 95th and 99th percentile, respectively, since these values bear a large uncertainty and provide only a rough indication of high levels of consumption.
†All beverages and milk in liquid state were classified as liquid foods; all other items were classified as solid foods.
Mean, standard deviation, median and high percentiles of individual daily consumption (3 d average) by food category in the total population and in consumers (g/d) – elderly (≥65 years), females: Italian National Food Consumption Survey INRAN-SCAI 2005–06

*High percentiles of consumption assessed on the basis of a 3 d survey provide an overestimate of long-term high levels of consumption. Values are enclosed in parentheses when the number of subjects to which they refer is lower than 160 and 800 for the 95th and 99th percentile, respectively, since these values bear a large uncertainty and provide only a rough indication of high levels of consumption.
†All beverages and milk in liquid state were classified as liquid foods; all other items were classified as solid foods.
The percentage contribution in weight to the total amount of foods and beverages was calculated for each large food category by age and sex and the significance of differences was tested (P < 0·05; Kruskal–Wallis test). Data are illustrated in Fig. 2. For most food categories, the percentage contribution varied significantly among age classes. Statistically significant differences between males and females were observed only in adults and the elderly and only for some food categories. For example, the contribution in weight of ‘Alcoholic beverages and substitutes’ was higher in males than in females (7·4 % v. 2·9 % in adults and 8·2 % v. 3·0 % in the elderly).
Consumption pattern by age and sex: percentage contribution (in weight) of each food category* to the total amount of food and beverages in the Italian National Food Consumption Survey INRAN-SCAI 2005–06.*The contribution of ‘Meal substitutes’ and of ‘Miscellaneous’ is not reported. It was less than 0·2 % in all age and sex classes. Statistically significant differences (P < 0·05; Kruskal–Wallis test) were found among age classes in all reported food categories, except for ‘Fish, seafood and their products’ in males and for ‘Pulses, fresh and processed’ in males and females. Statistically significant differences between sex (P < 0·05; Kruskal–Wallis test) were found only among adults and the elderly: in adults for ‘Cereals, cereals products and substitutes’, ‘Fruit, fresh and processed’, ‘Meat, meat products and substitutes’, ‘Milk, milk products and substitutes’, ‘Oils and fats’, ‘Alcoholic beverages and substitutes’, ‘Eggs’ and ‘Water and other non alcoholic beverages’; in the elderly for ‘Cereals, cereals products and substitutes’, ‘Fruit, fresh and processed’, ‘Meat, meat products and substitutes’, ‘Fish, seafood and their products’, ‘Milk, milk products and substitutes’, ‘Oils and fats’, ‘Alcoholic beverages and substitutes’ and ‘Water and other non-alcoholic beverages’

Among ‘Cereals, cereal products and substitutes’, the highest consumption was from ‘Bread’ followed by ‘Pasta and pasta substitutes’. The consumption reported for ‘Pizza’ referred only to plain white pizza and plain tomato pizza. The total pizza consumption (including all types of pizzas with their ingredients) was 55·7 g/d in the total population (data not in table).
Among ‘Meat, meat products and substitutes’, the highest proportion of consumers was found for the subcategory ‘Ham, salami, sausages and other preserved meats, excl. offal’ (81 % of the total sample) but the highest daily consumption was reported for the subcategory ‘Beef and veal, not preserved, excl. offal’ (more than 40 g/d in the total population). Only three subjects declared to follow a vegetarian diet during the survey. Overall thirty-two subjects did not consume ‘Meat, meat products and substitutes’ during the survey and four subjects consumed only meat substitutes (e.g. seitan and soya hamburger) among this category.
Among ‘Oils and fats’, olive oil represented 81 % of total consumption (and 93 % of vegetable oils) in the whole sample.
Among ‘Alcoholic beverages and substitutes’, ‘Regular wine and substitutes’ represented 70 % of total consumption in the whole sample, reaching 92 % and 94 % respectively in elderly males and elderly females.
A high percentage of infants, children and teenagers appeared to be consumers of ‘Alcoholic beverages and substitutes’ due to the consumption of dishes which are traditionally prepared with a few drops of alcoholic beverage added during the cooking process. After exclusion of this source, alcoholic beverages were found to be consumed by no infant, by four children (24 g/d on average in consumers) and by fifteen teenagers (44 g/d). The overall percentage of consumers of alcoholic beverages – consumed as such – in the study sample was 46·8 % and their mean daily consumption was 194·3 g/d (data not in table).
Discussion
Sampling and participation rate
As expected from the sampling procedure, the distribution of households among geographical areas (257 in the North-West, 376 in the North-East, 257 in the Centre and 439 in the South and Islands) and according to their composition category (329 singles – including 54 % aged 65 years or more, 665 households with two or three members and 665 households with four or more members) was in line with the last population Census(5).
Institutionalized subjects, such as the elderly in rest homes, were not covered.
Use of the TELECOM telephone guide as a sampling basis and of telephone calls as the first contact with households necessarily led to the exclusion of certain typologies of households: (i) households without a fixed telephone (11 % of Italian households according to ISTAT(12)); (ii) households whose telephone number is not reported in the TELECOM guide; and (iii) households whose members are very frequently out of home and who could not be contacted.
A high percentage of households refused to participate, leading to a low participation rate (33 %). In the previous Italian national food consumption survey(Reference Turrini, Saba, Perrone, Cialfa and D’Amicis4) the participation rate of households was higher (47 %), but one-third of the subjects were then discarded due to clear under-reporting. Individual dietary surveys conducted in European countries from 1980 to 2001 show participation rates varying from 36 % to 86 %(Reference Verger, Ireland, Møller, Abravicius and De Henauw13). More recent surveys performed among adults in Ireland(Reference Kiely, Flynn, Harrington, Robson and Cran14), The Netherlands(Reference Ocké, Hulshof and van Rossum15) and the UK(Reference Hoare, Henderson, Bates, Prentice, Birch, Swan and Farron16) showed a participation rate of respectively 63 %, 42 % and 63 %.
The low participation rate could have affected the representativity of the study sample. However, the low percentage of subjects who declared to follow a specific diet during the food survey (6 %) suggests that no important selection of health-conscious subjects occurred. Moreover, the distribution in age and sex classes compares well with the segmentation of the Italian population in 2006 as described by ISTAT(17). Females are slightly over-represented (55 % v. 51 % according to ISTAT), whereas children aged less than 3 years of age (2 % v. 4 % according to ISTAT) and elderly subjects (16 % v. 20 % according to ISTAT) are slightly under-represented. The education level of the study sample is high, with 56 % of subjects aged 11 years or more having a high school or university degree v. 35 % the Italian population as described by ISTAT(18).
Dietary assessment technique
The INRAN-DIARIO3.1(Reference Le Donne, Arcella, Piccinelli, Sette, Berardi and Leclercq9) management system permitted a multi-operator data entry and food codification and at the same time ensured reliable data and a high level of standardization of the field workers’ procedures.
The fact that the field workers met each subject three times and carefully checked every single entry helped to reduce errors such as misreporting and omissions. However, comparison of mean EI:BMRest with the cut-off values derived by Goldberg et al.(Reference Goldberg, Black, Jebb, Cole, Murgatroyd, Coward and Prentice19) for adults (99·7 % confidence interval) suggests that a certain level of under-reporting occurred in this sample and in particular in males. It is noteworthy that these cut-off values are based on the assumption of a PAL of 1·55, which includes desirable physical activity for sedentary adults(10). It may therefore overestimate effective PAL of the adult Italian population. Moreover, EI:BMRest was lower in adult males, where a higher proportion of obese subjects were found. This may be due to the notorious higher degree of under-reporting in obese individuals but also to an overestimate of their BMR, leading to an overestimate of under-reporting. In fact, BMRest based on current body weight may overestimate true BMR in obese individuals since fat body mass is less metabolically active.
No cut-off values for EI:BMRest are available in the literature for the other age classes of the study sample. The observed EI:EE in elderly males and in infants, children and teenagers of both sexes ranged from 0·98 to 1·04 (Table 2), suggesting that no gross under-reporting occurred in these groups. The highest apparent level of under-reporting was in adult males and females and in elderly females.
In the absence of information on the individual activity level of subjects that would allow us to identify under-reporters, no subject was excluded from further analysis. The same decision was taken in the national survey conducted in Ireland in 1997–99(Reference McGowan, Harrington, Kiely, Robson, Livingstone and Gibney20), in which a comparable mean EI:BMRest was observed in adult males and females (1·38).
Food classification
A detailed list of food items included in each category is provided in the Appendix to ensure a correct interpretation of data.
A number of cereal products such as plain pizza with tomato and biscuits were classified as cereal products, whereas they also contain other ingredients (fats, eggs, tomatoes, sugar, etc.). Other cereal products (e.g. pizza with a variety of ingredients, most cakes, some fresh pasta and gnocchi) were handled as recipes and disaggregated into flour and other ingredients. Therefore, consumption values reported in the subcategories ‘Pizza’, ‘Pasta’ and ‘Cakes and sweet snacks’ are underestimates. On the other hand, when food items are classified in a subcategory such as ‘Biscuits’, this leads to an underestimate of the consumption of single ingredients such as flour and sugar in their respective food categories.
The subcategory ‘Sugar’ is related to discretionary sugar (e.g. added by the respondents in coffee) plus sugar from home-made recipes. It does not include sugar present in composite foods such as soft drinks.
Data reported in the category ‘Oils and fats’ include discretionary fats added in a large number of recipes but do not include fats present in a number of composite foods. In Italy, each recipe is traditionally prepared with one specific fat: risotto would be prepared with butter, whereas most sauces used with pasta would be prepared with olive oil. Subjects were asked to report the main ingredients of the recipes on the diaries and standard recipes would generally be used. The proportion of olive oil among vegetable oils in the present survey (93 %) has probably been slightly overestimated. According to data from the Institute for Agricultural Market Studies (ISMEA)(21), in the year 2004, olive oil represented 84 % of the total household purchases of vegetable fats in Italy.
Food consumption pattern
Detailed analyses of the present survey in relation to public health nutrition issues will be performed in the future. As a first step, some of the results can be compared with those population goals established for the prevention of chronic diseases which are expressed in terms of food.
The overall individual consumption of fruit and vegetables in the whole study sample was 208 g/d and 210 g/d, respectively, meeting the minimum population goal of 400 g of fruit and vegetables daily established by FAO/WHO(22).
A goal was recently set for the population average consumption of red meat (beef, pork, lamb and goat from domesticated animals, including that contained in processed foods): it should be less than 300 g/week as cooked meat (approximately 400–450 g as raw weight) for the prevention of colorectal cancer(23). Overall consumption of red meat in the study sample was obtained by adding up fresh beef and veal (42·7 g/d), fresh pork (12·7 g/d), other red meats such as lamb and horse (∼5 g/d) and preserved pork and beef (28 g/d, corresponding to approximately 40 g of raw weight). Overall, the estimated consumption of red meat as raw weight was approximately 700 g/week in the study sample, i.e. significantly higher than the goal.
Choice of descriptive statistics
Food consumption data are often used to characterize average and high levels of consumption within the population. In the case of food categories which are rarely consumed (either consumed by a limited number of individuals in the population or consumed infrequently by all individuals), due to the large number of non-consumers, very low mean values are obtained and the median can be 0. It is therefore important to complement the description of food consumption with that of consumption in the selected sample of ‘consumers’ only.
High levels of consumption were described by providing the 95th and the 99th percentile of the distribution, both in the total population and in consumers only. High percentiles are often needed to estimate dietary exposure to a specific chemical or agent present in food within the process of risk analysis, but caution is needed in the interpretation and use of data due to the short duration of the survey (3 d). In fact, the observed high percentiles of consumption provide an overestimate of long-term high levels of consumption for many food categories whereas the percentage of consumers provides an underestimate of the long-term percentage of consumers.
The reliability of high percentiles is related to the number of subjects used to calculate them. According to Kroes et al.(Reference Kroes, Müller and Lambe24), a high percentile P (expressed as fraction) can be assessed with sufficient precision if the sample size n satisfies the rule n (1−P) ≥ 8. Thus, in Tables 3–11, high percentiles are reported in parentheses when the number of subjects was lower than 160 (for the 95th percentile) or lower than 800 (for the 99th percentile) to spot the high percentile values which bear a high uncertainty.
Conclusion
The present paper provides the main results of the Italian National Food Consumption Survey INRAN-SCAI 2005–06 for use both at national and international level. The database obtained from this survey will be the key reference for Italian food consumption in the coming years and will be utilized for a variety of purposes including the assessment of nutrient intake and risk analysis.
Some specific aspects of the Italian food consumption pattern are confirmed: a very large contribution from olive oil to fats, a large contribution from wine to alcoholic beverages and a large contribution from bread, pasta and pizza to cereals. The observed high level of consumption of red meat deserves attention.
Acknowledgements
Sources of funding: The INRAN-SCAI 2005–06 survey was funded by the Italian Ministry of Agriculture, project ‘Qualità alimentare’. Conflict of interest declaration: The authors declare that they have no conflicts of interest. Authorship responsibilities: A.T. was the coordinator of INRAN-SCAI 2005–06; C.L. was responsible for the data management system of food diaries and wrote the manuscript; D.A. was responsible for the design of the dietary survey; R.P. was responsible for the management of diaries; S.S. carried out the descriptive data analyses; and C.L.D. developed the dietary assessment tools. All co-authors were involved in the interpretation of results and manuscript revision, and all co-authors approved the final version. The whole INRAN-SCAI 2005–06 Study Group was involved in the preparation of dietary assessment tools, in the training and day-to-day support of field workers, in the data checking and in updating the databases. Acknowledgments: The authors are most thankful to the Italian households who participated to the study and to the field workers: C. Aceto, A. Amoroso, L. Berardini, A. Bertolini, F. Bozzo, M.T. Caprile, E. Cravea, F. Del Greco, N. Donati, P. Gasperoni, R. Gaviglia, T. Gaviglia, E. Giorgeri, R. Ienco, E. Innocenti, U. Margiotta, E. Milesi, S. Mollichelli, E. Moratti, S. Notarnicola, G. Parrino, M. Pasi, R. Pastorini, E. Perrelli, P. Perrucci, C. Sedini, S. Silvestri, F. Simonetti, P. Succi, J. Tabacchi and P. Zaganelli. The authors also express their gratitude to Ager-Agro Ambiente Italia and in particular to G. Massimiliani and E. Sauda for the very positive collaboration. The great competence and availability of D. Berardi (DASC sas) who developed the data management system was highly appreciated. P. Buonocore was helpful in the preparation of the manuscript.
Appendix
Food items included in food categories: Italian National Food Consumption Survey INRAN-SCAI 2005–06



