




No CrossRef data available.
Article contents
- Abstract
- EXISTING ESTIMATES OF FRENCH CAPITAL EXPORTS
- CORNERSTONES OF THE CONVENTIONAL WISDOM
- NEW DATA SETS
- PORTFOLIO APPROACH
- RESULTS AND ECONOMIC COMMENTS
- CONCLUSION
- Appendix 1: Econometric Methodology
- Appendix 2: Exchange Rate and Foreign Fixed Income Portfolio Shares Variations
- Appendix 3: Price Indices
- References
The Influences Affecting French Assets Abroad Prior to 1914
Published online by Cambridge University Press: 09 June 2004
Article contents
- Abstract
- EXISTING ESTIMATES OF FRENCH CAPITAL EXPORTS
- CORNERSTONES OF THE CONVENTIONAL WISDOM
- NEW DATA SETS
- PORTFOLIO APPROACH
- RESULTS AND ECONOMIC COMMENTS
- CONCLUSION
- Appendix 1: Econometric Methodology
- Appendix 2: Exchange Rate and Foreign Fixed Income Portfolio Shares Variations
- Appendix 3: Price Indices
- References
Abstract
In this study we show that French foreign investment from the end of the nineteenth century until the eve of the First World War was driven by economic and financial considerations. This refutes the hitherto accepted thesis that French capital exports were motivated by diplomatic and political factors. By using economic modeling that combines microeconomic and econometric approaches, we show that the geographic distribution of French financial flows was consistent with rational economic behavior.
Information
- Type
- ARTICLES
- Information
- Copyright
- © 2004 The Economic History Association
By the late nineteenth century the French Bourse was a well-developed capital market: both foreign and French assets enjoyed equal access to the market and both required the same amount of administrative paperwork and approval.1
Courtois, Traité élémentaire.
Ibid.
Although there were no regulatory restrictions, historians of the Paris market, most notably Maurice Lévy-Leboyer asserted, however, that the financial information available to investors regarding foreign assets was routinely compromised by the informal and ongoing contact between the financial community in Paris and the French Foreign Office or the French government.3
Lévy-Leboyer, La balance des paiements.
Neymarck, “La statistique internationale des valeurs.”
The prewar period was exceptional for French foreign asset purchases. Between 1892 and 1913 foreign asset issues made up nearly 50 percent of the total issues in Paris: ranging from 30 percent in 1900 to 66 percent in 1904.5
Crédit Lyonnais, Un siècle.
Before 1914 the success of foreign issues may be related to the low level of domestic government borrowing between 1890 and 1912. The French government only borrowed 65 million francs in 1896 for the Paris World's Fair in 1900 and 265 million francs in 1901/02 for the Chinese military campaign. No other government loan was issued prior to a 302-million-franc loan in 1912.6
Note that local community borrowing requirements were covered by contract with the Crédit Foncier or the Caisse des dépôts.
French banks played an important role in the diversification of financial assets held by French residents. As the market discount rate banks could charge commercial customers decreased regularly from 5 percent in 1872 to 2 percent in 1892, banks sought activities that were more profitable than intermediation and credit. Fees on security purchases became an important source of profit, the Crédit Lyonnais earning 14.4 million francs from 1910 to 1914 as opposed to 2.5 million francs from 1888 to 1892, for example. At the same time, French banks developed a network of foreign subsidiaries and created “bank associations” to promote foreign security purchases. The Crédit Lyonnais, although well known for its cautious strategy of safeguarding liquidity, became the leader of a banking group to place Emprunts russes: from 1888 to 1894 Russian government bonds became common on the Paris Bourse. Between 1895 and 1901, debentures and share purchases took the place of foreign government bonds. The Banque Ottomane invested in the Ottoman Empire and in the Asian part of the Russian Empire; most notably in railroads. The Société Générale and the Crédit Lyonnais invested in Ukrainian raw mineral production. Between 1902 and 1904, the Banque de Paris et des Pays-Bas was in charge of the Sultan of Morocco's loans. The Banque de l'Union Parisienne funded the Russian iron and steel industry and took control with Schneider of the Russian civil and military semi-finished goods sector. Finally, the Banque pour le Commerce et l'Industrie, the Périer des Mines d'Anzin holding company, the Crédit Mobilier, and the Banque Rothschild took shares in foreign industrial companies in Egypt, Spain, Norway, Belgium, and Latin America.
To date the estimates of French capital exports prior to 1914 have generally been constructed by aggregating current balance of payments surpluses and estimating capital income. The geographic distribution of French investment abroad deduced from these statistics provides the central argument in the prevailing literature: by comparing the differences between British and French investment, the currently accepted view assumes that French investment, which was too committed in the “old continent” and absent from emerging countries, was politically, not economically driven. It has become clear however, that both inappropriate earning estimates and questionable methods have been used to reach these conclusions.
We provide a new set of calculations of investment earnings and estimates of overseas capital stock. Our estimate of the stock of overseas assets is added to the data found in the Archives du Crédit Lyonnais concerning new issues in the Paris market. In addition, we point out that estimates of the stock of overseas assets should incorporate adjustments for changes in the market value of the outstanding assets weighted by the geographical distribution of French foreign assets. In order to make the adjustment for changing market values, we compiled indices for the values of stocks and bonds from security market transactions reported in the financial press, notably L'économiste français. With these new data, we are able to address the issue of whether French capital exports appear to have responded to economic forces. This involves exploring a portfolio view of the flow of French assets abroad. We have found that yield differences and demand for capital in “Europe and its periphery” explain French foreign investment. Econometric testing, using new and improved estimates of French capital exports, reveals that economic variables that influence portfolio choice successfully explain variations in French foreign investment between 1890 and 1914. This finding is in contrast to the existing literature that maintains that political considerations determined the flows of French investment overseas. As a result we conclude that economic not political forces dominated the process of French foreign investment.
EXISTING ESTIMATES OF FRENCH CAPITAL EXPORTS
The flow of capital between France and the rest of the world from 1850 to 1913 is not limited to the balance of payments recorded in the Tableau Général des Douanes. Indeed, only customs statistics for material goods, services, and gold transfers are included in the customs records. The net capital balance actually consists of:
Yearly net purchases of foreign financial assets (portfolio) by residents;
Yearly net purchases of French financial assets (portfolio) by nonresidents;
Yearly net French foreign direct investment abroad;
Yearly net foreign direct investment in France;
Yearly net French commercial and bank loans abroad; and
Yearly net foreign commercial and bank loans received,
which equals the net balance of capital movements.
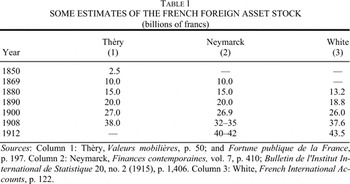
Unfortunately, available primary sources only provide us with the annual net French purchases of foreign financial assets for a few years. This, however, is not a good indicator of the overall movement of capital during this period. To date, three different methods have been used to estimate the overall balance of payments: White's Method, the Financial Analysts' Direct Method, and Lévy-Leboyer's Indirect Method.
White's Method
Harry Dexter White used data on outstanding stock compiled by financial analysts (Neymarck, Leroy-Beaulieu, Raffalovitch, and Théry) at the end of the nineteenth century and published in contemporary financial journals.7
White, French International Accounts.

Furthermore, it is difficult to defend the premise that French international assets and incomes increased regularly without any regard to the changing economic environment: for example, the depression which beset France from 1876 to 1895. Normally, one would expect French capital exports to mirror these cycles, yet White's statistics do not reflect this.
Lévy-Leboyer criticized White for accepting the data provided by these financial analysts who he claimed were not only biased but also guilty of artificially boosting figures in order to retain resident subscribers' confidence.8
Lévy-Leboyer, La balance de paiements; and White, French International Accounts.
Financial Analysts' Direct Method
The Financial Analysts' Direct Method is based on data for new foreign issues in Paris that analysts assume were held in France. However, that was not necessarily the case: assets issued in Paris might have been purchased by investors outside of France. The assumption could lead one to over-estimate the movement of capital. Neymarck makes the ad hoc assumption that nonresidents purchased one-tenth of the assets issued in Paris and others have followed his lead when calculating estimates. Ultimately this unsupported assumption leaves the appraisal of France's net external position on shaky ground with little empirical support.
Additionally, it is difficult to ignore the fact that French residents may have subscribed to foreign assets from nondomestic markets. By contrast, we can assume that British residents did purchase foreign assets in their own domestic market in view of the fact that London was a leading financial market and competitive enough to concentrate the vast majority of foreign issues subscribed to by English residents.9
Feinstein, “Income”; and Edelstein, Rate of Return.
Existing estimates of foreign issues include: 20–22 billion francs in 189810
Salefranque (1900) and Renou, (1906) mentioned by Lévy-Leboyer, La balance des paiements.
de Lavergne, (1908) mentioned by Lévy-Leboyer, La balance des paiements.
Becqué, L'internationalisation.
Neymarck, (1916) mentioned by Lévy-Leboyer, La balance des paiements.
Moulton-Lewis (1922), Meynial (1925), and Caillaux (1926) mentioned by Lévy-Leboyer, La balance des paiements; Feis, Europe; and White, French International Accounts.
Pierre des Essarts studied a sample group of share deposits in the Banque de France and found that the number of foreign assets held by French households in 1897 was 31 percent of the total portfolio.15
Des Essarts, “Les dépôts de titres.”
Essentially, the abundance of questionable statistics prompted Lévy-Leboyer to propose an alternative method called the “indirect” method.16
Lévy-Leboyer, La balance des paiements.
Lévy-Leboyer's Indirect Method
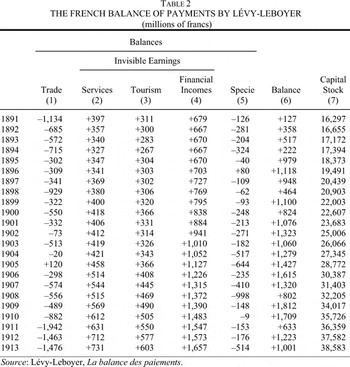
Lévy-Leboyer reacted to the uncertain estimates of the Direct Method with an indirect estimate based on the balance of payments, which is similar to the method Albert Imlah used for Britain.17
Imlah, Economic Elements.
Lévy-Leboyer, La balance des paiements.

Financial incomes logically depend on the invested stock of capital, the capital return rate, and the reinvested earnings. Lévy-Leboyer focused on the capital return rate and assumed that French foreign assets earned between the domestic asset yield in the Paris market and the rate of return on foreign British investment. He identified two periods: during the first period, from 1850 to 1876, he assumed that the rate of return on French capital exports equaled the domestic rate; during the second period, from 1877 to 1913, he considered the rate of return to be the arithmetical average of the French domestic and the British foreign investment rates of return. As opposed to the British, the French rarely invested in new countries with booming growth, therefore their profit on foreign investments must have been less than that of their British counterparts. After a financial loss correction for several years, Lévy-Leboyer arrived at the financial incomes in column 4, Table 2. By adding up partial balances (goods, services, and specie), we obtain the “net foreign direct investment” balance. The transition from flows to stock is derived from adding up the annual balances in column 6, assuming a net external position equal to zero in 1833.
This choice, however, is arbitrary and needs to be examined.19
In order to improve Lévy-Leboyer's procedure, Saint-Marc (Histoire monétaire) estimated the return rate on French foreign investments using tax paid to the French tax administration. The problem with this method is that, over this period of time, foreign government assets held by residents were exempted from tax. However, according to several sources, they represented approximately three-fourths of total French foreign investments. The rate calculated by Saint-Marc is only available for shares. Moreover, one must not neglect incorrect declaration for tax evasion purposes. Actually, Saint-Marc also used a very empirical and questionable method (not theoretically justified) to extrapolate the rate of return on foreign bonds from domestic share and bond prices. The rate of return of foreign bonds is calculated as follows: let a be the ratio of the domestic bond price index to the domestic share price index; then, the rate of return on foreign bonds is assumed to be equal to: (rate of return on foreign shares/a) x 100.
CORNERSTONES OF THE CONVENTIONAL WISDOM
The Assertion of French Foreign Investment Economic Inconsistency
On the basis of his statistics, Lévy-Leboyer developed three major ideas: there were consistent levels of French capital exports; French foreign investment was funded by returns on previous portfolio investments and the geographical distribution of French foreign investments was not driven by economic factors.
First, the hypothesis of consistent French capital exports is no longer tenable. Three different economic periods can be distinguished. First, during the 1860s strong growth of capital exports was associated with global railroad expansion. A period of slowdown followed from 1876 to 1895, corresponding to the great depression affecting France at the end of the nineteenth century.20
The term “great depression” we use for the period from mid-1870s to the mid-1890s has long been dropped from American and British economic history because this period cannot be identified securely in either price deflated GDP or unemployment data. It can however be identified in the French data. The French “great depression” is not a global or Western European one.
Secondly, Lévy-Leboyer found that French investment abroad was funded by returns on previous portfolio investments. According to his calculations, capital income reached 211 percent of the total capital exports during the 1880s.21
This amount is deduced from financial income and capital export, which are both estimated.
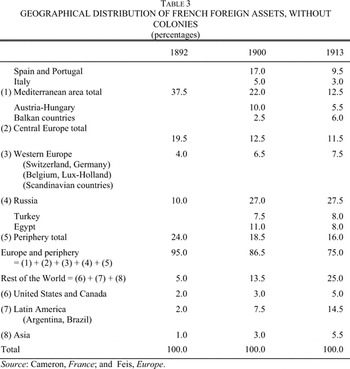
And finally, Lévy-Leboyer argued that the geographical distribution of French foreign investments (Table 3) was not driven by economic motives. Comparing the geographical distribution of French foreign assets to that of British foreign assets, there is a clear predominance of French establishments in Eastern and Southern Europe, and a failure to invest in “younger countries” where the British invested 40 percent of their much larger total investment abroad between 1900 and 1913. In this view, a booming world was closed to French capital, and France remained disconnected from the international dynamics of capital flows to the New World.

Table 3 presents the geographical distribution of French foreign investments calculated by Rondo Cameron for the year 1892 and by Herbert Feis for the years 1900 and 1913, excluding colonial investment, which represented 5 percent in 1892 and 8 percent in 1913.22
Cameron, France; and Feis, Europe, the World's Banker.
In Lévy-Leboyer's data in Table 3, a European preference seems to dominate. However, this tends to decrease by the end of the period in favor of “emerging countries.” According to Lévy-Leboyer, France remained too committed on the old continent, and did not manage to diversify its external investment. He judged this geographical polarization as being inefficient, too risky, and inconsistent with commercial flows. Lévy-Leboyer maintained that France neglected considerations of profitability in setting up business abroad. In order to corroborate this hypothesis, Lévy-Leboyer calculated the correlation coefficient (R2) between the French bond return rate and French foreign capital exports. From 1876 to 1895, when these capital export movements were quite low, French foreign investments seemed to grow as French domestic rates decreased. The correlation coefficient (R2) had the right negative sign. But for the rest of the period, from 1840 to 1875 and from 1896 to 1913, the coefficient had the “wrong” positive sign. French capital exports grew with domestic yields. Based on these statistical yields, Lévy-Leboyer rejected the financial explanation of French capital relocation.
Lévy-Leboyer's use of interest rate levels would seem to be an inappropriate indicator to choose when selecting assets.
Political Forces Dominated the Process of French Foreign Investment
The existing literature tends to contrast major creditor countries.23
Germany is outside the scope of our study.
Simon, Pattern.
Feis, Europe.
In short, the financial transactions between Western Europe and the other areas were an important element in political affairs. They became all the more important as the official circles of lending countries gradually came to envisage their citizens' foreign investments, not as private financial transactions, but as one of the instruments through which national destiny was achieved. Financial force was often used to buy or build political friendship or alliance, was often lent or withheld in accordance with political considerations.
The idea that politics and diplomacy were significantly more influential in France than in Great-Britain, a concept first expressed by Feis and later extended by White and Cameron, constitutes the core proposition of the “older literature.” This thesis relies entirely on the geographical orientation of French capital abroad. France neglected booming economies such as the United States, Canada, Australia, and South-Africa while concentrating on less dynamic areas such as Southern and Eastern Europe, Russia, the Ottoman Empire, and Egypt. Lévy-Leboyer turned these choices into the thesis of “economic inconsistency” when they were compared to those made by the British. The geographical location of its financial investments abroad indicates that France wanted to underwrite its hegemony within its sphere of influence with private direct and portfolio investments in Russia or in the Balkans to complement its political and diplomatic alliances with these countries.
This one-dimensional explanation of the differences between British and French capital exports overlooks many considerations. First, there are similarities between France and Great Britain: colonial investment was particularly low for France (see Table 3) as it was for Great Britain, which weakens the political argument in both cases. Secondly, one should be cautious in accepting the stringent distinction the older literature tends to make between flows to European governments (in other words, characterizing French investment abroad), and flows to the private sector in the New World (in other words, mainly representative of British investment abroad). As Ragnar Nurkse noted, British government involvement, notably in foreign railroads, the largest category of private-sector borrowing, could have existed indirectly through grants, subsidies, or loan guarantees.26
Nurkse, “International Investment.”
Clemens and Williamson, Where did British Foreign Capital.
As Albert Fishlow pointed out:28
Fishlow, Lessons, p. 408.
The vision first expressed by Feis is only partial. Moreover, it impedes rather than facilitates our understanding of capital flows; Unproductive borrowing-different from infrastructure investment, was not necessarily unprofitable lending: high returns on this kind of investment were possible.
It is important to understand that French investment in Russia did not merely respond to political signals: there was a surge in industrialization dating from the 1890s. The fact that capital flows were channeled from particular countries for overt political advantage does not necessarily imply that the flows lacked economic basis, and that is the second point to remember, capital could be elicited from France not merely because of the warmth of Franco-Russian relations but also because of the obvious improvement in Russian economic fundamentals. Russian revenues, despite Feis's view, were expanding at a favorable rate.
We intend to follow Fishlow's lead and test whether or not economic arguments can explain why Europe attracted French investments. Ideally, we would like to be able to include political variables in our test, which would make it easier to evaluate the currently accepted view. Unfortunately, the core proposition of the older literature was not actually tested but simply extrapolated from the geographical distribution of French capital exports. In fact, assessing this thesis directly appears to be impossible as its core proposition is not statistically testable because political assumptions cannot be operationally defined. Explanatory variables cannot be constructed in a way that would permit them to be used in a regression involving either political or diplomatic influences. What dummy variable would capture what Neymarck described as “informal contacts” between the French government and the Bourse de Paris?29
Neymarck, La statistique internationale de valeurs.
NEW DATA SETS
The first step in our investigation of French overseas lending consists of estimating an improved series for the stock and rate of return in French foreign assets.
Shares and Bonds Index and Rates of Return on Foreign Assets Held by Residents
On a weekly basis, L'Economiste Français indicated the prices of the “leading foreign bonds” (principaux fonds étrangers) for fixed income assets and “main foreign shares issued on the Paris Stock Exchange” (principales actions étrangères côtées à la Bourse de Paris) from 1873 to 1913. We have used these data to construct two separate indices: one for the price of foreign stocks and one for the price of foreign bonds. The foreign bond index is a simple arithmetic annual average of the prices on the last day of the year for 18 foreign bonds issued in Paris at various times between 1873 and 1913 (Spain 4 percent, Italy 5 percent, Austria 4 percent and 5 percent, Hungary 4 percent, Greece 5 percent and 4 percent, Germany 3 percent, Great Britain 3 percent, Norway 3 percent, Sweden 3.5 percent, Russia 4 percent and 5 percent, The Ottoman Empire 4 percent, Egypt 4 percent and 4.5 percent, Argentina 5 percent, and Brazil 4 percent). The foreign stock index is a simple arithmetic mean of the prices of six European railway shares on the last day of each year, including northern and southern Spain, northern and southern Italy, the Austrian Empire, and Portugal.
These two indices contain the most representative shares and bonds published by L'Economiste Français, but they do present certain limitations. First; a very small number of assets represents each country. Additionally, a single asset is often assumed to represent one country. Finally, many countries are not represented in either the stock or bond index. Unfortunately, no other source regularly published the foreign assets issued in Paris from the end of the nineteenth century to the first World War; so we are forced to use the available economic information found in L'économiste français, and to consider this as leading assets.30
We obviously have a shorter list than the Dow-Jones 30 industrials but if one makes the usual assumptions about market integration, the short list of assets included in our indices are well arbitraged with all the other important assets actively traded on the Bourse. The fact has to be pointed out that trading across assets means there are strong market currents, which are picked up in the valuations of leading assets.

INDICES OF PRICES OF FOREIGN BONDS AND FOREIGN STOCKS IN PARIS
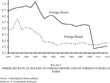
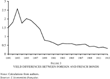
The observed yield for each foreign bond has been calculated as the ratio of coupon to price and the rate of return index as the simple arithmetic mean. We chose this simplification for three reasons. First, the amount of each subscription is unknown. Second, although calculating the return at maturity on each foreign bond would have been more rigorous, it is not possible as the data necessary for such a calculation are incomplete. In order to do this we would need to know the amount of the coupon, the dates of distribution of this coupon which are unknown for several bonds in this group, the redemption price of the bond if it was redeemable (some were), the price at the end of the year, and the advance redemption possibility, which must not be undervalued because it may significantly increase the return rate. Rather than limit our sample to those bonds on which we can calculate actuarial returns we have decided to consider a larger number of assets because portfolio diversification played a key role. Finally, because we are looking at a period of just over 20 years, from 1891 to 1913, we have decided to consider them as perpetual rents. In this case, the actuarial rate of return can be approximated by the coupon to price ratio. Thus, in this data-constrained simplification, calculating the coupon to price ratio is technically justified.
For stocks, we calculated a similar ratio.31
The estimator of annual returns adopted here is deliberately calculated as the ratio “dividends/stock price” in order to avoid a risk of statistical correlation in our regressions. Indeed, capital gains and losses are already taken into account in our calculated stock of overseas assets which incorporates adjustments for change in market value of the outstanding assets. As developed in the section “a portfolio approach,” this estimator implicitly assumes that the typical investor implements a simple type of holding behavior and portfolio construction.

OBSERVED RATE OF RETURN OF FOREIGN BONDS AND OF FOREIGN STOCKS IN PARIS

YIELD DIFFERENCES BETWEEN FOREIGN AND FRENCH BONDS
Stock in French Foreign Assets
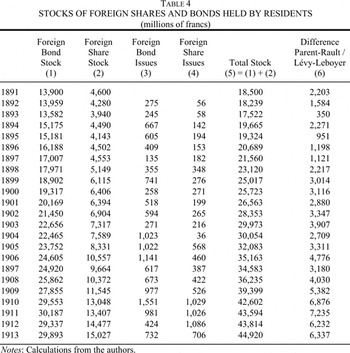
Our estimates of French foreign stocks are based on data on new issues: a rehabilitation of the direct method of estimation. Françoise Marnata's studies provided us with residents' foreign shares and bond subscriptions from 1892 to 1913.32
Marnata, La bourse.
The construction of estimates for the stock in overseas assets, however, does raise some statistical problems. First, we need an estimate of the initial stock. Lévy-Leboyer supposed a stock equal to zero in 1833.
33Lévy-Leboyer, La balance de paiements.

where: St is the stock of portfolio outflows at date t, and Ft is the corresponding flow.
In order to obtain a stock at market value, which is appropriate for portfolio analysis, we have: set the initial stock in 1891 according to financial analysts=estimates; used the annual flows calculated by Marnata after this date; adjusted the market value of the stock using share and bond prices published by L'Economiste Français weighted by the geographical distribution of French foreign assets (from Table 3).
Our procedure can be summarized as follows:

where: SFBt is the “Stock of Foreign Bonds”; FFBt is the associated flow calculated by Marnata, with figures expressed in French francs; SFSt is the “Stock of Foreign Shares”; and FFSt is the associated flow calculated by Marnata, with figures expressed in French francs.
For the year beginning 1891, we consider a stock equal to the simple average of all estimates published for this year by financial analysts, following Marnata's assumed portfolio of three-fourths bonds and one-fourth shares in 1891.
FBPIt is the “Foreign Bond Price Index” calculated from L'Economiste français weighted by the geographical distribution of French foreign assets (from Table 3).
FSPIt is the “Foreign Share Price Index” calculated from L'Economiste français weighted by the geographical distribution of French foreign assets (from Table 3). See Table 4 and Figure 4.


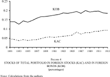
STOCKS OF TOTAL PORTFOLIO IN FOREIGN STOCKS (KAC) AND IN FOREIGN BONDS (KOB)
Estimating the value of foreign financial assets is a prerequisite to making an appropriate portfolio analysis. According to the portfolio theoretical analysis, arbitrage concerns the portion of the global portfolio held in foreign assets.34
The nonforeign asset holding in the overall portfolio refers to the Paris domestic stock and bond market capitalization; the data can be found in Saint-Marc, Histoire monétaire; and Bourguignon and Lévy-Leboyer, L'Economie française.
PORTFOLIO APPROACH
Our goal is to test the significance of economic factors in the determination of France's foreign investment by using a portfolio model. We follow the pioneering work of Michael Edelstein on British capital exports in the age of “high imperialism.”35
Edelstein, “Determinants.”
Previous Use of this Methodological Framework in Historical Analysis
Edelstein developed a portfolio model evaluating the microeconomic foundations of English foreign investments during the period from 1870 to 1913. In his model, Edelstein focused on English demand for stock in American railways which was Great Britain's main investment abroad during this period.36
Ibid.
We would like to follow Edelstein's method of investigating the driving forces behind English capital exports and his formulation of the debate in terms of “push or pull factors.”37
Ibid.
Cameron, France; and Lévy-Leboyer, La balance des paiements.
Issues in Applying Economic Modeling to Historical Data
Basic international portfolio models (CAPM) give the appropriate framework to answer our questions. The microeconomic basis of the portfolio approach establishes that asset demand functions in foreign currencies depend on speculative and hedging investment behavior. The optimal portfolio is divided into two parts: one insensitive to yields (usually qualified by minimum variance) reflecting risk aversion; the other, called speculative portfolio, sensitive to yield expectancies.39
Adler and Dumas, “International Portfolio Choice.
Kouri, “Exchange Rate.”
Implementing this theoretical framework requires the following: The shares of foreign funds and equities in the global portfolio, the exchange rate of the Franc against a panel of currencies, and domestic and foreign observed yields.
Collecting appropriate data on these variables presents some practical problems.
One might conclude that exchange rate hedging is a simple problem because this period is situated during the gold exchange standard, an era characterized by fixed exchange rates. However, Marc Flandreau and Jacques Le Cacheux showed that in Europe, during the gold standard and despite gold convertibility, exchange rate risk existed.41
Flandreau and Le Cacheux, “La convergence.”
The exchange rate estimator of the Franc is quoted au certain against a panel of currencies, according to the global destination of French capital export. The countries included in this panel are: Great Britain, Austria, Switzerland, Germany, Netherlands, Belgium, Spain, Italy, Russia, the Ottoman Empire, Egypt, and the United States, each currency being identically weighted by 1/12 over the 1890–1913 period. Thus the constant weight of each currency over the period reflects the global structure of French capital export, not its change through time. This choice can be explained as follows: weighting each year the exchange rate estimator by the year geographical structure of French capital export could introduce a statistical correlation between “KOB” and “e”, which could lead to an overestimation of the impact of the exchange rate in the KOB regression.
A second problem concerns the relationship between observed return rates (calculated as the ratio of coupon to price) and expected return rates appropriate for investment decisions. Here, we are restricted by data and forced to make a difficult choice. We assume, as others have, that economic agents have rational and true expectations (in other words, what they plan actually occurs). Therefore, in our econometric test, this enables us to take the calculated rate of return of the t+1 year as an indicator of the expected rate of return in t.
Last but not least, objections can be made concerning the relevance of a portfolio approach applied to an annual series of capital stock and yields. Arbitrage and portfolio choices are usually supposed to concern a short-term horizon (a monthly or even daily adjustment). Nevertheless, as legitimate as this objection may be, we feel that the periodicity of historical data should not prevent one from learning about the past by using economic modeling.
Empirical Investigation
Given the models presented, two tests have to be carried out: one concerning foreign fixed income financial assets and the other concerning foreign variable income financial assets held by French residents. In the former case, the endogenous variable is the “ratio of foreign bonds to total French and foreign assets held by French residents.” In the latter, it is the “ratio of foreign equities to total French and foreign assets held by French residents.” In both cases, two kinds of variables will be tested as explanatory factors of the variations in these shares:
Financial variables: the expected rate of return on domestic and foreign assets. According to international CAPM models, these two rates of return emphasize speculative behavior. Very often, empirical portfolio models wrongly take only short-term yield differences into account; Here, only long-term yields are used, which is economically justified as specie, with short-term capital flows, are excluded from the calculated stock; and
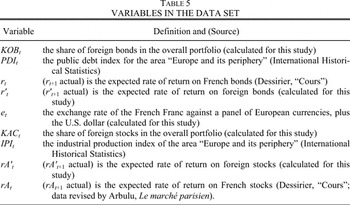
Nominal variables: a weighted exchange rate and variables for “pull factors” (Public Debt Index (PDI) in “Europe and its periphery area” in the case of foreign fixed income assets, and Industrial Production Index (IPI) of the same area for foreign shares).43
The Industrial Production Index of “Europe and its periphery” is an estimator of “pull factors” that can play a role in foreign variable income financial asset allocation. The same source, method and countries as for PDI are used for IPI index.
International Historical Statistics.
The data set is composed of variables that are all annual series covering the 1890 to 1913 period (see Table 5).

RESULTS AND ECONOMIC COMMENTS
Time Series Properties of Variables
The analysis of the stationarity of the series is an essential step to determine the correct econometric specification to implement in our study. A stationary series is characterized by a time-invariant mean and a time-invariant variance. We have implemented three unit root tests.45
There are alternative methods to test the nonstationarity of a time series. In this subsection, the following three well-known and widely used techniques are applied to determine whether the variables are stationary or nonstationary: The Schmidt and Phillips test; the Kwiatkowsky, Phillips, and Shin test (KPSS); and the efficient unit-root tests suggested by Elliott, Rothenberg, and Stock. An elaborate discussion can be found in Schmidt and Phillips, “LM Tests”; Kwiatkowsky, Phillips, and Shin, “Testing for the Null Hypothesis”; and Elliott, Rothenberg, and Stock, “Efficient Tests,” respectively.
They are available upon request.
Note that this result must be taken with some caution given the small number of observations used for implementing unit-root tests (23). Indeed, attempts to conclusively prove the existence of such unit-roots usually require a great number of observations (more than 100). In spite of this restriction, we think, however, that these tests, which we only apply for purely descriptive purposes, can give a first indication on the statistical properties of the data.
Parsimonious Dynamic Models and Economic Interpretation
Having demonstrated the presence of a unit-root in all series of our data set, we now test whether these variables are cointegrated. We present the results of the two error correction models appropriate for the analysis of cointegrated times-series. The former concerns the share of foreign bonds, and the latter the share of foreign stocks held by French residents. More precisely, the objective is to study the interdependence between these variables taken in levels, without making any a priori hypothesis on the value of the coefficients linking them, and testing the existence of long-term relationships.
For each hypothesis to be tested, the database is respectively composed of KOB, r′, r, PDI, e, and KAC, rA′, rA, IPI, e.48
In the estimations reported below, the variable “e” does not appear in the equation for KAC because it turns out not to be significant neither in the short and long run of the ECM model.
The econometric methodology adopted here (see Appendix 1 for further details) yields our two final models (estimated with maximum likelihood) with parsimonious dynamics,
49This means that in our regression presented here all coefficients not significant at the 5-percent level have been eliminated. To see the complete equation, see Appendix 1.
We confined ourselves to a limited number of explanatory variables because the maximum likelihood methods require a small number of variables to give efficient results.
It must be underlined that the constant, included in both estimated models, either in the short or the long run, catches the influences of omitted variables (such as political or diplomatic variables, which are nearly impossible to measure correctly, see our conclusion).
The t-statistics in parentheses are for the null hypothesis that the estimated coefficient is equal to zero. Let us notice that in this canonical representation of error correction models, which includes both the short- and long-run dimensions, the signs of the long-run coefficients are of course reversed in comparison to the long-run structural expression presented in Appendix 1, that is:


This model enables us to reconstruct the economic motives of French financial property abroad:
In the long term, French assets invested abroad follow the level of public debt in “Europe and its periphery,” indicating a “pull effect.” One may think that the importance of international public debt issued by these nearby countries as well as its broad diffusion in Paris guaranteed strong liquidity for these assets, and constitute a factor of safety for French investors. In addition to this economic factor, one also finds financial components explaining French foreign asset behavior. The share of foreign fixed-income financial assets in the global portfolio is positively correlated to the expected return on foreign assets and negatively correlated to expected returns on domestic investment, which is consistent with the portfolio theory.53
We recall that we made a strong rational expectation assumption according to which agents correctly anticipate in the year n the effective rate of return which will occur the year n+1. The expected rate of return series that we calculated takes this a priori assumption into account. The econometric results produce the expected results of the portfolio theory since the share of Foreign assets in the global portfolio is positively (negatively) correlated with Foreign (Domestic) expected rate of return.
In the short term, we notice the influence of public debt variation, which means that the French demand for this kind of asset grows with European public supply. The exchange rate emerges as a short-term explanatory variable but it is insignificant in the long term. In dynamics, the portfolio of foreign fixed-income financial assets positively reacts to the variation of the French exchange rate: an increase in the value of the French franc against that of other currencies in the panel facilitates foreign asset purchase by residents. Finally, one finds in dynamics the positive impact of the variation of the expected rate of return on foreign assets: The more this expected rate of return increases, the more likely it is that residents will hold foreign assets, which conforms to theoretical predictions.
Our results are consistent with the following mechanism: The long-term objective of the French investor (here, the share of foreign bonds in the overall portfolio) is negatively correlated with the level of domestic expected rates of return; it is however; positively correlated to the anticipated level of foreign rates of return, and also positively correlated to the public sector borrowing requirements of “Europe and its periphery.” In the short term, the investor corrects the distance to this long-term target according to the variation of the domestic rate of exchange, the variation of the public-sector borrowing requirements of the area, and the variation of foreign assets' expected rate of return (all signs correctly oriented). Thus, it has been possible to highlight the economic and financial arguments underlying the diversification of French capital abroad from the turn of the nineteenth century until 1914.
For the second model concerning the share of foreign stocks held by French residents in the overall portfolio, we obtain the following parsimonious dynamic specification:
54The t-statistics in parentheses are for the null hypothesis that the estimated coefficient is equal to zero.

Here again, the estimated model conforms to theoretical predictions. In the long-term relationship, it appears that the share of foreign stocks held by French residents in the overall portfolio responds positively (responds negatively) to the level of the foreign (French) expected rate of return. As previously seen, beside financial components of the French asset demand, one finds a “pull effect,” which is linked in this case to the level of the industrial production in the area. This result seems very logical as growth perspectives in the area sustain the residents' demand for foreign shares. In the short term, it must be noted that the lagged dependent variable is the only one to intervene in the relationship. Investors adapt their behavior according to the past variation of the portfolio held in foreign shares. Moreover, one can note that the adjustment to the target is relatively short (one period).
CONCLUSION
The current study has attempted to investigate the influences affecting French assets abroad prior to 1914. Our findings are not far from Clemens and Williamson's concerning British capital exports.55
Clemens and Williamson, Where Did British Foreign Capital.
Contrary to the usual conclusions about France's foreign investment, which insist on political or diplomatic considerations, we have been able to emphasize the role of economic and financial factors in French capital exports prior to 1914 by combining microeconomic and econometric approaches. To reassess the French financial position in the world before World War I, we have used economic or financial explanatory variables exclusively. This study, following Edelstein, has tried to uncover the economic motives of French investors.56
Edelstein, “Determinants.”
Appendix 1: Econometric Methodology
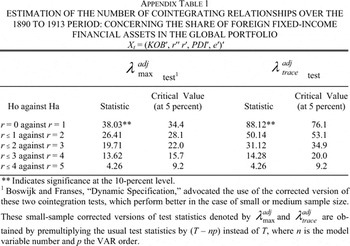
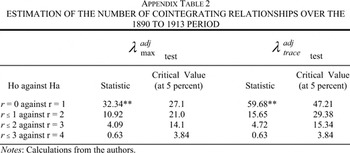
Test of the Number of Cointegrating Relationships
The lag length choice used in the specification of the two unrestricted Vector Error Correction Model (VAR-ECM) is based on the results of two criteria (Schwarz' Bayesian information criterion and Hannan-Quinn criterion), and on global Fisher tests. These different methods all indicate an optimal value of one year for the two models. Once the lag length used in VAR-ECM model specification has been determined, the next step is to test the number of cointegrating relationships existing between the variables of the two systems. At this stage, a prior point must be emphasized: The asymptotic distributions of the cointegration tests depend on the possible presence of a constant or a linear trend in long-run relationships. To know how to model these deterministic components, one can possibly use the results of the sequences of standard unit-root tests applied previously and especially the Schmidt-Phillips tests which have not rejected the possibility that some of these series have a linear drift.57
Schmidt and Phillips, “LM Tests.”
The Lambda max test statistic is the likelihood ratio of the null hypothesis H2 (r) : [Lt ] there exist at most r cointegration relations [Gt ] against the alternative hypothesis H2 (r+1) : [Lt ] there exist at most r+1 cointegration relations[Gt ], and the Trace test statistic is the likelihood ratio of the null hypothesis H2 (r) against the alternative hypothesis H1 (n) [Lt ] there exist n cointegration relations [Gt ], with r=n, … , 0. Johansen, “Statistical Analysis” and Likelihood-Based Inference, respectively.

Concerning the share of foreign variable income financial assets held by residents in the global portfolio:
59The symbol ′ denotes the transposition of the series vector.

The test statistics indicate in both cases the existence of one cointegrating relationship between the variables being investigated (see Appendix Table 2). Note that this result was not straightforward because, as was shown by Robert Engle and Clive Granger, up to four long-run relationships between five variables can exist.60
Engle and Granger, “Cointegration.”

Weakly Exogenous Variables and Variables Excluded from Cointegrating Space
In order to give reasonable power to the tests on short-run and long-run coefficients to be carried out later, we begin by trying to impose some congruent weak exogeneity assumptions about the model.61
See Pradel and Rault, “Exogeneity,” for further details on weak-exogeneity.
Greenslade, Hall, and Henry, “On the Identification.”
Our two theoretical models concerning the share of foreign fixed-income financial assets in the global portfolio, and the share of foreign variable-income financial assets held by residents in the global portfolio, suggest that four out of the five variables for the former, and three out of four variables for the latter should be weakly exogenous. Indeed in both cases the endogenous variable is respectively KOB and KAC. These theoretical predictions are confirmed by data at a 5-percent level of significance as we obtain a test statistic of χ2 (4)=8.97 (probability 0.0619) for the joint hypothesis that r′, r, PDI, and e are weakly exogenous, and a test statistic of χ2 (3)=7.82 (probability 0.0502) for the joint hypothesis that rA′, rA, and IPI are weakly exogenous. On the basis of this evidence, we then assume that these variables are weakly exogenous for the parameters of the conditional model and set up in each case a single equation conditional model respectively composed of KOB and KAC conditionally on the five and four equations describing the evolution of the weakly exogenous variables (r′, r, PDI, and e) and (rA′, rA, and IPI). It is actually now well known that the short-run and long-run parameters of conditional models can be estimated without loss of information from the conditional model alone—without taking the data generating process of the weakly exogenous variables into account.
In a second step, we apply a sequence of tests in order to determine whether some variables of the two estimated VAR-ECM models can be considered as not belonging to the long-run relationship established previously. For our second model related to the share of foreign variable income financial assets held by residents in the overall portfolio, these tests indicate that at a 5-percent level of significance all the four variables belong effectively to the cointegrating space. On the contrary, as far as our first model related to the share of foreign fixed-income financial assets in the global portfolio is concerned, the exclusion hypothesis of the cointegration space of e is easily accepted by data at a 5-percent level, as the marginal asymptotic level is of 45 percent (χ2 (1)=0.56 (probability 0.45). The exchange rate of French franc (e) is thus both weakly exogenous and excluded from the cointegrating space, which means that it has an influence only on the short run dynamic of the share of foreign fixed income financial assets in the overall portfolio.63
The results presented here have been obtained for some of them after several iterations. In fact, one weakly exogenous variable (e) has been shown moreover not to belong to the cointegrating space. We have found it more logical to take step by step these two pieces of information into account: for this purpose, we have first estimated a VAR-ECM in which e only appeared in the short-run dynamic, and have then retested in this framework, whether the other variables belonged to the cointegrating space or not.
Finally in the third step, we normalize the coefficient of KOB and KAC to one in the appropriate model, in order to ensure just identification of the unique long–run relationship detected in each case. It is indeed now well known that if the cointegrating space is of order one, normalization is sufficient to ensure just-identification of the cointegrating relationship, and then, any additional restriction is an over-identifying testable restriction. After normalization, the just-identified long run relation is given by:
For the model concerning the share of foreign fixed income financial assets in the global portfolio:
64The t-statistics in parentheses are for the null hypothesis that the estimated coefficient is equal to zero.

For the model concerning the share of foreign variable income financial assets held by residents in the global portfolio:
65The t-statistics in parentheses are for the null hypothesis that the estimated coefficient is equal to zero.

Parsimonious Dynamic Models and Economic Interpretation
We now proceed to a model with a parsimonious dynamic structure. We seek a set of data based simplifications on the dynamics of the two estimated VAR-ECM models that do not lead to any undesirable properties of the residuals. This approach leads us to exclude variables with individual t ratios less than 1.96. This then yields our two final models (estimated by maximum likelihood) with parsimonious dynamics, and fully identified long-run relationships, which conform to our theoretical priors.66
On maximum likelihood estimation, see Johansen, Likelihood-Based Inference.
The former concerning the share of foreign fixed-income financial assets in the global portfolio is given by:
67The t-statistics in parentheses are for the null hypothesis that the estimated coefficient is equal to zero.

For the latter concerning the share of foreign variable income financial assets held by residents in the global portfolio, we obtain the following parsimonious dynamic specification:
68The t-statistics in parentheses are for the null hypothesis that the estimated coefficient is equal to zero.

Appendix 2: Exchange Rate and Foreign Fixed Income Portfolio Shares Variations
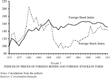
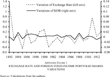
Appendix Figure 1 shows that the exchange rate indicator of the franc calculated against 12 foreign currencies and Foreign Fixed Income Portfolio Shares (KOB) have similar variations over time. This illustrates the correlation between these two series. However, this should not be over-interpreted because the exchange rate is only one of the explanatory variables in the KOB equation.

EXCHANGE RATE AND FOREIGN FIXED-INCOME PORTFOLIO SHARES VARIATIONS
Appendix 3: Price Indices

We wish to thank Michael D. Bordo, Pierre Sicsic, Pierre-Cyrille Hautcoeur, M. T. Boyer, Ghislain Deleplace, L. Gillard, and three anonymous referees for helpful comments and suggestions on earlier drafts of this article. We are also deeply grateful to editor Knick Harley, to Neil Gilbert, and to Diane Falck for patient reading and editorial assistance. All remaining errors and inadequacies are our own.
References
Annuaire Statistique
Adler M., and
Dumas B.
“International Portfolio Choice and Corporation Finance: A Synthesis.”
Journal of Finance
38,
no. 3
(June 1983):
925–
84.
Arbulu P.
1998
Le marché parisien des actions au 19ème siècle: performance et efficience d'un marché émergent.
Thèse de Doctorat,
Université d'Orléans
Becqué Emile.
1912
L'internationalisation des capitaux.
Paris:
Impr. Générale du midi,
Bloomfield Arthur I.
1968
Patterns of Fluctuation in International Investment before 1914.
Princeton Studies in International Finance, no. 21,
Princeton University
Bordo Michael D., and
Hugh Rockoff.
1996
“The Gold Standard as a ‘Good Housekeeping Seal of Approval.’”
This Journal
56,
no. 2
389–
428.Google Scholar
Bordo Michael D., and
Finn E. Kydland.
1995
“The Gold Standard as a Rule: An Essay in Exploration.”
Explorations in Economic History
32
(October):
423–64.Google Scholar
Bordo Michael D., and
Anna J. Schwartz.
1996
“The Operation of the Specie Standard: Evidence for Core and Peripheral Countries 1880–1990.”
In Currency Convertibility: The Gold Standard and Beyond
edited by Jorge Braga de Macedo,
Barry Eichengreen, and
Jaime Reis.
New York:
Rutledge
Boswijk Peter, and
Philip Hans Franses.
1992
“Dynamic Specification and Cointegration.”
Oxford Bulletin of Economics and Statistics
54,
no. 3
369–81.Google Scholar
Bourguignon François, and
Maurice Levy-Leboyer.
1986
L'Economie française au 19ème siècle, analyse macro-économique.
Paris:
Economica
Bulletin de statistique et de législation comparée (revue)
Cameron R.
1961
France and the Economic Development of Europe, 1800–1914.
Princeton, NJ:
Princeton University Press
Clemens Michael A., and
Jeffrey G. Williamson.
“Where Did British Foreign Capital Go? Fundamentals, Failures and the Lucas Paradox, 1870–1913.”
NBER Working Paper 8028, December, 2000.
Courtois A.
1910
Traité élémentaire des opérations de bourse et de change,
Paris
1963
Crédit Lyonnais: Un siècle d'économie française (1863–1963).
Paris:
Draeger
Denuc J.
1934
“Dividendes, valeur boursière et taux de capitalisation des valeurs mobilières françaises de 1857 à 1932.”
Bulletin de la Statistique Générale de la FranceGoogle Scholar
Dessirier J.
1927
“Cours, revenu et taux de capitalisation des valeurs mobilières françaises.”
Journal de la Société Statistique de Paris
69,
no. 6 (June):
184–91.Google Scholar
Dessirier J.
1928
“La prévision statistique des mouvements des valeurs de bourse.”
Journal de la Société Statistique de Paris
70,
no. 5 (May):
153–94.Google Scholar
Dessirier J.
1929
“Nouveaux essais de statistiques sur les mouvements boursiers.”
Journal de la Société Statistique de Paris
71,
no. 2 (February):
35–
94.Google Scholar
L'économiste français.
des Essarts Pierre.
1897
“Les dépôts de titres à la Banque de France.”
Journal de la Société Statistique de Paris
38,
no. 10 (October):
321–30.Google Scholar
Edelstein Michael.
1970
“The Rate of Return on U.K. Home and Foreign Investment, 1870–1913.”
Ph.D. diss.,
University of Pennsylvania
Edelstein Michael.
1974
“The Determinants of U.K. Investment Abroad, 1870–1913: The U.S. Case.”
This JOURNAL,
34
no. 4:
980–
1007.Google Scholar
Edelstein Michael.
1977
“Realized Rates of Return on U.K. Home and Overseas Portfolio Investment in the Age of High Imperialism.”
Explorations in Economic History
13Google Scholar
Edelstein Michael.
1982
Overseas Investments in the Age of High Imperialism: The United Kingdom, 1850–1914.
New York:
Columbia University Press
Eichengreen Barry.
1996
Globalizing Capital: A History of the International Monetary System.
Princeton, NJ:
Princeton University Press
Elliott Graham,
Thomas J. Rothenberg, and
James H. Stock.
“Efficient Tests for an Autoregressive Unit Root.”
Econometrica
64,
no. 326 (1996):
813–36.
Engle Robert F., and
Clive W. J. Granger.
1987
“Cointegration and Error Correction: Representation and Testing.”
Econometrica
55,
no. 123:
251–76.Google Scholar
Feinstein C. H.
1961
“Income and Investment in the UK, 1856–1914.”
Economic Journal,
71Google Scholar
Feis Herbert.
1930
Europe the World's Banker, 1870–1914: An Account of European Foreign Investment and the Connection of World Finance with Diplomacy before the War.
New Haven, CT:
Yale University Press
Fishlow Albert.
1965
American Railroads and the Transformation of the Ante-Bellum Economy,
Cambridge, MA:
Harvard Economic Studies, Harvard University Press
Fishlow Albert.
1985
“Lessons from the Past: Capital Markets during the Nineteenth Century and the Interwar Period.”
International Organization
(MIT Press)
39,
no. 3:
383–
439.Google Scholar
Flandreau Marc, and
Jacques Le Cacheux.
1996
“La convergence est-elle nécessaire à la création d'une zone monétaire? Réflexions sur l'étalon or 1880–1914.”
Revue de l'OFCE
58
(July):
5–
41.Google Scholar
de Foville Alfred.
1890
La France économique: statistique raisonnée et comparative.
Paris:
Armand Colin
1888
International Historical Statistics
Greenslade Jennifer V.,
Stephen G. Hall, and
S. G. Brian Henry.
1999
“On the Identification of Cointegrated Systems in Small Samples: Practical Procedures with an Application to UK Wages and Prices.”
London Business School Working Paper
Hobson C. K.
1914
The Export of Capital,
London:
Constable
Imlah Albert H.
1958
Economic Elements in the Pax Britannica: Studies in British Foreign Trade in the Nineteenth Century.
Cambridge, MA:
Harvard University Press
Jenks Leland Hamilton.
1927
The Migration of British Capital to 1875.
New York:
Knopf
Johansen Søren.
1988
“Statistical Analysis of Cointegration Vectors.”
Journal of Economic Dynamics and Control
12:
231–54.Google Scholar
Johansen Søren.
1995
Likelihood-Based Inference in Co-Integrated Vector Autoregressive Models.
Oxford:
Oxford University Press
Kouri Pentti J. K.
1976
“The Exchange Rate and the Balance of Payments in the Short Run and in the Long Run: A Monetary Approach.”
Scandinavian Journal of Economics:
280–
304.Google Scholar
Kwiatkowski Denis,
Peter C. B. Phillips,
Peter Schmidt, and
Yongcheol Shin.
1992
“Testing for the Null Hypothesis of Stationarity against the Alternative of a Unit Root.”
Journal of Econometrics
54:
159–78.Google Scholar
Lenoir M.
1919
“Cours des valeurs mobilières françaises depuis 1856.”
Bulletin de la Statistique Générale de la FranceGoogle Scholar
Lewis W. Arthur.
1949
Economic Survey, 1919–1939,
London:
Allen & Unwin
Lévy-Leboyer Maurice.
1977
“La balance des paiements et l'exportation des capitaux français.”
In La position internationale de la France.
Paris:
Ed de l'EHESS
Marnata Françoise.
1973
La bourse et le financement des investissements.
Paris:
A. Colin
Martin G.
1927
Histoire économique et financière.
Paris:
Impr.-libr. Plon-Nourrit et Cie Société de l'Histoire nationale
Matthews R. C. O.,
C. H. Feinstein, and
J. C. Odling-Smee.
1982
British Economic Growth.
Stanford, CA:
Stanford University Press
Mitchell B.
1980
European Historical Statistics.
New York:
New York University Press
Moreau-Néret Olivier.
1939
Les valeurs mobilières.
2 vols.
Paris:
Librairie du Recueil Sirey (S.M.)
Neymarck Alfred.
1888
“Les valeurs mobilières en France.”
Journal de la Société Statistique de Paris
29,
no. 6 (June):
208–26.Google Scholar
Neymarck Alfred.
1903
“La statistique internationale des valeurs mobilières.” Bulletin de l'Institut International de Statistique, IVe rapport
Neymarck Alfred.
1911
Finances contemporaines,
7 vol,
Paris:
Guillaumin (F. Alcan)
Nurkse Ragnar.
1954
“International Investment Today in the Light of Nineteenth Century Experience.”
Economic Journal
64
(December).Google Scholar
Pradel Jacqueline, and
Christophe Rault.
2003
“Exogeneity in VAR-ECM Models with Purely Exogenous Long-Run Paths.”
Oxford Bulletin of Economics and Statistics
65,
no. 5, (December).Google Scholar
Pupin René.
1916
La richesse française devant la guerre.
Paris:
M. Rivière
Saint-Marc Michèle.
1983
L'histoire monétaire de la France.
Paris:
P.U.F
Schmidt Peter, and
Peter C. B. Phillips.
1992
“LM Tests for a Unit Root in the Presence of Determinist Trends.”
Oxford Bulletin of Economics and Statistics
54,
no. 3:
257–87.Google Scholar
Simon Matthew.
1967
“The Pattern of New British Portfolio Foreign Investment, 1865–1914.”
In The Export of Capital from Britain 1870–1914,
edited by A. R. Hall.
London:
Methuen
La Statistique Générale de la France.
Théry E.
1900
“L'Europe économique et financière dans le dernier quart du siècle.”
Supplément spécial de L'économiste européen publié pour l'exposition universelle de 1900.
Paris:
l'économiste européen
Théry E.
1897
Les valeurs mobilières en France.
Paris:
l'économiste européen
Théry E.
1911
La fortune publique de la France.
Paris:
C. Delagrave
White Harry Dexter.
1933
The French International Accounts.
Cambridge, MA:
Harvard University Press
SOME ESTIMATES OF THE FRENCH FOREIGN ASSET STOCK (billions of francs)
THE FRENCH BALANCE OF PAYMENTS BY LÉVY-LEBOYER (millions of francs)
GEOGRAPHICAL DISTRIBUTION OF FRENCH FOREIGN ASSETS, WITHOUT COLONIES (percentages)
INDICES OF PRICES OF FOREIGN BONDS AND FOREIGN STOCKS IN PARIS
OBSERVED RATE OF RETURN OF FOREIGN BONDS AND OF FOREIGN STOCKS IN PARIS
YIELD DIFFERENCES BETWEEN FOREIGN AND FRENCH BONDS
STOCKS OF FOREIGN SHARES AND BONDS HELD BY RESIDENTS (millions of francs)
STOCKS OF TOTAL PORTFOLIO IN FOREIGN STOCKS (KAC) AND IN FOREIGN BONDS (KOB)
VARIABLES IN THE DATA SET
ESTIMATION OF THE NUMBER OF COINTEGRATING RELATIONSHIPS OVER THE 1890 TO 1913 PERIOD: CONCERNING THE SHARE OF FOREIGN FIXED-INCOME FINANCIAL ASSETS IN THE GLOBAL PORTFOLIO Xt=(KOB′, r″ r′, PDI′, e′)′
ESTIMATION OF THE NUMBER OF COINTEGRATING RELATIONSHIPS OVER THE 1890 TO 1913 PERIOD
EXCHANGE RATE AND FOREIGN FIXED-INCOME PORTFOLIO SHARES VARIATIONS
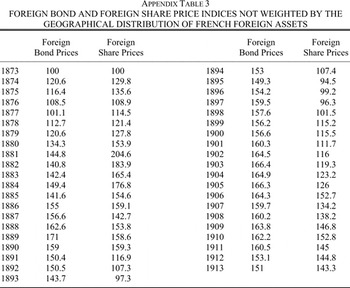
FOREIGN BOND AND FOREIGN SHARE PRICE INDICES NOT WEIGHTED BY THE GEOGRAPHICAL DISTRIBUTION OF FRENCH FOREIGN ASSETS
 You have
Access
- 21
- Cited by