Introduction
Tetropium fuscum (Fabricius) (Coleoptera: Cerambycidae) is a Palaearctic long-horned wood-boring beetle that has been established in Atlantic Canada since at least 1990 (Smith and Hurley Reference Smith and Hurley2000). In its native range, T. fuscum is not considered a pest because it primarily attacks dead or dying Norway spruce, Picea abies (Linnaeus) Karsten (Pinaceae) (Schimitschek Reference Schimitschek1929; Juutinen Reference Juutinen1955). In Canada, T. fuscum has been reported to attack and kill apparently healthy spruce, Picea spp. (Smith and Humble Reference Smith and Humble2000), and has been classified as a quarantine pest by the Canadian Food Inspection Agency since 2000.
Literature describing T. fuscum in its native range is limited, but Schimitschek (Reference Schimitschek1929) and Juutinen (Reference Juutinen1955) report that this species typically has one generation per year, although development may take longer in colder climates. Sexually mature adults emerge from trees throughout the summer, and mated females oviposit in bark crevices. Neonates bore through the bark, and larvae feed on phloem and cambium throughout their development. Prepupal larvae form pupal cells under the bark or in the sapwood and pupate the following spring.
Recent research on T. fuscum in Canada has improved our understanding of this species in its novel environment, but important questions remain. For example, there are no publications that report the number of instars in this species or that describe methods for determining the specific instar of field-collected larvae. This information is vital for many research techniques and for effective pest management, which relies on knowing the life-stage distribution of natural populations.
The number of instars for many free-feeding insects can be determined by direct observation of juvenile development, i.e., by counting the number of moults that occur. For insects whose juvenile development is concealed (e.g., bark and wood-boring beetles), direct observation is difficult. Alternatively, the size of sclerotised body parts, such as larval head-capsules, can indicate the number of instars for a species (Peterson and Haeussler Reference Peterson and Haeussler1928). Sclerotised structures remain the same size for the duration of an instar and the step-wise increases in size require moulting (Brooks Reference Brooks1886; Dyar Reference Dyar1890). The increase in size following a moult often follows a geometric progression, which is referred to as the Brooks–Dyar rule (Brooks Reference Brooks1886; Dyar Reference Dyar1890; Hutchinson and Tongring Reference Hutchinson and Tongring1984).
The objectives of this study were to use larval head-capsule width data to: (1) determine the number of T. fuscum instars, (2) estimate the mean and variance of head-capsule widths comprising each instar, and (3) identify any potential sexual dimorphism in head-capsule width within an instar.
Methods
Larval collection and measurement
Head-capsule width was measured for 949 T. fuscum larvae collected from red spruce, Picea rubens Sargent (Pinaceae), trees between 2008 and 2011. This sample included 297 larvae from field experiments where T. fuscum eggs were placed under the bark scales of trees (44°51′54.4′′N, 63°39′31.8′′W), 468 larvae from laboratory experiments where naturally oviposited T. fuscum developed on cut bolts, 22 larvae from T. fuscum eggs that had recently hatched in Petri dishes in the laboratory, and 162 larvae from naturally infested trees near Halifax, Nova Scotia, Canada (44°42′00.9′′N, 63°30′43.7′′W). Voucher specimens can be found at the Atlantic Forestry Centre in Fredericton, New Brunswick, Canada.
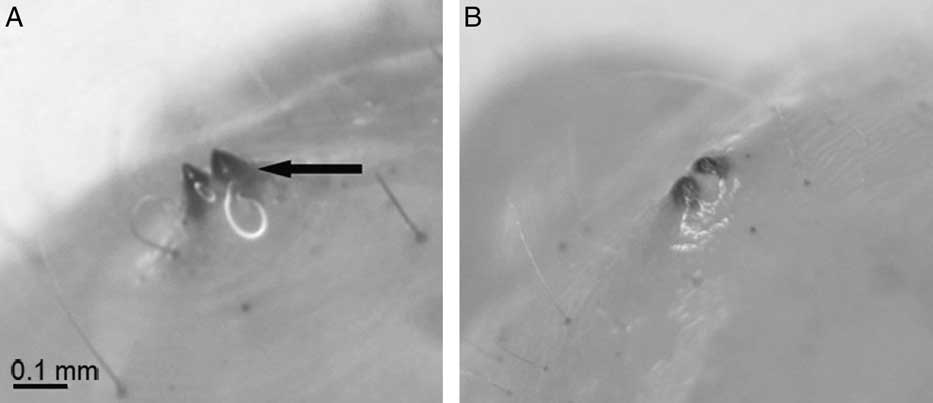
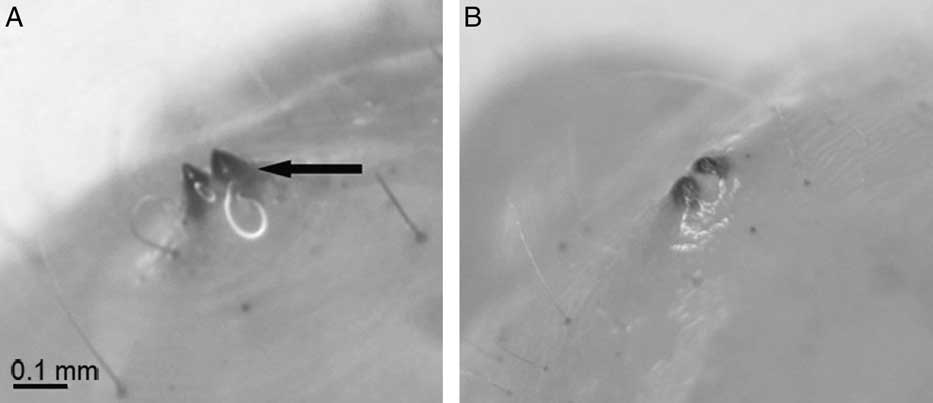
Only T. fuscum prepupae were collected from naturally infested trees, as these trees may also have been infested by Tetropium cinnamopterum Kirby (Coleoptera: Cerambycidae), a native congener whose larvae are morphologically similar to T. fuscum. Tetropium larvae are reported to have two caudal spines, and the caudal spines of T. cinnamopterum are fused at their base (Craighead Reference Craighead1923), unlike those of T. fuscum (Fig. 1). This is particularly clear in prepupal larvae. Therefore, the species of prepupae were identified on the basis of their caudal spines (Fig. 1). Because this trait is more difficult to discern in younger larvae, they were excluded from our sample.
Photographs showing magnified caudal spines of (A) Tetropium cinnamopterum, and (B) Tetropium fuscum. The arrow in (A) indicates the fused base of T. cinnamopterum caudal spines.
To recover larvae from bolts, the bark and phloem were peeled, and larvae feeding in the phloem tissue were collected. Bolts were split with an axe or cut into 2.5-cm (1-in) slabs using a portable sawmill to collect larvae that had built pupal cells in the sapwood. Larvae were usually preserved in either 70% or 95% ethanol until measured, but the 162 larvae taken from naturally infested trees were measured fresh.
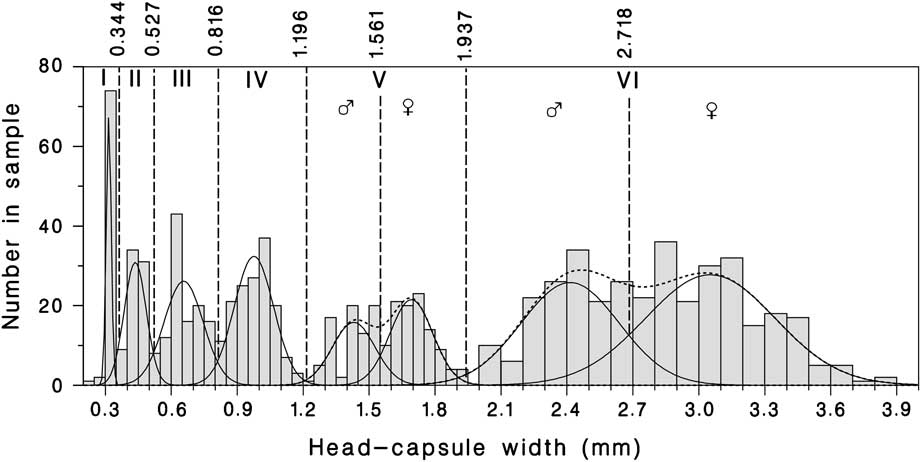
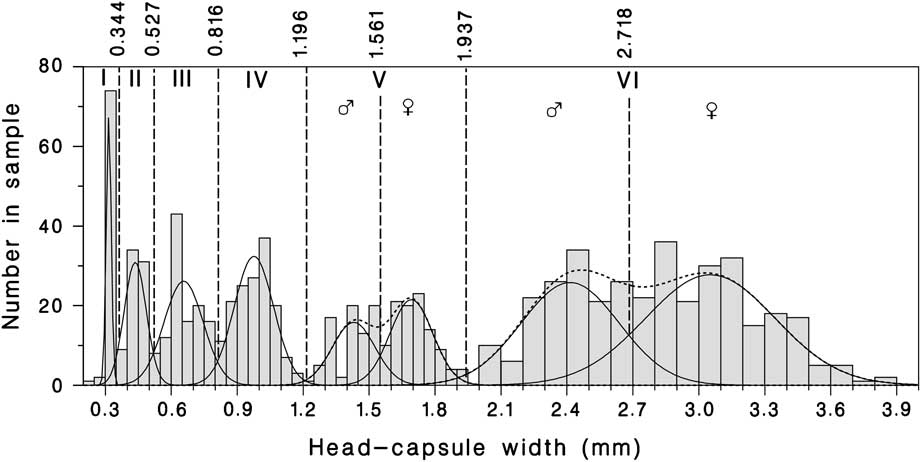
The width of larval head capsules was measured at their widest point using an ocular micrometer on a dissecting microscope. The larval integument was removed or retracted before measurement because it conceals a portion of the head capsule (Juutinen Reference Juutinen1955). The magnification used depended on the size of the larval head capsule, but was the highest magnification possible, with the head capsule fitting within the 100 divisions of the micrometer. Precisions achieved were 0.016, 0.020, 0.025, 0.033, or 0.050 mm for width ranges 0–1.60 (63× magnification), 1.61–2.00 (50×), 2.01–2.50 (40×), 2.51–3.30 (30×) and >3.30 mm (20×), respectively. A frequency distribution of head-capsule widths was compiled using increments of 0.05 mm for widths ≤2.00 mm, and 0.10 mm for widths >2.00 mm (Fig. 2).
Forty-six prepupae from naturally infested trees were reared individually following head-capsule measurement, and the sex of the emerged adults was determined. A two-tailed t-test was used to determine whether there was a difference in mean head-capsule width between male and female prepupae. Two-tailed t-tests were also used to compare the observed sex-specific head-capsule widths to the means and standard deviations estimated with the best mixture model (see Results).
Use of mixture models to evaluate the number of instars and sexual dimorphism
Least-squares nonlinear regression methods are available to determine the instar distributions from samples of head-capsule widths, using mixtures of successive normal distributions (McClellan and Logan Reference McClellan and Logan1994; Logan et al. Reference Logan, Bentz, Vandygriff and Turner1998). However, these methods are based on the analysis of frequency histograms of arbitrary resolution and require that the number of instars be specified a priori from the examination of these histograms. To avoid the arbitrariness of the decisions involved in choosing histogram resolution and number of instars, we chose to apply a maximum likelihood approach that is based on the measurements themselves rather than on the frequencies of arbitrarily sized classes. The SAS code and raw data used in this paper are available on request.
To determine the number of instars for T. fuscum and any potential sexual dimorphism, a series of increasingly complex mixture models were fitted to the sample of head-capsule widths by maximum likelihood (Pearson et al. Reference Pearson, Morrell and Brant1992; Hunt and Chapman Reference Hunt and Chapman2001), using Procedure NLMIXED in SAS 9.1 (SAS Institute 2002–2003). The models were mixtures of an increasing number of normal distributions of head-capsule widths (hereafter classes), and had the form:
 $$p({{w}_j})\, = \,\frac{1}{N}\mathop{\sum}\limits_{i\, = \,1}^s
{{{n}_i}} N{\rm{(}}{{w}_j}{\rm{|}}{{\mu }_i},\sigma _{i}^{2})
\eqno (1)$$
where p(wj
) is the likelihood of observation j,
ni
is the number of individuals from the sample (of total size
N) that belong to each class i
(i = 1 to s), and μi
and σi
2
are the mean and variance of head capsules within each class
i. Values of parameters ni
, μi
, and
 $ {\sigma} _{i}^{2} $
were estimated iteratively by minimising the negative
log-likelihood (L) of the entire sample (Hunt and Chapman
Reference Hunt and Chapman2001):
 $$L\, = \,{\rm{ - }}\,\mathop{\sum}\limits_{j\, = \,1}^N {\ln }
\left[ {p({{w}_j},{\bf {{A}}})} \right]\eqno (2)$$
where A is the set of class-specific parameter values being tested. The number of classes tested ranged from s = 3 to s = 9. Note that the number of individuals in the last class (ns ) is not a parameter because
 $$\[{n_s} = N - \sum\limits_{i = 1}^{s - 1} {{n_i}} \] \eqno (3)$$
Improvement in model fit was evaluated using Akaike's Information Criterion (Akaike Reference Akaike1978) corrected for finite sample sizes (AICc) (Burnham and Anderson Reference Burnham and Anderson2002):
 $$ \[AICc = 2(L + K) + \frac{{2K(K + 1)}}{{N - K - 1}}\]\eqno (4) $$
where k = 3s − 1 is the number of model parameters. The best model was that with the lowest AICc.
Initial parameter estimates for the iterative estimation process of NLMIXED
(SAS Institute 2002–2003) were
obtained from the frequency distribution of head-capsule widths (Fig. 2). The head-capsule width
categories containing the fewest observations between peak frequencies,
corresponding to potential instars or sexes within instars, were used to
partition the sample in order to calculate class-specific means
μi
, variances
 $ {\sigma} _{i}^{2} $
, and number of individuals ni
.
To evaluate whether the mean head-capsule widths for each class, determined by increasingly complex mixture models, adhered to the Brooks–Dyar rule (Brooks Reference Brooks1886; Dyar Reference Dyar1890), Crosby's ratio (Ci ) (Craig Reference Craig1975) between successive classes [Ci = 100 (gi − gi − 1)/g i − 1, where gi = μi /μi − 1 are the Brooks–Dyar growth ratios] was calculated. Growth ratios should be constant if they are to adhere perfectly to the Brooks–Dyar rule. A difference exceeding ±10% in successive growth ratios (∣Ci ∣ > 10) indicates that there is significant deviation from the Brooks–Dyar rule and that there may be too many (negative Crosby's ratio), or missing (positive Crosby's ratio) instars (Craig Reference Craig1975; Johnson and Williamson Reference Johnson and Williamson2006).
For the model of best fit (lowest AICc), the cut-off points between successive classes were determined by solving for the value (x) that corresponds to the head-capsule width at which the probabilities of belonging to either class are equal:
 $$ \[\frac{1}{{\sqrt {2\pi \sigma _i^2} }}\exp \left[ { -
\frac{1}{2}{{\left( {\frac{{x - {\mu _i}}}{{{\sigma _i}}}} \right)}^2}}
\right] = \frac{1}{{\sqrt {2\pi \sigma _{i + 1}^2} }}\exp \left[ { -
\frac{1}{2}{{\left( {\frac{{x - {\mu _{i + 1}}}}{{{\sigma _{i + 1}}}}}
\right)}^2}} \right]\] \eqno (5)$$
Misclassification probabilities were also calculated. Given the cut-off point (x) between classes i and i + 1, the probability (P) of classifying a larva of class i as belonging to class i + 1 is given by:
 $$\[P({\rm{classifying}}\;{\rm{i}}\;{\rm{as}}\;{\rm{i}} + 1) = 1 -
\int\limits_{v = x}^\infty {\frac{1}{{\sqrt {2\pi \sigma _i^2} }}} \exp
\left[ { - \frac{1}{2}{{\left( {\frac{{v - {\mu _i}}}{{{\sigma _i}}}}
\right)}^2}} \right]dv\] \eqno (6)$$
and the probability of classifying a larva of class i + 1 as belonging to class i is:
 $$ \[P({\rm{classifying}}\;{\rm{i}}\, + \,1\;{\rm{as}}\;{\rm{i}}) =
\int\limits_{v = 0}^x {\frac{1}{{\sqrt {2\pi \sigma _{i + 1}^2} }}\exp
\left[ { - \frac{1}{2}{{\left( {\frac{{v - {\mu _{i + 1}}}}{{{\sigma _{i +
1}}}}} \right)}^2}} \right]dv} \] \eqno (7)$$
Results and discussion
The simplest mixture model tested comprised three classes, with initial estimates μ 1 = 0.67, σ 1 = 0.27, n 1 = 418, μ 2 = 1.59, σ 2 = 0.16, n 2 = 182, μ 3 = 2.8, and σ 3 = 0.41. This model had by far the lowest likelihood and the highest AICc (2256.3) of all models tested. The four-class model split the three-class model's first category in two (μ 1 = 0.38, σ 1 = 0.07, n 1 = 155, μ 2 = 0.89, σ 2 = 0.18, n 2 = 263) and resulted in a large improvement (−99.2) in the AICc (2157.1). The five-class model further divided the four-class model's second class in two (μ 2 = 0.67, σ 2 = 0.08, n 2 = 117, μ 3 = 0.98, σ 3 = 0.08, n 3 = 146), achieving a further AICc improvement of −45.1 (AICc = 2112.0).
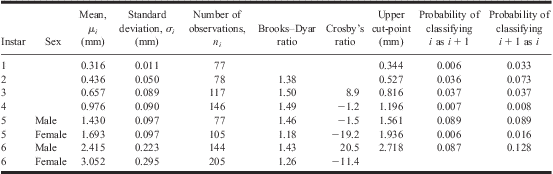
The greatest improvement in the AICc (−122) was obtained with the six-class model (AICc = 1990) by splitting the five-class model's first class (μ 1 = 0.32, σ 1 = 0.02, n 1 = 77, μ 2 = 0.45, σ 2 = 0.03, n 2 = 78). With the six-class model, all Crosby's ratios were within ±10%, indicating that neither too few nor too many instar classes were identified. However, the seven-class model improved the AICc by −9.4 (AICc = 1980.6) by dividing the six-class model's last class in two, with initial parameters μ 6 = 0.2.4, σ 6 = 0.17, n 6 = 144, μ 7 = 3.1, and σ 7 = 0.26. With this model, however, Crosby's ratios of classes 6 and 7 were −5.8 and −17.6, respectively, indicating that this model's last class is not likely an instar. The eight-class model split the fifth class of the previous model in two, with initial parameter values μ 5 = 1.43, σ 5 = 0.08, n 5 = 77, μ 6 = 1.71, σ 6 = 0.09, and n 6 = 105. It provided a further improvement in the AICc of −3.4 (AICc = 1977.2). Crosby's ratios generated by introducing these new classes were also well beyond the ±10% range (Table 1), indicating that they are not likely valid instars either. Further subdivision of classes increased the AICc and were not retained.
Final parameter estimates for the eight-class model describing the head-capsule widths of Tetropium fuscum.

These results provide strong support for the existence of six instars in T. fuscum, with the last two instars having sexually dimorphic head-capsule widths (Figs. 2 and 3), similar to adult elytra length (Flaherty et al. Reference Flaherty, Sweeney, Pureswaran and Quiring2011). Six instars are not unusual (or usual) for cerambycids, who have been reported to develop through as few as three (Pershing and Linit Reference Pershing and Linit1988) and as many as 15 (Adachi Reference Adachi1994) instars.
Frequency distribution histogram of observed Tetropium fuscum larval head-capsule widths. For widths <2.00 mm, 0.05-mm increments were used; for widths >2.00 mm, 0.10-mm increments were used. Overlaid is the frequency distribution estimated with the eight-class mixture model (solid line). For instars believed to be sexually dimorphic (five and six), the sum of component sex-specific distributions estimated with the eight-class model (dotted line) are also shown.
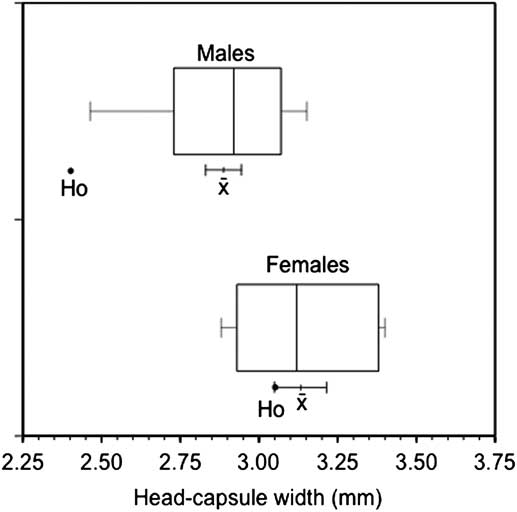
Box plots of
observed head-capsule widths of male and female Tetropium
fuscum prepupae. Below box plots are observed means (
 $ {\overline{x}} $
± SE) and the means estimated with the best mixture
model (Ho) for each sex.
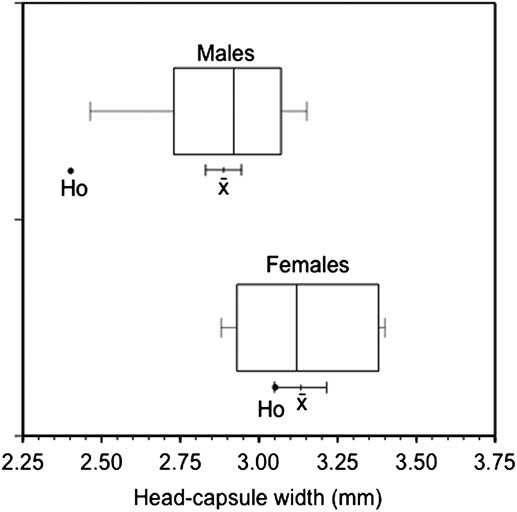
Both seven-class and eight-class models split larvae with head-capsule widths >1.94 mm into two separate classes, with mean head-capsule widths of 2.41 and 3.05 mm, respectively. Our sample of prepupae contained individuals with head capsules as small as 2.08 mm, and female prepupae had significantly wider head capsules than males (t 44 = 2.76, P = 0.010), further indicating that the last class in the seven-class and eight-class models results from sexual dimorphism and not an additional instar. Also, the head-capsule width of female prepupae averaged 3.15 ± 0.30 mm (SD, n = 15), not significantly different from the 3.05 mm expected from the eight-class mixture model (t 15 = 1.25, P = 0.24; Fig. 3). Those of males averaged 2.88 ± 0.33 mm (SD, n = 31), significantly but not exceedingly larger than the 2.41-mm width expected from the model (t 31 = 7.96, P < 0.001; Fig. 3). The differences in the observed and model-estimated means may be partly due to parasitism, which has been reported to reduce the size of head capsules in other species (McGugan Reference McGugan1954). Only nonparasitised larvae were used to calculate sex-specific mean head-capsule widths from the independent sample, whereas the data used to estimate model parameters likely contained both parasitised and nonparasitised larvae. The eight-class model also suggests sexual dimorphism in the fifth instar. Although this conclusion is not supported by independent data, sexual dimorphism in the size of larval head capsules for penultimate (De Oliviera and Durand Reference De Oliviera and Durand1978) and earlier (Floater Reference Floater1996) instars has been reported for other groups of insects.
The instar-specific and sex-specific cut-off points and associated classification error rates calculated for the eight-class model (Table 1) can be used to assign an instar and probable sex to T. fuscum larvae. The probability of misclassifying individuals of one instar (or sex) as belonging to a neighbouring category ranges from 0.6%–12.8%, with the highest probabilities of misclassification occurring when assigning a sex to fifth-instar and sixth-instar larvae. Thus, sexing on the basis of head-capsule width should be done with caution.
Besides sexual dimorphism and parasitism, variation in head-capsule width within an instar can result from genetic variation, other biotic factors (e.g., host species; Gaines and Campbell Reference Gaines and Campbell1935), and environmental or rearing conditions (Kishi Reference Kishi1971; Mizell and Nebeker Reference Mizell and Nebeker1979). A sample of T. fuscum larvae reared under exactly the same conditions and protected from parasitism would likely result in a sample with less intrainstar (and intrasex) variability. However, our estimates of head-capsule width means and variances are more widely applicable because larvae developed under a variety of biotic and abiotic conditions.
Acknowledgements
The authors thank D.T. Quiring, R. Johns, and C. Simpson for comments on an earlier version of this manuscript, and K. van Rooyen and A. Morrison for technical assistance. This research was supported by the Natural Resources Canada, Canadian Forest Service; the Canadian Food Inspection Agency; and the Natural Science and Engineering Research Council of Canada; and, through SERG International, by Forest Protection Limited, the Nova Scotia Department of Natural Resources, the Ontario Ministry of Natural Resources, and the Newfoundland and Labrador Department of Natural Resources.