Even though pedestrians represent the largest single road user group (Austroads, 1996), the modern city has not been designed keeping pedestrian safety in mind. This is evident from the staggeringly high number of injuries and fatalities resulting from pedestrian-vehicle crashes worldwide (Short & Pinet-Peralta, Reference Short and Pine-Peralta2010). Pedestrians are the most vulnerable road-users susceptible to severe consequences when involved in a car crash (Gitelman, Balasha, Carmel, Hendel, & Pesahov, Reference Gitelman, Balasha, Carmel, Hendel and Pesahov2012). In Europe, almost 22 pedestrians are killed on the roads every day (Mazzone, Pagliari, & Aversa, Reference Mazzone, Pagliari and Aversa2011; see also Zegeer & Bushell, Reference Zegeer and Bushell2012, for a recent review on this topic). The southern, eastern, and central Europe belt happens to be the worst affected area for crashes involving pedestrians, although Northern Europe has the highest number of pedestrians (Avenoso & Beckmann, Reference Avenoso and Beckmann2005). This incongruence between number of pedestrians and crashes involving pedestrians, directed analysts to focus attention on the complexities associated with pedestrian safety (Zegeer & Bushell, Reference Zegeer and Bushell2012).
Numerous factors, including pedestrian behavior, vehicle design, driver attitudes, and environment play relevant role in improving road safety and preventing pedestrian injuries (Martin, Reference Martin2006; Stanić, Vukanovic, & Osoba, Reference Stanić, Vukanovic and Osoba2005; Zegeer, Nabors, Gelinne, Lefler, & Bushell, Reference Zegeer, Nabors, Gelinne, Lefler and Bushell2010). Amongst these, traffic safety awareness, vehicle design, and effective environmental solutions are the most important elements in the vehicle-environment-pedestrian system (Zegeer & Bushell, Reference Zegeer and Bushell2012). Firstly, pedestrian accident could be reduced by achieving a shared traffic safety culture (Dula & Galler, Reference Dula and Geller2007), that is increasing the awareness of risks and willingness to prevent injuries for all road users (Ek, Akselsson, Arvidsson, & Johansson, Reference Ek, Akselsson, Arvidsson and Johansson2007). Secondly, pedestrian protection could be enhanced by designing front-end car geometry that minimizes the injury outcomes (van Hoof, de Lange, & Wismans, Reference van Hoof, de Lange and Wismans2003; Zhao, Rosala, Campean, & Day, Reference Zhao, Rosala, Campean and Day2010). Finally, administrations could promote policies and standards to increase the intuitiveness of road signage and the pedestrian’s awareness of the traffic flow condition. However, it should be understood that not all of these factors could be universally implemented (Zegeer & Bushell, Reference Zegeer and Bushell2012). Each countermeasure has to be chosen to fit the site and its specific socio-economic and demographic condition (Harkey et al., Reference Harkey, Srinivasan, Baek, Council, Eccles, Lefler and Bonnesson2008). For example, it is not feasible for developing economies, relying heavily on second-hand cars which are often more than a decade old, to implement the latest safety improvements in vehicles and crash avoidance technologies (Paterson, Reference Paterson2005). Consequently, implementing usable and economic solutions, like the improvement to traffic signals, present a viable alternative to face the pedestrian safety issue. With this in mind, in the last decades, applied psychologists have dedicated a lot of effort on designing more ergonomic traffic facilities (Di Stasi, Megías, Cándido, Maldonado, & Catena, Reference Di Stasi, Megías, Cándido, Maldonado and Catena2012; Megías et al., Reference Megías, Maldonado, Catena, Di Stasi, Serrano and Cándido2011).
Pedestrian jaywalking at signalized crosswalks
The biggest challenge for transportation professionals is to develop efficiency and standard traffic management solutions that can improve pedestrian safety (Avineri, Shinar, & Susilo, Reference Avineri, Shinar and Susilo2012; Zegeer & Bushell, Reference Zegeer and Bushell2012). Among all pedestrian signage “... signalized crosswalks are one of the most complex facilities, since pedestrians and vehicles share the same road space but different time intervals” (Lee & Lam, Reference Lee and Lam2008). In Europe, three signal phases are generally used: pedestrian red time, green time, and flashing green time (or yellow time). Pedestrians are not allowed to cross during pedestrian red time, but allowed to walk during pedestrian green time. In accordance with the traffic signal cycles, when the pedestrians arrived during flashing green time (or yellow time), they are not allowed to enter the crosswalks (DGT, 2013; Lee & Lam, Reference Lee and Lam2008; UK Department of Transport, 1995).
In most countries, illegal road crossing (i.e. jaywalking) is considered a minor pedestrian infraction and is subject to fines (Edelson, Reference Edelson2011; Hamilton-Baillie, Reference Hamilton-Baillie2008). In Spain, for example, pedestrians caught starting to crosswalks when the traffic light is red or flashing are subject to a 100€ fine (Spanish Royal Decree 339/1990). Despite this, jaywalking at signalized crosswalks is reported as one of the most common causes of road crashes involving pedestrians (King, Soole, & Ghafourian, Reference Hatoyama, Shimomura and Ieda2009; Ren, Zhou, Wang, Zhang, & Wang, Reference Ren, Zhou, Wang, Zhang and Wang2011).
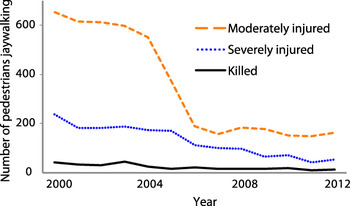
A growing research effort has been directed to understand jaywalking (Harrell, Reference Harrell1991; Martin, Reference Martin2006). This unsafe behavior depends on several factors, including: traffic and pedestrian volume (Yagil, Reference Yagil2000), red light phase duration (Yang, Deng, Wang, Li, & Wang, Reference Yang, Deng, Wang, Li and Wang2006), weather (Li & Fernie, Reference Li and Fernie2010), pedestrian gender (Tom & Granié Reference Tom and Granié2011), traffic safety climate (Gehlert, Hagemeister, & Özkan, Reference Gehlert, Hagemeister and Özkan2014; Quistberg et al., Reference Quistberg, Koepsell, Boyle, Miranda, Johnston and Ebel2014), and culture (Sueur, Class, Hamm, Meyer, & Pelé, Reference Sueur, Class, Hamm, Meyer and Pelé2013). New countermeasures aimed to reduce jaywalking and to increase pedestrian safety have been introduced: countdown displays (Lipovac, Vujanic, Maric, & Nesic, Reference Lipovac, Vujanic, Maric and Nesic2013), intelligent traffic lights with pedestrian detection systems (Xiao, Zhang, Hou, & Chuan, Reference Xiao, Zhang, Hou and Chuan2013), and pedestrian enforcements campaigns (Quistberg et al., 2013). Yet, pedestrian injuries at signalized crosswalks continue to occur (Figure 1).
Number of pedestrians jaywalking involved in car crashes. The graph presents the number of pedestrians killed and injured in Spain -over the years- when crossing intersections against the traffic light signal. (Source: Spanish Directorate-General of Traffic http://www.dgt.es/es/).

In the present study, we investigated the effects of different lights color-code (i.e. green, yellow, and red) and light solutions (i.e. flashing vs. steady) on pedestrians' self-reported behavior (i.e. hypothetical crossing rate) among Spanish undergraduates. Furthermore, pedestrian gender was considered as a between subject factor. To the best of our knowledge, no studies have investigated the effect of traffic signal solutions among Spanish young adults. The results coming from this investigation, will offer planners and designers of non-motorized facilities guidance to enhance the intuitiveness of road signs, increasing the pedestrian’s awareness of the traffic flow condition.
Methods
Participants
Two hundred forty-seven undergraduates from the University of Granada (M age = 22.68, SD = 4.04 years; 182 women) took part in this study in exchange for course credits. Most of the participants (74.89%) held a valid driver license and all had normal or corrected to normal vision. None of them were familiar with the hypotheses under investigation. The study was conducted in conformity with the declaration of Helsinki (Williams, Reference Williams2008).
Materials
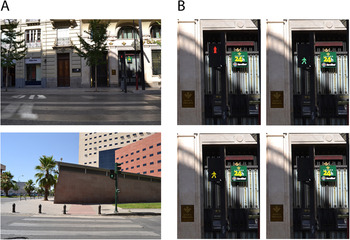
A total of 10 pictures of standard signalized crosswalks with pedestrian traffic lights were taken (see Figure 2A). All crosswalks were located in central area of Granada (Spain). To ensure that the populations of pedestrians and drivers at all sites were as similar as possible, the crosswalks chosen for this study were located within 3 kilometers of each other. The speed limit in the urban area was 50 km/h. All crosswalks were clearly signed and marked (with zebra crossings). Their width was 3.80 m (on average) and crossed a two-way road. Pictures were taken on same day, from 2 p.m. -5 p.m., and the bi-directional flow effect was controlled (i.e. no pedestrian was crossing). All selected pictures represent mid-block crosswalks with divided cross-section and without median refuge. They were outfitted with curb ramps -8 out 10 with tactile warning strips- and only one had bollards (Figure 2A, bottom). Finally, in-roadway flashing signals and advance warning signals were not present in the displayed traffic scenes.
Examples of the signalized crosswalks stimuli used in the experiment. A) Two crosswalk pictures taken from real roads over different sites in the metropolitan area of Granada (Spain) B) Fixed traffic light phases (including control condition - light off).

Each of the 10 traffic scenes (pictures) were modified in a way that the pedestrian traffic lights could be: steady green, flashing green, steady yellow, flashing yellow, steady red, flashing red or completely off (see Figure 2B). Thus, 70 pictures (stimuli) were obtained. Stimuli have been tailored to the signal systems in operation and modified following the current European regulations. For the flashing conditions, the light was flashed continuously at a rate of 60 times per minute and the illuminated period of each flash was 1/2 of the total flash cycle.
Procedure
Before starting the experiment, we asked participants to sit one meter away from each other and to complete a sociodemographic survey. Once all participants completed the survey, the experiment started. Participants were required to indicate their frequency of crossing the 70 crosswalks, one per time, using a 11-point scale ranging from 0 (“I never cross in this situation”) to 10 (“I always cross in this situation”). An answer sheet was used to collect the participant's responses. To prevent participants from discussing the responses with their classmates, two researchers [LLDS and AM] were present in the room. The data set of stimuli was presented in random order and displayed on a projection screen (120 x 90 cm) located in front of each group of participants (approximately 35 students per group). All stimuli remained on the screen for 4000 ms, and it was followed by a black screen that lasted 3000 ms. The experiment lasted approximately 30 min.
Results
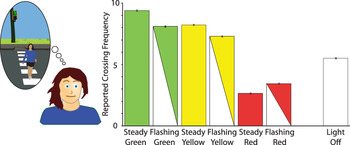
Because the assumption of normality was rejected (Kolmogorov-Smirnov test, p < .05), the crossing rate (dependent variable) was analyzed using a Friedman non parametric test with the type of pedestrian traffic light solution (7 levels: steady green, flashing green, steady yellow, flashing yellow, steady red, flashing red, and light off) as independent variable. The significance level was set at α = .05. Friedman's test for related samples showed a significant effect of type of traffic light solution χ2(13, 247) = 585.45, p < .001. As expected, steady green traffic light (M = 9.41; SD = 0.91) showed the highest frequency of crossing. Flashing green (M = 8.10; SD = 1.49) and steady yellow (M = 8.23; SD = 2.07) obtained lower scores than steady green and higher than remainder of traffic lights. The next type of traffic light with a higher crossing frequency was the flashing yellow (M = 7.30; SD = 1.91). Red traffic lights (steady: M = 2.65; SD = 2.09; flashing: M = 3.44; SD = 2.14) were the situations with lower crossing frequency, especially the steady red condition. Finally, the off traffic light (M = 5.51; SD = 1.80) showed an intermediate frequency compared to the other situations (See Figure 3).
Reported crossing frequency. The seven traffic light solutions are represented on the X-axis and the Y-axis shows the reported crossing frequency. On the Y-axis, 0 indicates that pedestrians never cross/will cross in this situation and 10 that they always cross/will cross in this situation. Error bars indicate the SEM. Means and SME values of the reported crossing frequencies were calculated from the median values of each participant (n = 247) for each condition.

Wilcoxon signed rank post-hoc analysis with Bonferroni correction (resulting in a significance level set at p < .001) showed that all pair-wise differences between traffic light solutions were significant for both women and men (all p-values < .001), except for the flashing green and steady yellow lights (women: p = .14; men: p = .13). Significant differences between women and men were observed for flashing red lights (women: M = 3.17; SD = 1.99; men: M = 4.21; SD = 2.36) and steady red lights (women: M = 2.32; SD = 1.88; men: M = 3.59; SD = 2.38).
Discussion
Pedestrians safety is a pressing issue for all industrialized countries (Avineri et al., 2012). The last EuroTest pedestrian traffic lights survey [EuroTest Pedestrian Crossings Assessment, 2010], revealed the lack of homogeneity in adopting standards for regulating the pedestrian flow (Mazzone et al., Reference Mazzone, Pagliari and Aversa2011). Thus, new strategies aimed at reducing jaywalking and increasing pedestrian safety are in the agenda of several international organizations (Mazzone et al., Reference Mazzone, Pagliari and Aversa2011, Williams Reference Williams2013).
We examined the effect of different traffic signal solutions on pedestrians' self-reported road-crossing behavior, among Spanish young adults. Our results show that mandatory solutions (i.e. steady green and steady red) are the best solutions to avoid unsafe pedestrian behaviors while crossing controlled intersections. Alternative color-code and light solutions (i.e. steady yellow or other flashing colored variations) may result in failure to stop pedestrians when entering the crosswalks. Interestingly, when we combined a mandatory stop signal (red light) with the flashing solution, pedestrians showed a low crossing rate if compared with the other solutions (i.e. flashing/steady yellow or green solutions). But still, the crossing rate induced by the flashing red was higher when compared to the steady red solution. Flashing colored solutions (i.e. green, red, and yellow) are commonly used to alert road users of an imminent change in the traffic light sequence (Hatoyama, Shimomura, & Ieda, Reference Hatoyama, Shimomura and Ieda2003), however their utility in improving road safety has been not been proved yet (Factor, Prashker, & Mahalel, Reference Factor, Prashker and Mahalel2012; Newton, Mussa, Sadalla, Burns, & Matthias, Reference Newton, Mussa, Sadalla, Burns and Matthias1997). This could be associated to the difficulty met by pedestrians to understand the meaning of the conventional flashing indications (Transportation Association of Canada, 2008).
In line with previous studies, we found gender-based differences in unsafe crossing behavior at crosswalks: male pedestrians showed higher prevalence of jaywalking than female pedestrians (Lipovac et al., Reference Lipovac, Vujanic, Maric and Nesic2013; Tom & Granie, Reference Tom and Granié2011; Yagil, Reference Yagil2000).
There are some limitations to our study, however. We did not explicitly account for the lane width or capacity of the selected crosswalks on pedestrian behavior (Lee & Lam, Reference Lee and Lam2008). Furthermore, neither pedestrians nor vehicles were present on the pictures examined by the participants. Both elements are considered the most influential situational factors when crossing (King et al., Reference King, Soole and Ghafourian2009; Lange, Haiduk, Schwarze, & Eggert, Reference Lange, Haiduk, Schwarze and Eggert2011; Yagil, Reference Yagil2000). We evaluated pedestrian behavior only using a specific self-report. Thus, personal and motivational factors (e.g., social acceptance) might have biased the reported scores (Yagil Reference Yagil2000, Yang et al., Reference Yang, Deng, Wang, Li and Wang2006). Finally, we did not inform participants about when it was allowed to cross the street. Although many studies suggest that the relationship between knowledge of the rules of the road and traffic behavior is not very strong (e.g. Goldenbeld, Twisk, & de Craen, Reference Goldenbeld, Twisk and de Craen2004; Zeedyk, Wallace, Carcary, Jones, & Larter, Reference Zeedyk, Wallace, Carcary, Jones and Larter2001), it is possible that participants without a valid driver license (< 25%) might have failed to interpret the precise meanings of some traffic light solutions. Taken together, these limitations might make the generalization of our findings to more realistic scenarios problematic.
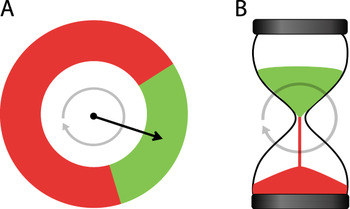
Notwithstanding the above, our results suggest that simple design solutions, such as changing regulatory traffic light color-code, could greatly enhance pedestrians safety at signalized intersections. A possible alternative design solution could be re-designing the disused Marshalite traffic signals or the modern traffic light concept Sand Glass ®, adapted to display only two mandatory phases cross/not cross (green vs. red). This solution provides an unambiguous semantic affordance displaying the amount of time left to the next phase (see Figure 4).
Two schematic examples of alternative traffic light solutions. A) A modified version of the rotary clockface traffic signal Marshalite (Marshall, 1936; http://en.wikipedia.org/wiki/Marshalite). B) An adapted version of the modern traffic light concept Sand Glass ® (http://www.yankodesign.com/). Both solutions provide unambiguous semantic affordances displaying the amount of time left to cross/wait.

Taken together, our results can be explained by an integrative model of crossing behavior proposed by Lange and colleagues (Lange et al., Reference Lange, Haiduk, Schwarze and Eggert2011) who have shown that pedestrians are more likely to cross against the traffic lights when the stimulus configuration is somewhat ambiguous (i.e., in the presence of stimuli which convey it is safe to cross). In our case, the absence of approaching vehicles -in the presented traffic scenes- might have increased the likelihood of jaywalking. Furthermore, participants might have learned that crossing during the flashing light condition is associated more frequently with positive consequences (e.g. taking the bus on time) than negative (e.g. getting a ticket) ones (Feng & Donmez, Reference Feng and Donmez2013).
To conclude, there is not a single strategy that can diminish pedestrian injuries (National Highway Traffic Safety Administration, 2003). However, the fact that an easy colour-code and light solution manipulation has produced discernible benefits should encourage further research on usable facilities for pedestrians, and encourage the use of basic research in the service of the pedestrian-oriented road design.
This study was partially funded by the Spanish Dirección General de Tráfico: DGT Projects SPIP2014-1426 to L.L.D.S.; SPIP2014-01341 to A. Cándido, and supported by the projects PB09-SEJ4752 (A. Cándido), PSI2009-12217 (A. Maldonado), and PSI2012-39292 (A. Catena). L.L.D.S. was supported by the MEC-Fulbright Postdoctoral Fellowship program (grant PS-2010-0667) and is currently supported by the Talentia Postdoctoral Fellowship program (grant Talentia Postdoc 267226). A. Megías is supported by a postdoctoral fellowship from Junta de Andalucia. We thank Dr. Carolina Diaz-Piedra (Arizona State University) and Dr. Francesco Del Prete (Universidad de Granada) for the help in collecting the data, and Dr. Shreya Bhattacharyya and Dr. Michael B. McCamy for their valuable advice and language revisions.