I. INTRODUCTION
High-entropy alloys have been defined as multicomponent alloys with equal or near-equal molar ratios of the components (unlike most alloys with one or two major components) with at least 4 or 5 components. Since configurational entropy is not always the determining factor in the structures observed, they are often referred to as multiple-principal element alloys.
While there has been intense interest in high-entropy alloys, or more generally, multiprincipal component alloys, it has been estimated Reference Murty, Yeh and Ranganathan1 that only about 5% of those made so far have been processed by the solid-state technique of mechanical alloying that typically results in nanocrystalline microstructures in the as-milled powders. It is materials with the nanocrystalline structure produced by this method, and with the other severe plastic deformation method of high-pressure torsion, that will be the subject of this article. Nanocrystalline structures have also been observed in high-entropy alloy thin films made by various physical vapor deposition methods. Reference Zhang, Koch, Ma, Zhang, Pan, Gao, Yeh, Liaw and Zhang2 These materials, with the exception of thin film refractory metal alloys, will not be covered in this review.
Mechanical attrition—the ball milling of powders—is often divided into “mechanical alloying” (MA) where compositional changes occur in the milling of dissimilar powders (alloying on the atomic level) and “mechanical milling” (MM) where structural changes can be induced on ball milling of single-component powders (elements or compounds) such as solid-state amorphization or production of nanocrystalline grain microstructures. Mechanical alloying (MA) will be one focus of this article.
The several advantages of the mechanical alloying process include its versatility. Almost any material can be produced by this method including ductile metal alloys, brittle intermetallic compounds, and composites. Mechanical alloying, which is typically carried out at room temperature or below, bypasses the potential problems with melting and casting methods and the segregation of chemistry the latter methods can produce. Thus, it can synthesize alloys with very different melting temperatures or vapor pressures that often pose a problem for solidification processing. The as-milled microstructures are typically very fine grained and this is one of the important processing routes for making nanocrystalline materials.
Disadvantages of mechanical alloying include the possible contamination from the milling media or atmosphere and the fact that in most cases the product is powder which requires subsequent consolidation to bulk form. The contamination problem can be minimized or eliminated by proper choice of the milling media (composition of balls and vial) and by milling in a high-purity inert gas or vacuum environment. The consolidation process is most important if the as-milled structure needs to be retained and temperatures of consolidation cause changes (e.g., grain growth or recrystallization). A severe plastic deformation method which can be done on bulk samples, high-pressure torsion, does not need this consolidation step, and in some cases can also produce nanocrystalline microstructures.
The first examples of solid solution high-entropy alloys with nanocrystalline microstructures were prepared by mechanical alloying and presented by the group of B.S. Murty. This article will start with a summary of the seminal work from this group. A variety of transition metal high-entropy alloys, in some cases with additions of Al, Cu, or Zn, made by mechanical alloying have been reported and will be presented next. A study of the stacking fault energy in nanocrystalline CrFeCoNi base alloys from the author’s group will be discussed along with other recent results on these systems from other groups. The so-called Cantor alloy, CrMnFeCoNi, has also been made nanocrystalline by high-pressure torsion, and these results will be presented. The discovery of a single-phase low-density high-entropy alloy with a fcc structure as-milled, and hcp after annealing will be presented and discussed.
II. THE SEMINAL RESEARCH OF B.S. MURTY AND HIS GROUP ON NANOSTRUCTURED HIGH-ENTROPY ALLOYS
The first examples of solid solution high-entropy alloys prepared by mechanical alloying were given by B.S. Murty and co-workers. The Ph.D. thesis of Varalakshmi Reference Varalakshmi3 reported on the preparation of equiatomic elemental powder blends in the AlFeTiCrZnCu, CuNiCoZnAlTi, FeNiMnAlCrCo, and NiFeCrCoMnW systems using mechanical alloying. The equiatomic binary to six-component compositions of all four systems were synthesized in the order of, for example, AlFe, AlFeTi, AlFeTiCr, AlFeTiCrZn, and AlFeRTiCrZnCu. The influence of composition on high-entropy alloy formation was also followed in nonequiatomic compositions by varying one of the elements from 0 to 50 at.%. All the alloys in these systems had either the bcc or fcc phase as the major phase as determined by X-ray diffraction (XRD). The as-milled structures (either bcc or fcc) were maintained after annealing at 800 °C for 1 h. The as-milled structures exhibited nanocrystalline grain sizes (∼10 nm), and the nanostructured grain size was retained after annealing at 800 °C, to the resolution of the X-ray line broadening method used to estimate grain size.
The first article published from this thesis research, by Varalakshmi et al. Reference Varalakshmi, Kamaraj and Murty4 described the synthesis by mechanical alloying of the AlFeTiCrZnCu system from the binary to the hexanary compositions. These alloys have the bcc structure with grain size less than 10 nm. The bcc structure is stable even after annealing at 800 °C for 1 h. The hardness of this alloy is 2 GPa in the sintered condition with a density of 99% of theoretical.
A subsequent article focused upon CuNiCoZnAlTi system from the binary CuNi to the hexanary. Reference Varalakshmi, Kamaraj and Murty5 Nonequiatomic (Cu x NiCoZnAlTi: x = 0, 8.33, 33.33, 49.98 at.%) alloys were also studied. In the as-milled condition, the equiatomic HEAs have an fcc structure up to quinary (CuNi, CuNiCo, CuNiCoZn, and CuNiCoZnAl) and a bcc structure in hexanary CuNiCoZnAlTi. After annealing at 800 °C, a second fcc phase precipitates out of the original fcc phase in these alloys up to the quinary alloy, whereas in the hexanary alloy, a small amount of fcc phase precipitates out of the bcc phase. In nonequiatomic alloys, the bcc phase is observed in alloys with 0 and 8.33 at.% Cu, and fcc is observe in alloys containing 33.33 and 49.98 at.% Cu in the as-milled condition. In the annealed condition, the nonequiatomic alloys show precipitation of an fcc phase from the bcc phase in the 8.33 and 33.33 at.% Cu alloys while the higher Cu-containing alloys show three fcc phases, with the fcc phase observed in the as-milled condition being the predominant phase. No intermetallic phases were observed. The equiatomic hexanary alloy was consolidated by hot isostatic pressing (HIP) at 800 °C. The hardness of this HIPed sample is 8.79 GPa and the compressive strength is 2.76 GPa. It was suggested that this alloy might be considered for application as hard coatings. This same alloy was consolidated by vacuum hot pressing and had a bcc structure with two minor fcc phases. Reference Varalakshmi, Kamaraj and Murty6 It had a hardness of 7.55 GPa and compressive strength of 2.36 GPa. A hexanary alloy (with Fe and Cr instead of Ni and Co), that is, AlFeTiCrZnCu was made by mechanical alloying. Reference Varalakshmi, Appa Rao, Kamaraj and Murty7 It had the bcc structure as-milled. After consolidation by cold pressing and sintering, hot pressing, or hot isostatic pressing, the structure was mainly bcc, but with small amounts of a second bcc phase and fcc phase. It is believed that the second bcc phase may have been present in the as-milled condition but was not resolved. The sample consolidated by HIP had the best densification and mechanical properties. It exhibited a hardness of 10.04 GPa and compressive yield strength of 2.83 GPa.
III. TRANSITION 3D METAL NANOCRYSTALLINE HIGH-ENTROPY ALLOYS. SOME WITH OTHER ADDITIONS. TYPICALLY MULTIPHASE
A number of investigators have studied a variety of transition metal alloys produced by mechanical alloying which are typically multiphase combinations of fcc and bcc structures as-milled. Annealing often changes the structure, and in some cases intermetallics such as B2 or sigma phases are reported. The results of these investigators’ research are given in approximately chronological order. Each article is briefly summarized although, with one exception, all structures are multiphase.
Zhang et al. Reference Zhang, Fu, Zhang, Shi, Wang, Wang and Zhang8 observed a two-phase fcc with small amounts of bcc in as-milled powder. After annealing the intensity of the bcc XRD peaks increased and at the highest annealing temperature (1000 °C), a (100) peak suggesting the B2 structure appeared.
Chen et al. Reference Chen, Hu, Tsai, Hsieh, Kao, Yeh, Chin and Chen9 prepared a series of alloys from binary to octonary from Cu, Ni, Al, Co, Cr, Fe, Ti, and Mo in sequence by mechanical alloying. Binary (CuNi) and ternary (Cu0.5NiAl) form fcc and bcc structures, respectively, which were maintained after long milling times. For quaternary and alloys with more components, the fcc phase was formed first, and then transformed to an amorphous structure after prolonged milling.
Zhang et al. produced equiatomic CoCrFeNiTiAl by mechanical alloying. Reference Zhang, Fu, Zhang, Wang, Lee and Niihara10 Two-phase bcc and fcc solid solutions were formed on milling. The grain size was about 40 nm. After annealing a second bcc phase formed and at the highest annealing temperatures (>700 °C) a (100) peak of the B2 structure was observed. The powders were consolidated by spark plasma sintering (SPS) to a relative density of 98% and had a hardness of 4.2 GPa.
Praveen et al. Reference Praveen, Murty and Kottada11 prepared equiatomic AlCoCrCuFe and NiCoCrCuFe high-entropy alloys by mechanical alloying and SPS. Simple fcc and bcc phases evolved after mechanical alloying while Cu-rich fcc and sigma phases evolved on SPS along with fcc and bcc phases. The phase evolution after mechanical alloying and SPS suggested that configurational entropy is not sufficient to suppress the formation of the Cu-rich fcc phase and sigma phase. Enthalpy of mixing must also be considered.
Fu et al. Reference Fu, Chen, Fang, Zhang, Xiao and Zhu12 prepared CoNiFeCr Al0.6Ti0.4 by mechanical alloying and SPS. A supersaturated solid solution of fcc phase and a metastable bcc phase were observed. After SPS, two fcc phases (fcc1 and fcc2) appeared along with a new bcc phase. The metastable bcc phase formed on mechanical alloying transformed to fcc2 and the new bcc phase. The fcc1 phase was found to be the original fcc phase formed during mechanical alloying. The grain size of fcc1 ranged from tens of nm to about 500 nm. Nanoscale deformation twins were observed in some fcc1 grains. The alloy after SPS had nearly theoretical density and a compressive yield strength of 2.08 GPa and hardness of 5.6 GPa.
Tariq et al. Reference Tariq, Naeem, Hasan, Akhter and Siddique13 produced AlCoCrCuFeNi, AlCoCrCuFeNiW, and AlCoCrCuFeNiWZr equiatomic high-entropy alloys by mechanical alloying. The main phase in the three alloys was bcc with a nanocrystalline grain size of about 15 nm. Mossbauer measurements indicated that the additions of W and Zr changed the ferromagnetic hexanary alloy to paramagnetic.
Pradeep et al. Reference Pradeep, Wanderka, Choi, Banhart, Murty and Raabe14 studied AlCrCuFeNiZn prepared by mechanical alloying followed by hot compaction at 600 °C. The structure and composition was determined using XRD, transmission electron microscopy (TEM), and atom probe tomography (APT). The as-milled structure was mainly bcc with a nanocrystalline grain size of about 20 nm. After hot compaction a composite microstructure was observed consisting of about 60% bcc phase with 20-nm grain size, and about 40% fcc segregated along the grain boundaries. APT analysis revealed that the bcc phase was composed of two locally decomposed regions, Ni–Al and Cr–Fe having the same lattice parameters and bcc structure. The fcc grain boundary phase, which apparently stabilized the nanocrystalline grain size, was Cu–Zn with about 30% Zn, that is alpha brass.
The Al x CoCrCuFeNi system has been studied by a number of investigators. While most studies have used casting as the preparation method, Sriharitha et al. Reference Sriharitha, Murty and Kottada15 carried out a systematic study using mechanical alloying as the processing method, which produced a nanocrystalline microstructure, and varying the Al concentration (x = 0.45, 1, 2.5, 5 mol). Two fcc phases and a bcc phase were observed in the lower Al content alloys (x = 0.45 and 1) while a single B2 phase was seen for the higher Al concentration alloys. After heating in a differential scanning calorimeter (DSC), the bcc phase disappeared in the lower Al content alloys, while the B2 phase was stable in the x = 5 alloy. The x = 2.5 alloy had the B2 phase along with an fcc phase. Interestingly, the phases remained nanocrystalline or ultrafine grained even after heating in the DSC up to 1480 °C. In particular, the x = 1 alloy had nanocrystalline grain sizes for both fcc phases (30 and 53 nm).
Fazakas et al. Reference Fazakas, Varga and Varga16 produced a 10-component alloy, CoCrFeNiCuAlTiXVMo (X = Zn, Mn), by mechanical alloying. The as-milled alloy was mostly bcc with some fcc phase. It had a nanocrystalline grain size of about 10 nm. Annealing at 600 °C maintained the two-phase microstructure and the authors claim from the XRD line broadening that the grain size also did not coarsen significantly. The Zn and Mn containing alloys had hardness values of 7.6 and 6.2 GPa, respectively, after annealing. Even though the configurational entropy of the 10-component alloy is high, a single-phase solid solution was not formed.
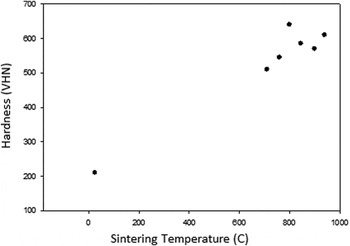
Mohanty et al. Reference Mohanty, Gurao and Biswas17 prepared AlCoCuZnNi by mechanical alloying. The as-milled structure was a single-phase nanocrystalline fcc alloy. The as-milled powders were compacted by SPS at different temperatures. After sintering, the single-phase fcc as-milled structure transformed into an fcc phase with different composition, and an ordered L12 phase. The L12 nanoscale phase (like gamma prime in Ni base superalloys) precipitates caused significant age-hardening. Sintering at 800 °C resulted in a 3-fold increase in hardness from the as-milled or solution treated conditions as shown in Fig. 1.
Hardness (VHN) as a function of sintering temperature for AlCoCuZnNi high-entropy alloy (after Ref. Reference Mohanty, Gurao and Biswas17).

Ji et al. Reference Ji, Fu, Wang, Wang, Zhang, Wang and Zhang18 used mechanical alloying followed by SPS to prepare CoCrFeNiAl. The as-milled structure was bcc with a 20-nm grain size. Annealing above 500 °C transformed the bcc structure into fcc, although TEM showed small amounts of bcc phase remained. The alloy consolidated at 900 °C by SPS had a hardness of 6.1 GPa and a compressive yield strength of 1.9 GPa. The grain size after SPS was bimodal, with grain sizes ranging from >200 to <50 nm.
Babu et al. Reference Babu, Sivaprasad, Muthupandi and Szpunar19 prepared an equiatomic heptanary high-entropy alloy, AlCoCrCuNiFeZn by mechanical alloying. The as-milled powder had an estimated grain size of about 15 nm and a mostly bcc structure, with however some small extra XRD peaks. The powders were consolidated by hot compaction at 850 °C for 2 h. The authors claim that the nanocrystalline structure is maintained after hot compaction but the evidence from their SEM images are not convincing. Nanoindentation measurements on the compacted samples gave a hardness value of 7.8 GPa and a Young’s modulus of 152.4 GPa.
Fu et al. Reference Fu, Chen, Wen, Morgan, Chen, Zheng, Zhou, Zhang and Lavernia20 produced CoNiFeAlTi by mechanical alloying followed by SPS. The as-milled structure was composed of two phases: bcc solid solution and fcc solid solution. After SPS, the bcc and fcc phases were joined by small amounts of the intermetallic Al3Ti. Electron diffraction indicated that the bcc phase showed ordering of a B2 structure. After SPS, the bcc (B2) and fcc phases were fine-grained and the trace amounts of intermetallic were nanocrystalline/fine-grained. Nanoscale twins were observed in fcc grains. The compressive maximum strength was 2988 MPa and the hardness was 6.9 GPa. The strain to failure was 5.8% and believed to be due to the presence of the fcc phase.
Fu et al. Reference Fu, Chen, Wen, Chen and Lavernia21 studied the effect of Co on the microstructure and mechanical behavior of Al0.6NiFeCrCo powders prepared by mechanical alloying and then consolidated by either SPS or hot pressing. After mechanical alloying, both fcc and bcc phases were observed in the alloy with or without Co. The alloy without Co had a lower content of fcc phase. After sintering, both the SPS and hot pressed samples had a major fcc and minor bcc phase in the Co-containing alloy. However the amount of bcc phase was higher in the alloy without Co. The alloy without Co exhibited lower strength and hardness but slightly higher plasticity than the alloy containing Co.
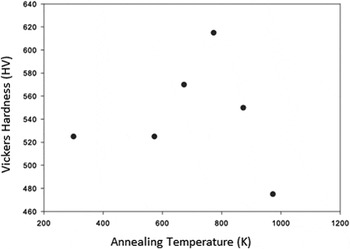
Tang et al. Reference Tang, Huang, Huang, Liao, Langdon and Dai22 performed high-pressure torsion and thermal annealing to a fcc as-cast Al0.3CoCrFeNi high-entropy alloy. The grain size of the samples after high-pressure torsion (HPT) was about 30 nm. Annealing at 573 K did not change the grain size or structure. However, on annealing at higher temperatures, starting at 673 K, an ordered nanoscale bcc phase precipitated and the fcc grains grew from 33 nm at 673 K to 280 nm at 973 K. The bcc phase also coarsened from 8 nm at 673 K to 60 nm at 973 K. The hardness of the as-cast and HPT samples versus annealing temperature is shown in Fig. 2. While the large increase in hardness on HPT is due to the grain refinement to the nanoscale, the increase in hardness on annealing is due to the precipitation of the hard ordered bcc phase.
Vicker’s hardness (HV) versus annealing temperature for Al0.3CoCrFeNi prepared by high-pressure torsion (after Ref. Reference Tang, Huang, Huang, Liao, Langdon and Dai22).

Mohanty et al. Reference Mohanty, Maity, Mukhopadhyay, Sarkar, Gurao, Bhowmick and Biswas23 prepared equiatomic AlCoCrFeNi by mechanical alloying followed by SPS to compact the powders. The as-milled structure consisted of fcc and bcc phases. After SPS, the structure consisted of three phases: the AlNiCoFe fcc phase, an Al–Ni rich L12 phase, and a tetragonal Cr–Fe–Co based sigma phase. It was concluded that the L12 and sigma phases result from the decomposition of the bcc phase, while the fcc phase structure does not change. The hardness increased with increasing sintering temperature with a maximum of about 8 GPa after sintering at 1273 K. This is believed to be due to the presence of the hard, brittle sigma phase. The fracture toughness was very low and attributed to the presence of the sigma phase.
Zhou et al. Reference Zhou, Hu, Huang and Luo24 studied the thermal stabilization of several high-entropy alloys with the addition of various elements predicted to segregate to the nanocrystalline grain boundaries and slow grain growth by either reducing the driving force for growth (thermodynamic stabilization) or the grain boundary mobility (kinetic stabilization). The alloys so studied, made by mechanical alloying, did indeed exhibit significantly enhanced stability for Ni base alloys compared to pure Ni and binary Ni systems. These alloys, Ni25Fe23Co23Cr23Zr2Nb2Mo2 and Ni80Mo6.6Ti6Nb6Ta1.4, clearly exhibit excellent thermal stabilization; however, it is not possible to determine whether thermodynamic or kinetic stabilization, or a combination of these, is the determining phenomenon.
Fu et al. Reference Fu, Chen, Wen, Zhang, Chen, Zheng, Zhou and Lavernia25 fabricated a single-phase fcc alloy with the composition Co25Ni25Fe25Al7.5Cu17.5 by mechanical alloying followed by powder consolidation using SPS. An arc-melted alloy with the same composition was prepared for comparison. XRD line broadening and TEM indicated that the as-milled structure was single-phase fcc with a grain size of about 24 nm. After SPS, the structure remained single phase but with a bimodal grain size of nanoscale and ultrafine grains. About 5 vol% of nanoscale twins were observed in the bulk nanocrystalline samples. The compressive strength of the bulk alloy was 1.795 GPa and the hardness was 4.45 GPa. The much larger values of strength and hardness compared to the as-cast samples were attributed to grain boundary and dislocation strengthening. This is one of the few examples of a single-phase high-entropy alloy which maintained at least partial nanocrystalline structure after powder consolidation and on which mechanical properties were measured.
With the exception of this last example by Fu et al. (2016), all the above alloys were multiphase after powder consolidation. The remainder of the article will discuss several alloys which are apparently single phase, at least under most conditions. These will include a refractory metal alloy, the well-studied Cantor alloy (CrMnFeCoNi), and a low-density alloy.
IV. A NANOCRYSTALLINE SINGLE-PHASE REFRACTORY METAL ALLOY
The single-phase refractory metal alloy, NbMoTaW, was prepared by d.c. magnetron cosputtering of thin films which had strongly textured nanoscale columnar grains. Reference Zhou, Ma and Spolenak26 Small scale pillars were machined from these thin films by the Ga-focused ion-beam method. The smallest pillars exhibited extraordinary high yield strengths of about 10 GPa. That is an order of magnitude higher than this alloy shows in bulk form. Compressive plastic strains of over 30% were observed. Depending on the preparation technique, with or without ion-beam assisted deposition, the average grain sizes of the films were 70 nm (with ion-beam assisted deposition) and 150 nm (without the ion-assisted deposition). Significant thermal stability was observed in the high-entropy alloy films in that after 3 days annealing at 1100 °C there was no obvious change in the grain size.
The above group continued the study of NbMoTaW pillars with nanocrystalline grain size. Reference Zou, Wheeler, Ma, Okle and Spolenak27 These pillars exhibited a remarkable yield strength of over 5 GPa at test temperatures up to 600 °C which was an order of magnitude greater than its coarse grained form and 5 times higher than its single-crystal equivalent. The nanocrystalline microstructure was maintained at elevated temperatures and APT revealed the presence of N, C, and O at grain boundaries. This resulted in observation with TEM of various nitrides and oxides (TaN, TaO, NbN, NbO, and WN) which presumably pin the grain boundaries and impede grain boundary mobility. Strain rate jump tests were used to determine the strain rate sensitivity, m. The nanocrystalline HEA pillars showed an almost constant m value with temperature of about 0.005. By contrast, the single-crystal HEA pillars showed a much larger m value of 0.025 at room temperature which decreased to about 0.01 at 600 °C.
V. RESEARCH ON NANOCRYSTALLINE, SINGLE-PHASE CANTOR ALLOY, CrMnFeCoNi
One of the most studied nominally single-phase high-entropy alloys is the equiatomic CrMnFeCoNi alloy first made by Cantor and co-workers, Reference Cantor, Chang, Knight and Vincent28 so is usually referred to as the “Cantor” alloy. This alloy is typically single-phase fcc. However, it has been shown that after severe plastic deformation by high-pressure torsion and annealing at 450 °C, the single-phase fcc structure becomes multiphase. Reference Schuh, Mendez-Martin, Volker, George, Clemens, Pippan and Hohenwarter29 It has also been shown that prolonged annealing at 700 °C also results in precipitation of second phases (M23C6 and sigma phase). Reference Pickering, Munoz-Moreno, Stone and Jones30 Therefore, this alloy is not really thermodynamically single phase, at least at intermediate temperatures. However, for many experiments under usual conditions it remains single-phase fcc for a variety of studies. The Cantor alloy was one of the many alloys produced for the thesis of Varalakshmi, Reference Varalakshmi3 under the supervision of B.S. Murty, by mechanical alloying that was nanocrystalline. This alloy was fcc as-milled and after annealing at 800 °C.
Zaddach et al. Reference Zaddach, Niu, Koch and Irving31 have studied the mechanical properties and stacking fault energies of the Cantor alloy, along with its precursor binary (NiFe), ternary (NiFeCr), and quraternary (NiFeCrCo) alloys with the same components and that exhibit the fcc structure. The alloy powders were prepared by mechanical alloying of elemental powders. The addition of small amounts of a process control agent (dodecane) or milling at liquid nitrogen temperature was carried out to minimize cold welding of the powders. XRD was conducted to analyze the structure. The PM2K software was used to analyze the diffraction patterns using the whole powder pattern modeling algorithm. Reference Leoni, Confente and Scardi32 The elastic constants were calculated by using density functional theory (DFT). The stacking fault energy (SFE) was then calculated as
 $$\gamma = {{{K_{111}}{\omega _0}{G_{\left( {111} \right)}}{a_0}{A^{ - 0.37}}} \over {\pi \sqrt 3 }} \cdot {{{\varepsilon ^2}} \over \alpha }\quad ,$$
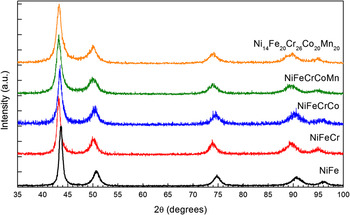
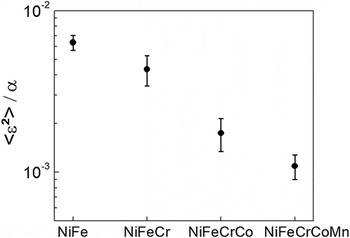
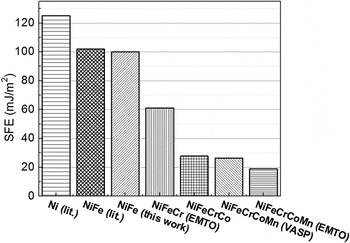
where K 111ω0 is assumed to be a constant 6.6 for all fcc materials, G (111) is the shear modulus in the (111) plane, a 0 is the lattice parameter, A is the Zener elastic anisotropy 2C 44/(C 11 − C 12), ε2 is the mean-square microstrain, and α is the stacking fault probability. Reference Schramm and Reed33 Figure 3 (Fig. 1, Ref. Reference Zaddach, Niu, Koch and Irving31) shows the XRD patterns of the as-milled equiatomic alloys and the Ni14Fe20Cr26Co20Mn20 alloy. Figure 4 (Fig. 3, Ref. Reference Zaddach, Niu, Koch and Irving31) shows the ratio of the mean-square microstrain to the stacking fault probability in the as-milled equiatomic alloys from the binary to the five component alloy. From the above equation, this value is related to the SFE by the elastic constants and the lattice parameter, which were determined by DFT. From these results it can be predicted that the SFE of the four- and five-component alloys will be nearly an order of magnitude lower than that of NiFe. This is illustrated in Fig. 5 (Fig. 4, Ref. Reference Zaddach, Niu, Koch and Irving31). While the SFEs of the equiatomic multiphase alloys are much lower than that of Ni, they are of the same order as many stainless steels. In an attempt to find alloys with lower SFE, the Ni content of the five component alloys was reduced and the Cr content correspondingly increased. This resulted in the observation of very low SFEs, for example 7.7 mJ/m2 in Ni14Fe21.5Cr21.5Co21.5Mn21.5 and 3.5 mJ/m2 for Ni14Fe20Cr26Co20Mn20. These values are comparable or lower than low SFE Cu-base alloys. Reference Zaddach, Niu, Koch and Irving31 The hardness values for the nanocrystalline as-milled alloys (grain size 10–20 nm) were high. For example, the hardness for NiFeCrCoMn was 7.8 GPa, suggesting a high yield strength of about 2.5 GPa.
XRD patterns of as-milled equiatomic NiFe, NiFeCr, NiFeCrCo, and NiFeCrCoMn. (Reproduced from Ref. Reference Pickering, Munoz-Moreno, Stone and Jones30, copyright 2013 by the Minerals, Metals & Materials Society. Used with permission.)

Ratio of mean-square microstrain to stacking fault probability for NiFe NiFeCr, NiFeCrCo, and NiFeCrCoMn. Error bars represent error from the stacking fault probability measurement. (Reproduced from Ref. Reference Zaddach, Niu, Koch and Irving31, copyright 2013 by the Minerals, Metals & Materials Society. Used with permission.)

SFEs of equiatomic fcc metals and alloys from pure Ni to NiFeCrCoMn. (Reproduced from Ref. Reference Zaddach, Niu, Koch and Irving31 copyright 2013 by the Minerals, Metals & Materials Society. Used with permission.)

Lee et al. Reference Lee, Choi, Seok, He, Lu, Suh, Kawasaki and Langdon34 processed the Cantor alloy by using high-pressure torsion on cast material. With a pressure of 6 GPa, it took only two revolutions to obtain a nanocrystalline grain size of about 40 nm. Nanoindentation measurements were conducted to measure hardness and to estimate the strain rate sensitivity. The microstructural and hardness evolution gave excellent agreement with the Hall–Petch relationship. The strain rate sensitivity remained about constant between the as-cast and after high-pressure torsion processing.
Shahmir et al. Reference Shahmir, He, Lu, Kawasaki and Langdon35 also processed the Cantor alloy by high-pressure torsion at a pressure of 6.0 GPa. However, they used up to 10 rotations. Even after 10 rotations, however, full homogeneity was not obtained. The as-HPT material reached a saturation hardness after 10 rotations of 4.4 GPa and the grain size was estimated to be about 10 nm. The as-HPT alloy was subsequently annealed at temperatures from 473 to 1173 K. The hardness increased at temperatures up to 773 K due to formation of sigma phase precipitates. The hardness decreased after annealing at higher temperatures up to 1173 K due to grain growth and precipitate dissolution. The formation of the brittle sigma phase at 873 and 973 K indicated that annealing at temperatures above 973 K was necessary to dissolve the brittle phase and improve the ductility. A short time anneal at 1073 K of 10 min gave the best combination of strength, 830 MPa, and ductility, 65% elongation to failure. It is not clear why the Cantor alloy prepared by HPT and nominally nanocrystalline had much lower hardness values than the alloy made by mechanical alloying of powder (Ref. Reference Zaddach, Niu, Koch and Irving31). The fact that the hardness in the HPT samples was not uniform across the samples even after 10 rotations may be significant, but the TEM does show nanoscale grains, so this remains an open question. Superplastic behavior with maximum elongation >600% was observed on testing at 973 K.
A similar set of experiments was carried out by Shahmir et al. Reference Shahmir, Nili-Ahmadabadi, Shafie and Langdon36 using HPT on a cast and homogenized (1000 °C for 12 h) alloy of composition CoCrFeNiMnTi0.1. That is, a Cantor alloy with Ti additions was studied. The high-pressure torsion processing was carried out with a pressure of 6 GPa and up to 10 rotations. The crystal structure of the cast and homogenized and the alloy after HPT was fcc with no evidence for other phases. There was an increase in hardness with increasing number of rotations but full homogeneity of hardness across the sample disk was not attained even after 10 rotations. The microhardness reached a saturation hardness of about 4.5 GPa. This was about 3 times harder than the homogenized alloy. The Hall–Williamson method was used to estimate the nanocrystalline grain size from the broadening of the XRD lines. The grain size was determined to be about 30 nm, compared to about 15 nm from their previous study on the Cantor alloy without Ti (Ref. Reference Shahmir, He, Lu, Kawasaki and Langdon35). On annealing the samples after HPT at temperatures from 773 to 1073 K second phases were observed to precipitate. These included a Cr-rich bcc phase and small amounts (low intensities of the X-ray lines) of a Cr-rich sigma phase. However, on annealing at 1173 K, these phases went back into solution and the single-phase fcc phase was again obtained. The hardness increased with annealing temperature with a maximum hardness after annealing at 773 K of about 5.4 GPa presumably due to the precipitation of the phases noted above. At higher annealing temperatures the hardness decreased because of grain growth, and eventually the dissolution of the precipitates, such that after annealing at 1173 K the hardness had dropped to about 1.4 GPa which was similar to that of the homogenized samples before HPT. In comparison with the Cantor alloy, the hardness values and the thermal stability were somewhat higher with the addition of 2 at.% Ti in the annealing temperature range of 773–1073 K.
Heczel et al. Reference Heczel, Kawasaki, Labar, Jang, Langdon and Gubicza37 studied the evolution of the defect structure, grain size, and hardness as a function of HPT processing intensity. In the initial as-cast samples, the grain size was determined to be about 60 μm. After 2 rotations of HPT, the grain size was reduced to about 30 nm at the edge of the disk. At the same condition of HPT, at the center of the disk, grain size was only reduced to about 4 μm which indicates the high sensitivity of the grain refinement on the magnitude of the shear strain from the center to the edge of the disk. The dislocation densities were determined from the XRD lines using the Convolutional Multiple Whole Profile method. The dislocation density increased rapidly with increasing strain, i.e., number of rotations in HPT processing. After 1/4 turn, dislocation densities were found with values of about 43 and 91 × 1014 m−2 measured at the center and the edge of the disk, respectively. Straining up to 2 rotations increased the dislocation densities to about 126 and 194 × 1014 m−2 in the center and at the edge, respectively. The high shear strains at the edge of the disks processed by 1 and 2 rotations of HPT gave large twin fault probabilities of about 2.2 and 2.7% as measured by the XRD technique. These were in good agreement with the TEM observations of twin fault spacing of 8–10 nm. As with the microstructure, there was a large gradient in the hardness along the disk radius. After 1/4 rotation, the hardness in the disk center was about 2.4 GP and at the disk edge, about 4.9 GPa.
Liu et al. Reference Liu, Wang, Fang, Liu, Wu and Chen38 prepared the Cantor alloy by the following processing steps. Rapid solidification by gas-atomization, followed in some cases by mechanical alloying, and final compaction by SPS. The powders and compacts that had mechanical alloying in the process had the finest grain sizes. However, after SPS, the grain size distribution ranged from about 100 to 500 nm, so not really nanocrystalline. After SPS, the alloy had a tensile strength of about 1.2 GPa and about 10% elongation to fracture in tension.
Maier-Kiener et al. Reference Maier-Kiener, Schuh, George, Clemens and Hohenwarter39 used HPT to prepare a nanocrystalline Cantor alloy. The HPT conditions were a pressure of 7.8 GPa and 5 rotations. The grain size estimated from TEM was about 50 nm and the hardness was approximately 6.5 GPa. The alloy was subjected to various heat treatments to decompose it into multiple metallic and intermetallic phases as determined by advanced high-resolution TEM methods. Nanoindentation was used to measure mechanical properties. Hardness and Young’s modulus both showed an increase with annealing temperature, followed by a decrease at higher temperatures. The initial hardness increase was due to the precipitation of nanoscale phases while the subsequent softening was due to grain growth and dissolution of the precipitates.
VI. A LOW-DENSITY, SINGLE-PHASE, NANOCRYSTALLINE ALLOY
A low-density (2.77 g/cc) high-entropy alloy with composition Al20Li20Mg10Sc20Ti30 has been prepared by mechanical alloying of elemental powders. Reference Youssef, Zaddach, Niu, Irving and Koch40 The results of our mechanical alloying of the selected alloy, Al20Li20Mg10Sc20Ti30, must be divided into two materials—one which contained mainly the 5 components intentionally added, and another, which besides these components had significant impurity content of nitrogen and oxygen.
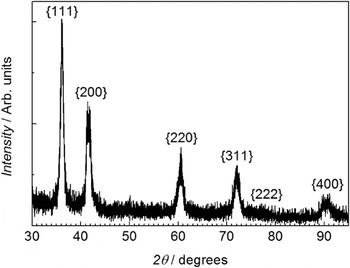
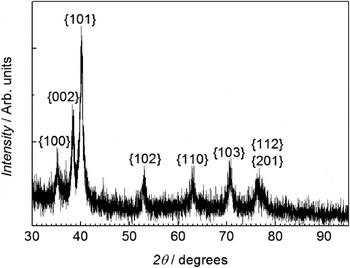
The material prepared by mechanical alloying which did not have the high N, O impurity levels was observed to have a single-phase fcc crystal structure in the as-milled condition as illustrated in Fig. 6. It had a nanocrystalline grain size as estimated by the Scherrer formula to be about 12 nm. The lattice parameter of this sample determined by the method of Cohen was found to be 0.4323 nm. The mechanical hardness of this sample was a very high 5.8 GPa. After annealing this sample at 500 °C for 1 h, the crystal structure changed as shown in Fig. 7. The new structure was indexed to be hcp with c/a ratio = 1.588. The grain size again estimated by the Scherrer method was 26 nm. The mechanical hardness had dropped to 4.9 GPa.
XRD pattern of as-milled alloy (Al20Li20Mg10Sc20Ti30). fcc structure (Ref. Reference Youssef, Zaddach, Niu, Irving and Koch40).

XRD pattern of uncontaminated alloy after annealing at 500 °C. hcp structure (Ref. Reference Youssef, Zaddach, Niu, Irving and Koch40).

The material with the higher N and O concentrations (0.4 at.% N, 1.39 at.% O as determined by chemical analysis) apparently obtained this contamination from a batch of Sc powder which was contaminated during the process of converting the as-received pellets into powder by cryomilling. Subsequent batches did not contain these impurities and were used in the above sample. The contaminated sample exhibited an as-milled structure essentially identical to that of the uncontaminated sample, that is, single-phase fcc with a grain size of about 12 nm. However it had a slightly higher mechanical hardness of 6.1 GPa. After annealing at 500 °C, it maintained the fcc single-phase and the hardness only dropped to 5.9 GPa. Annealing for 1 h at 800 °C kept the structure as single-phase fcc and the hardness only decreased to 5.75 GPa. These lower hardness values are consistent with the somewhat larger nanocrystalline grain sizes of about 32 nm after the 800 °C anneal.
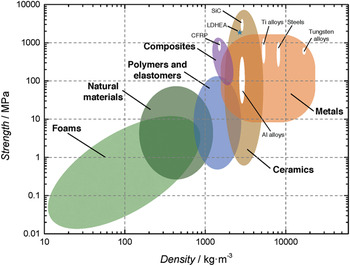
The high mechanical hardness of these alloys can partly be explained by their nanocrystalline grain sizes. However, their hardness values exceed nanocrystalline Al base alloys, for example, by factors of 2–3 times. A comparison of the hardness and density of these alloys with other structural materials is given in Fig. 8. It is clear that these materials are comparable in strength/density values to ceramic materials such as SiC. However, this metallic alloy should exhibit much higher toughness and ductility.
Ashby plot of strength versus density for engineering materials. The LDHEA is shown by the “star” (Ref. Reference Youssef, Zaddach, Niu, Irving and Koch40).

Calculations of the energies of the competing structures are consistent with the experimental observations. This material exhibits a combination of hardness (strength) and low density that is not equaled by any other metallic material.
VII. SUMMARY
This review on nanostructured high-entropy alloys emphasized those made by severe deformation methods, in particular mechanical alloying, and to a lesser extent, high-pressure torsion. An example of thin film refractory metal alloys made by magnetron sputtering was also presented. The article began with a discussion of the seminal research of B.S. Murty and his co-workers who first produced nanocrystalline high-entropy alloys by mechanical alloying of powders. They often found single-phase bcc or fcc alloys with high hardness and apparently good thermal stability. This was followed by a listing, in mostly chronological order, of research by mechanical alloying on mainly 3d transition metal base alloys (with other addtions such as Al, Zn, Mo, etc.) that typically were observed to be multiphase, but usually bcc and fcc. The details of the crystal structures, microstructures, and mechanical properties (usually hardness) for these various studies were given. Two articles on a refractory metal alloy (NbMoTaW) made by magnetron sputtering in thin film form and also on pillars fabricated from the films was given. The well-studied Cantor alloy (CrMnFeCoNi) has also been made by either mechanical alloying or high-pressure torsion and results on its microstructure, stability, and mechanical behavior were presented. Finally, an exciting nanocrystalline low-density high-entropy alloy with single-phase fcc or hcp structure was described, which has the highest strength (hardness)-to-weight ratio of any metallic material.