





Introduction
Weed management in modern agriculture places a strong emphasis on chemical weed control. However, as herbicide-resistant weeds become widespread and important herbicides lose their efficacy, there is a need for supplementing chemical weed control with nonchemical strategies. Integrated weed management (IWM) applies science-based practices grounded in weed ecology and relies on diverse control practices (Harker and O’Donovan Reference Harker and O’Donovan2013; Swanton et al. Reference Swanton, Mahoney, Chandler and Gulden2008). Cover cropping is an important IWM practice that can prevent weed emergence and hinder seedling growth after emergence (Teasdale Reference Teasdale1996). Cereal rye (Secale cereale L.) is the most widely grown cover crop species in the United States due to its economic and environmental benefits (Huddell et al. Reference Huddell, Thapa, Marcillo, Abendroth, Ackroyd, Armstrong, Asmita, Bagavathiannan, Balkcom, Basche, Beam, Bradley, Canisares, Darby and Davis2024). Cereal rye used as a cover crop improves the soil environment by increasing soil aggregate stability (Rorick and Kladivko Reference Rorick and Kladivko2017), soil microbial populations (Finney et al. Reference Finney, Buyer and Kaye2017), and soil nutrient storage in organic matter (Meisinger et al. Reference Meisinger, Hargrove, Mikkelsen, Williams, Benson and Hargrove1991; Poffenbarger et al. Reference Poffenbarger, Mirsky, Kramer, Weil, Meisinger, Cavigelli and Spargo2015). Incorporating a cereal rye cover crop into IWM programs, complemented by herbicides, can effectively manage herbicide-resistant weeds (Sherman et al. Reference Sherman, Haramoto and Green2020; Wells et al. Reference Wells, Reberg-Horton, Smith and Grossman2013). Previous studies have shown that cereal rye can reduce weed seedling emergence from 30% to 90% (Kruidhof et al. Reference Kruidhof, Bastiaans and Kropff2009; Mirsky et al. Reference Mirsky, Curran, Mortensen, Ryan and Shumway2011). Therefore, cover crops have strong potential to improve weed management by reducing overall weed pressure and minimizing chemical inputs.
It has been documented that higher cover crop biomass production results in better weed suppression (Haramoto Reference Haramoto2019; Mirsky et al. Reference Mirsky, Curran, Mortensen, Ryan and Shumway2011; Pittman et al. Reference Pittman, Barney and Flessner2020; Ryan et al. Reference Ryan, Mirsky, Mortensen, Teasdale and Curran2011b); however, cereal rye biomass production can be highly variable and is influenced by climate and management. Cereal rye biomass production can range from ∼1,000 kg ha−1 in cold, dry regions to ∼10,000 kg ha−1 in warm, humid areas (Kessavalou and Walters Reference Kessavalou and Walters1997; Mirsky et al. Reference Mirsky, Curran, Mortensen, Ryan and Shumway2011). Mirsky et al. (Reference Mirsky, Ryan, Teasdale, Curran, Reberg-Horton, Spargo, Wells, Keene and Moyer2013) argue that biomass production >8,000 kg ha−1 is necessary for >75% weed suppression in the absence of any chemical control. However, there is evidence that such high cereal rye biomass levels may not be an absolute requirement for weed suppression. Wells et al. (Reference Wells, Reberg-Horton, Smith and Grossman2013) achieved >75% reduction in Amaranthus spp. population densities with 4,500 kg ha−1 of cereal rye biomass in North Carolina. In southeast Texas, Samuelson (Reference Samuelson2020) documented 66% suppression of annual grasses with 5,000 kg ha−1 of cereal rye biomass. Thus, cover crop biomass suppresses weeds to varying degrees depending on species, environment, and management, underscoring the importance of recognizing the additional mechanisms by which cereal rye suppresses weeds.
Cereal rye has the potential to influence soil water content and temperature. Cover crop residues may aid in improving soil water storage by reducing runoff and surface evaporation, which in turn reduces the average soil temperatures (Wells et al. Reference Wells, Reberg-Horton and Mirsky2014). Teasdale and Mohler (Reference Teasdale and Mohler1993) reported that cereal rye residues reduced maximum soil temperatures in the spring by 3 C compared with bare ground. They also reported a slight increase in minimum soil temperature, showing that the total thermal amplitude of the soil was reduced. Vann et al. (Reference Vann, Reberg-Horton, Edmisten and York2018) also observed a reduction in average spring soil temperature when cereal rye residue was present. Reducing spring soil temperatures can delay the emergence of summer annual weeds, offering crops an early-season competitive advantage. Additionally, cereal rye residues can reduce near-surface soil water available to weeds, further suppressing weed establishment (Kessavalou and Walters Reference Kessavalou and Walters1997; Snapp et al. Reference Snapp, Swinton, Labarta, Mutch, Black, Leep, Nyiraneza and O’Neil2005). In perennial crop systems, for example, cover crops are used to reduce water in the upper soil horizon where most weed seeds germinate and establish, without affecting the deep-rooted crop (Delpuech and Metay Reference Delpuech and Metay2018). However, this mechanism affects only summer annual weeds in regions where water is a limiting factor and rainfall cannot replenish the water used by the cover crop.
Cereal rye provides other benefits that may not be immediately obvious to growers. It can limit weed emergence and development by depleting the nutrient reserves in the soil (Menalled et al. Reference Menalled, Pethybridge, Pelzer, Smith, DiTommaso and Ryan2021). The nutrient-scavenging ability of cereal rye allows it to store soil nutrients in its tissues, which will starve subsequently emerging weeds (Williams et al. Reference Williams, Scott Wells, Dickey, Hu, Maul, Raskin, Reberg-Horton and Mirsky2018). Scientists recommend the use of winter cover crops to scavenge residual nitrogen before a legume crop like soybean [Glycine max (L.) Merr.], suppressing weeds with minimal impact on the crop’s symbiotic N fixation potential (Ryan et al. Reference Ryan, Mirsky, Mortensen, Teasdale and Curran2011b; Wells et al. Reference Wells, Reberg-Horton, Smith and Grossman2013). This mechanism, however, could reduce soil nutrient availability to the crop if not managed correctly (Poffenbarger et al. Reference Poffenbarger, Mirsky, Kramer, Weil, Meisinger, Cavigelli and Spargo2015). Low nutrient availability slows down weed development, reduces reproductive potential, and may even prevent the emergence of annual species (Little et al. Reference Little, DiTommaso, Westbrook, Ketterings and Mohler2021; Pandeya et al. Reference Pandeya, López-Arredondo, Janga, Campbell, Estrella-Hernández, Bagavathiannan, Herrera-Estrella and Rathore2018; Sweeney et al. Reference Sweeney, Renner, Laboski and Davis2008). Previous research has shown that weed biomass can be reduced by half in soils low in N compared with soils with high concentrations of nitrates (NO3 −) (Menalled et al. Reference Menalled, Pethybridge, Pelzer, Smith, DiTommaso and Ryan2021).
Beyond physical suppression, alteration of soil water and temperature, and competition for nutrients, other mechanisms may also play a role in total weed suppression by cover crops (Camargo Silva and Bagavathiannan Reference Camargo Silva and Bagavathiannan2023). For instance, the cereal rye canopy can reduce the quantity (Wayman et al. Reference Wayman, Cogger, Benedict, Collins, Burke and Bary2015) and quality (the red to far-red [R/FR] ratio) of sunlight reaching below its canopy (Ballaré et al. Reference Ballaré, Sánchez, Scopel, Casal and Ghersa1987; Teasdale and Mohler Reference Teasdale and Mohler1993). The reduction in light quantity can prevent the germination of positive photoblastic weed seeds (Yamashita et al. Reference Yamashita, Guimarães and Cavenaghi2011). Furthermore, cereal rye produces allelopathic compounds such as benzoxazinoids and phenolic acids that are known to inhibit weed seed germination and early seedling development (Reiss et al. Reference Reiss, Fomsgaard, Mathiassen, Stuart and Kudsk2018; Schulz et al. Reference Schulz, Marocco, Tabaglio, Macias and Molinillo2013).
In Texas, cereal rye biomass production can be highly variable and typically lower than in many northern U.S. states (Samuelson Reference Samuelson2020). The influence of lower biomass levels on weed suppression across diverse environments is poorly understood. Moreover, the extent to which cereal rye residues affect soil water, temperature, and nutrients, and how these changes translate into weed suppression, remains to be studied. Understanding these mechanisms could improve the development of robust IWM strategies with cover crops. The objective of this study was to quantify how cereal rye biomass gradients (driven by seeding rate and termination timing) affect soil moisture, temperature, and nutrients and, in turn, influence weed seedling emergence in the subsequent cotton (Gossypium hirsutum L.) crop. The effects of cereal rye biomass on light quantity/quality and on allelopathy are beyond the scope of this study.
Materials and Methods
Experimental Site
A field experiment investigating the relationships between cereal rye cover crop biomass, soil water, soil temperature, soil nutrients, and weed suppression was conducted at the Texas A&M Research Farm in Burleson County, TX (30.536688°N, 96.426588°W) from fall 2020 to summer 2021 and was repeated in 2021 to 2022. The climate is described as humid subtropical, with most rainfall occurring in winter and spring. The soil was a uniform Belk clay (fine, mixed, active, thermic Entic Hapluderts).
Treatment Details
The study used a split-plot design with four replications. The main plot factors were three cereal rye seeding rates (20, 40, and 80 kg ha−1) and a fallow control (0 kg ha−1). The recommended planting rate in the region is 40 kg ha−1 (Casey Reference Casey2012). The subplot factors were cover crop termination timings: 6, 4, and 2 wk before planting (WBP) cotton. The main plots were 26-m long and 9-m wide, with 1.5-m alleyways between them. Each subplot was 7.5-m long and 9-m wide, with 1.5-m alleys. The ‘Wrens Abruzzi’ cereal rye cover crop was planted on September 29, 2020, and November 20, 2021, using a no-till native grass drill (Great Plains, Salina, KS). The cover crop was grown under rainfed conditions, with no supplemental irrigation or fertilization. Cereal rye was terminated with glyphosate (Roundup PowerMax®, Bayer CropScience, St. Louis, MO) at a rate of 870 g ae ha−1 in the springs of 2021 and 2022. The fallow plots were also treated with glyphosate to terminate weeds at the same time as the cover crop treatments. The cotton (‘DP 1646 B2XF’; dicamba, glyphosate, and glufosinate resistant) was planted at 112,000 seeds ha−1 on April 28, 2021, and April 20, 2022, at 15 d after the latest cover crop termination timing. Liquid urea ammonium nitrate (28-0-0) was applied in bands near the cotton plants using a knife implement at 1 mo after planting at a rate of 90 kg N ha−1. In addition, paraquat (Gramoxone®, Syngenta Crop Protection, Greensboro, NC) defoliant was applied at 104 g ai ha−1 before cotton harvest (early October) in 2021 and 2022. The cotton crop was grown under rainfed conditions with no supplemental irrigation other than one flood irrigation event on June 28, 2022. No insect or disease management treatments were needed.
Data Collection
Cereal rye biomass samples were collected at termination in all subplots. All aboveground cereal rye plant tissue in three randomly placed 0.25-m2 quadrats per subplot was harvested. The biomass of winter weeds present in these quadrats was also collected. The winter annual weed population was dominated by wild radish (Raphanus raphanistrum L.), cutleaf evening primrose (Oenothera laciniata Hill), and henbit (Lamium amplexicaule L.). The cover crop and weed biomass samples were then dried at 45 C for 7 d (until constant weight) and weighed to estimate total biomass production.
Soil temperature and soil water in each subplot were measured using permanent HOBOnet T11 sensors (Onset, Cape Cod, MA). Due to equipment cost, only three replicates were monitored (one sensor per subplot). The sensor prongs were installed vertically to monitor temperature at a depth of 3 to 5 cm and moisture at a depth of 5 to 10 cm, where weed seeds germinate (Benvenuti et al. Reference Benvenuti, Macchia and Miele2001) and where most weed and cover crop root growth occurs (Chen and Weil Reference Chen and Weil2010; Place et al. Reference Place, Bowman, Burton and Rufty2008). The sensors logged readings every 30 min, from which daily maximum, minimum, and mean soil temperatures, as well as daily mean soil water content were derived from the time the cover crop was planted until cotton harvest. Data were received and stored by a HOBOnet RX3000 data logger (Onset). The data from the three sensors in each treatment were averaged.
Soil samples were taken before cover crop planting in the fall and before termination in the spring. Nine soil cores (15-cm deep, 3-cm diameter) were randomly collected from each plot using a manual soil probe and combined into a single sample for nutrient analysis. A homogenized subsample was then sent to the Texas A&M AgriLife Extension Service Soil, Water and Forage Testing Laboratory in College Station, TX, for analysis. The samples were analyzed for pH, electrical conductivity, nitrate, P, K, Ca, Mg, S, and Na (Texas A&M AgriLife Extension 2012). The Mehlich III extraction method was used to determine P, K, Ca, Mg, Na, and S content (Mehlich Reference Mehlich1984). Nitrate was determined by reducing nitrate to nitrite with a cadmium column and then performing spectrophotometric measurements (Kachurina et al. Reference Kachurina, Zhang, Raun and Krenzer2000). Soil pH was measured using a hydrogen-selective electrode (Schofield and Taylor Reference Schofield and Taylor1955). Electrical conductivity was measured using a conductivity probe (Rhoades Reference Rhoades and Page1982). Soil analysis results were used to determine differences in soil nutrient content and uptake between cover crop treatments. Soil nutrient levels at cover crop planting (initial) were subtracted from those recorded at termination (final) to determine soil nutrient change in each plot.
Summer weed population densities were determined in May, approximately 3 wk after cotton planting, and again in July, at 14 wk after cotton planting. For this purpose, weed seedling densities were counted in three randomly placed 0.25-m2 quadrats per subplot. The quadrats were marked, and subsequent data were collected from the same areas each time. The weeds were counted by species. The summer annual weed population was mainly composed of barnyardgrass [Echinochloa crus-galli (L.) P. Beauv.], Texas millet [Urochloa texana (Buckley) R. Webster], and browntop millet [Urochloa ramosa (L.) Nguyen], and annual broadleaf weeds like Palmer amaranth (Amaranthus palmeri S. Watson), hophornbeam copperleaf (Acalypha ostryifolia Riddell), common sunflower (Helianthus annuus L.), and ragweed parthenium (Parthenium hysterophorus L.). Total summer weed emergence was expressed as the percent reduction in population density relative to the mean density observed in fallow (no-cover crop) plots, as follows:
 $x = 100 - (100\ ^*\,y/z)$
where x is the percent reduction in weed emergence, y is the weed density in a given cover crop treatment, and z is the weed density in the fallow treatment. After each seedling count, plots were sprayed with glufosinate (Liberty®, BASF Corporation, Florham Park, NJ) at a rate of 420 g ai ha−1 to prevent the same individuals from being counted in the subsequent observation.
Statistical Analysis
Normality of all data was assessed using the Shapiro-Wilk test (α = 0.05) in the PROC UNIVARIATE procedure in SAS v. 9.4 (SAS Institute, Cary, NC). If the normality requirements were not met, biomass data were log-transformed, and weed count data were square-root transformed before analysis. ANOVA was conducted using the PROC GLIMMIX (generalized linear mixed model) in SAS. Fixed effects included cereal rye seeding rate, termination timing, and years. Replications were treated as random effects. Means were separated using Fisher’s protected LSD test (α = 0.05).
To compare the effect of high cereal rye biomass on soil water and temperature, the soil sensor data from one high biomass–yielding treatment (80 kg ha−1 seeding rate, 2 WBP termination) were plotted along with a fallow treatment (0 kg ha−1 seeding rate, 2 WBP termination) with a time-series graphing tool in Microsoft Excel. For each year, the 5 d with the greatest differences in soil temperature parameters between the fallow plots and the highest seeding rate plots in late spring/early summer were compared using a Student’s t-test (2021: March 20, March 30, April 7, April 12, May 18; 2022: March 16, March 28, April 5, April 12, May 18). The daily maximum, minimum, and mean soil temperatures, as well as the daily mean soil water content values for each selected treatment on each day, were analyzed using PROC TTEST (paired two-sample for means) in SAS (α = 0.05; hypothesized mean difference = 0).
The changes in soil N, P, and K levels in each treatment were regressed against cereal rye biomass in each plot using PROC REG in SAS to determine their effects on soil nutrient content. A linear model was fit to the data. To determine the effect of cereal rye biomass production on weed suppression, the percent reduction in weed densities was correlated with the cover crop biomass values in their corresponding plots using Pearson’s correlation analysis (PROC CORR) in SAS. If the correlation was significant, a linear regression model was fit to the data.
To effectively differentiate weed emergence patterns as influenced by cover crop biomass gradients, the plots were grouped into four biomass categories: fallow (0 kg ha−1), low (<2,000 kg ha−1), medium (2,000 to 4,000 kg ha−1), and high (>4,000 kg ha−1). The weed emergence values in each plot were converted to total cumulative weed emergence at each observation time. The cumulative emergence values for each biomass category were fit using a sigmoidal four-parameter curve (Chapman equation) in SigmaPlot v. 14.5 (Systat Software, San Jose, CA), which took the following form:
 $E\left( t \right) = {y_0} + a{\left[ {1-{\rm exp}\left( {-bt} \right)} \right]^c}$
where E(t) is cumulative emergence, y 0 is the lower asymptote, a is the upper asymptote, b is the rate of emergence, c is the curve shape parameter, and t is the time component. Under normal conditions, weed emergence follows a sigmoidal pattern, with a lower asymptote of zero (Bagavathiannan et al. Reference Bagavathiannan, Norsworthy, Smith and Burgos2011). Different kinds of sigmoidal models have been used to describe weed emergence patterns, as they can be influenced by environmental conditions, weed species, and region (Gonzalez-Andujar et al. Reference Gonzalez-Andujar, Chantre, Morvillo, Blanco and Forcella2016). The Chapman equation, which has been typically used to model weed emergence patterns, especially when the initial germination is very rapid (García et al. Reference García, Recasens, Forcella, Torra and Royo-Esnal2013; Tursun et al. Reference Tursun, Akinci, Şahin and Uludağ2015), provided the best fit for our data.
To determine the time to 5%, 50%, and 95% weed emergence for each biomass category, the total weed emergence values were converted to percentages of the total cumulative emergence. These values were fit with a sigmoidal curve in SigmaPlot using the same Chapman equation. The predicted times to 5%, 50%, and 95% weed emergence under each biomass category were calculated using the equations provided by the models. To test for significant differences in the predicted times to 5%, 50%, and 95% weed emergence, the values were analyzed using PROC ANOVA in SAS. Means were separated using Tukey’s honestly significant difference test (α = 0.05).
Results and Discussion
Cereal Rye Biomass Production
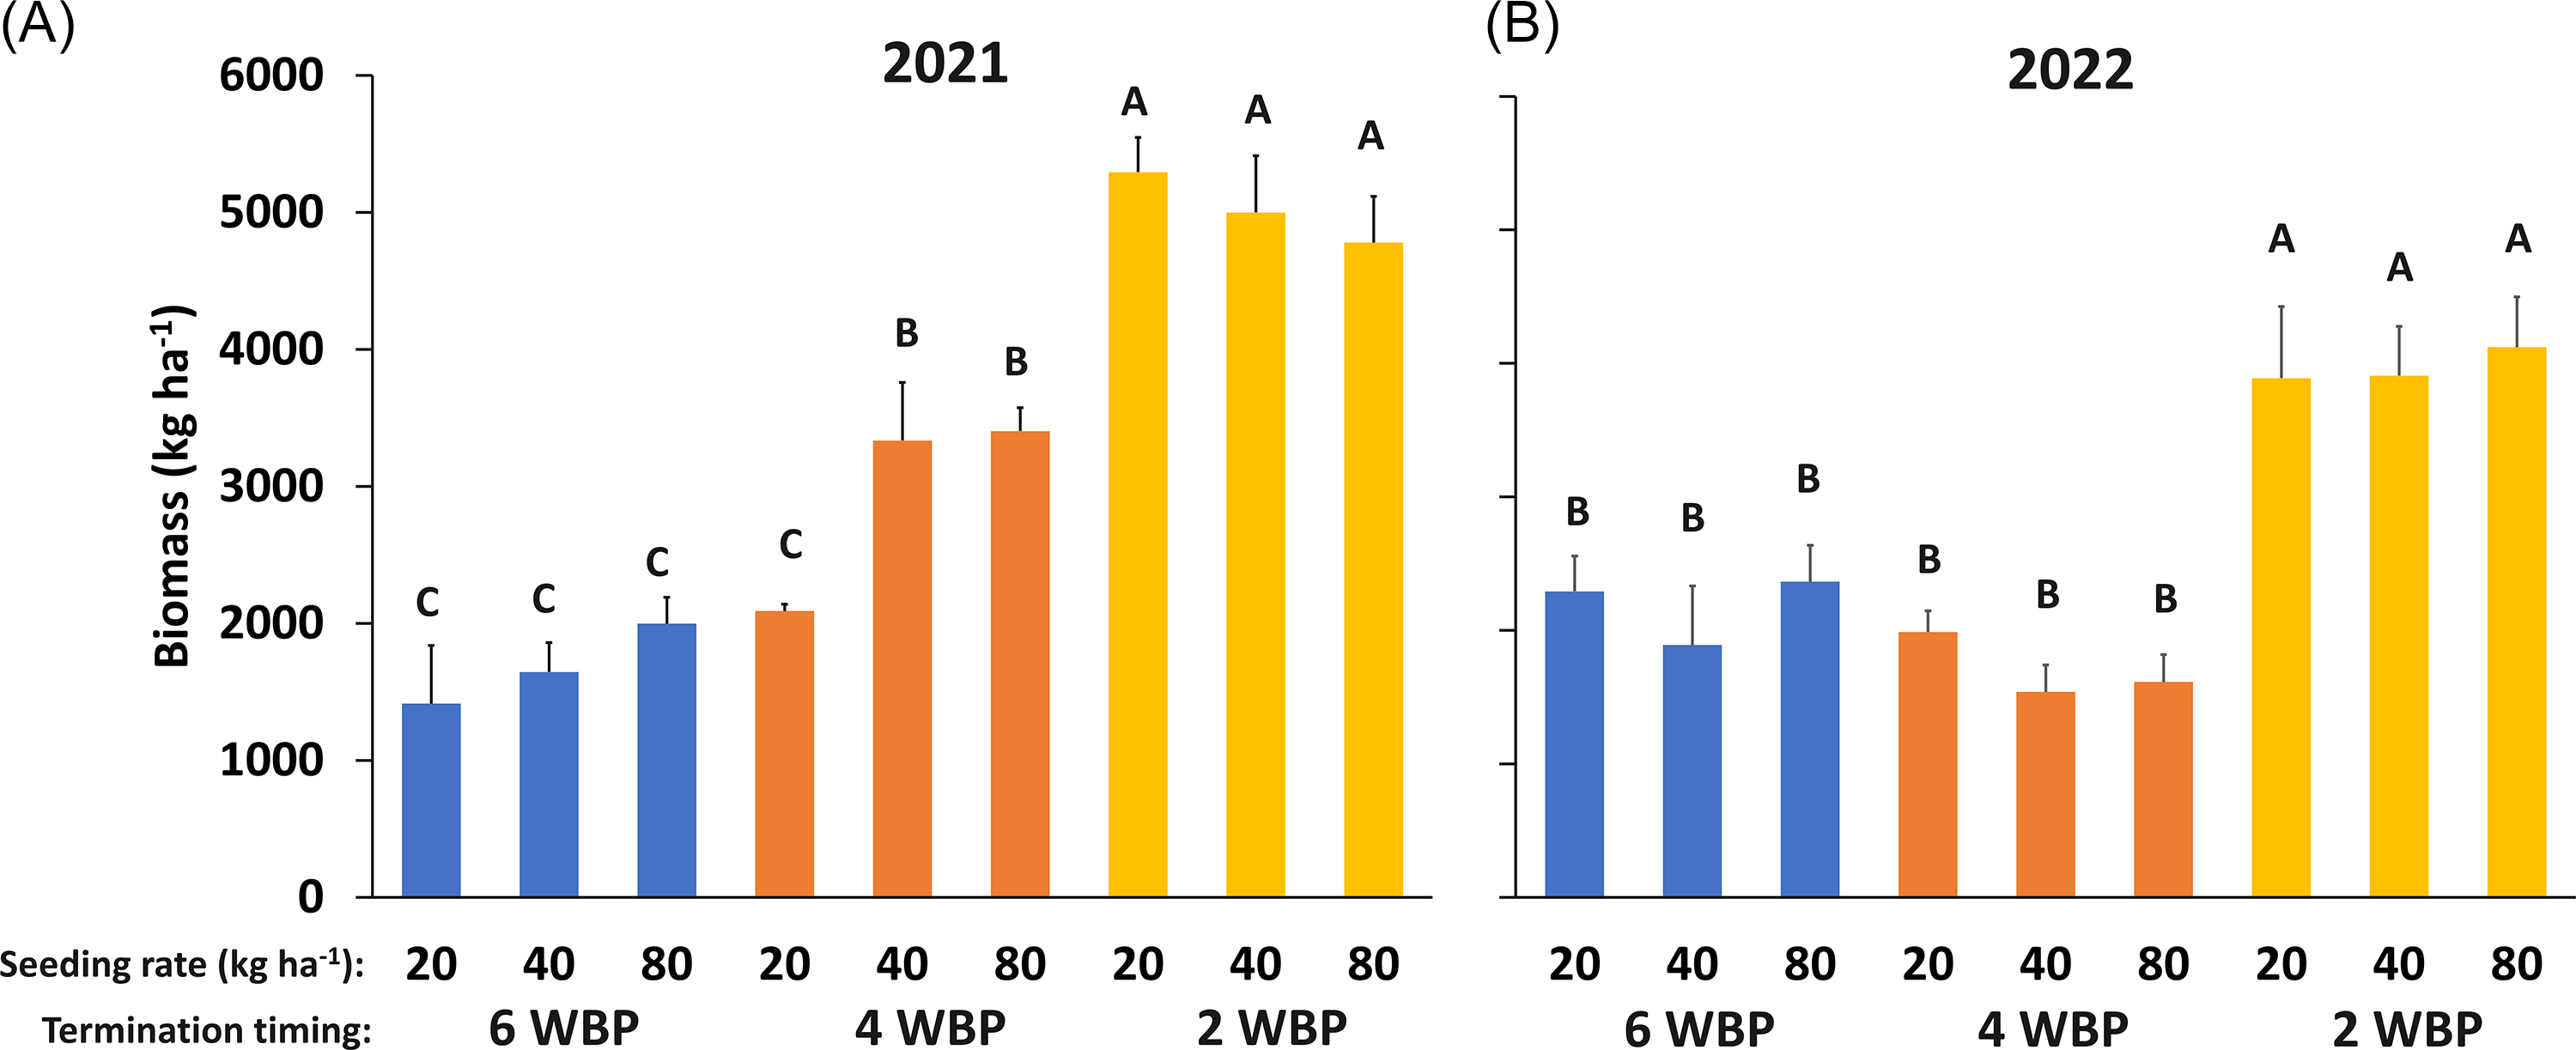
Cereal rye biomass increased with later termination timings (P < 0.0001) but was mostly unaffected by the seeding rate (P > 0.05) in both years (Figure 1). There were no interactions between seeding rate and termination timing (P > 0.05). There was a significant effect of year (P < 0.05); thus, results are presented separately by year. In 2021, the highest cereal rye cover crop biomass (5,000 kg ha−1) was produced when cereal rye was terminated 2 WBP cotton, followed by 4 WBP (3,000 kg ha−1) and 6 WBP (1,600 kg ha−1), when averaged across the seeding rates (Figure 1A). Cover crop biomass in 2022 averaged 4,000, 1,700, and 2,200 kg ha−1 for 2, 4, and 6 WBP, respectively (Figure 1B); the biomass difference between the 4 and 6 WBP termination timings was not significant. The generally higher biomass levels in 2021 were likely due to an earlier fall planting date and a wet spring, conditions that greatly favor cereal rye biomass production (Mirsky et al. Reference Mirsky, Curran, Mortensen, Ryan and Shumway2011).
Cereal rye biomass production in College Station, TX, at three termination timings in (A) Spring 2021 and (B) Spring 2022. The termination timings are presented as weeks before planting cotton (WBP) (6 WBP = blue bars; 4 WBP = orange; 2 WBP = yellow). Cereal rye cover crop seeding rates are labeled under each bar. Bars topped with different letters denote significant differences (P < 0.05) based on Fisher’s protected LSD test. Years were considered a fixed effect and analyzed separately.

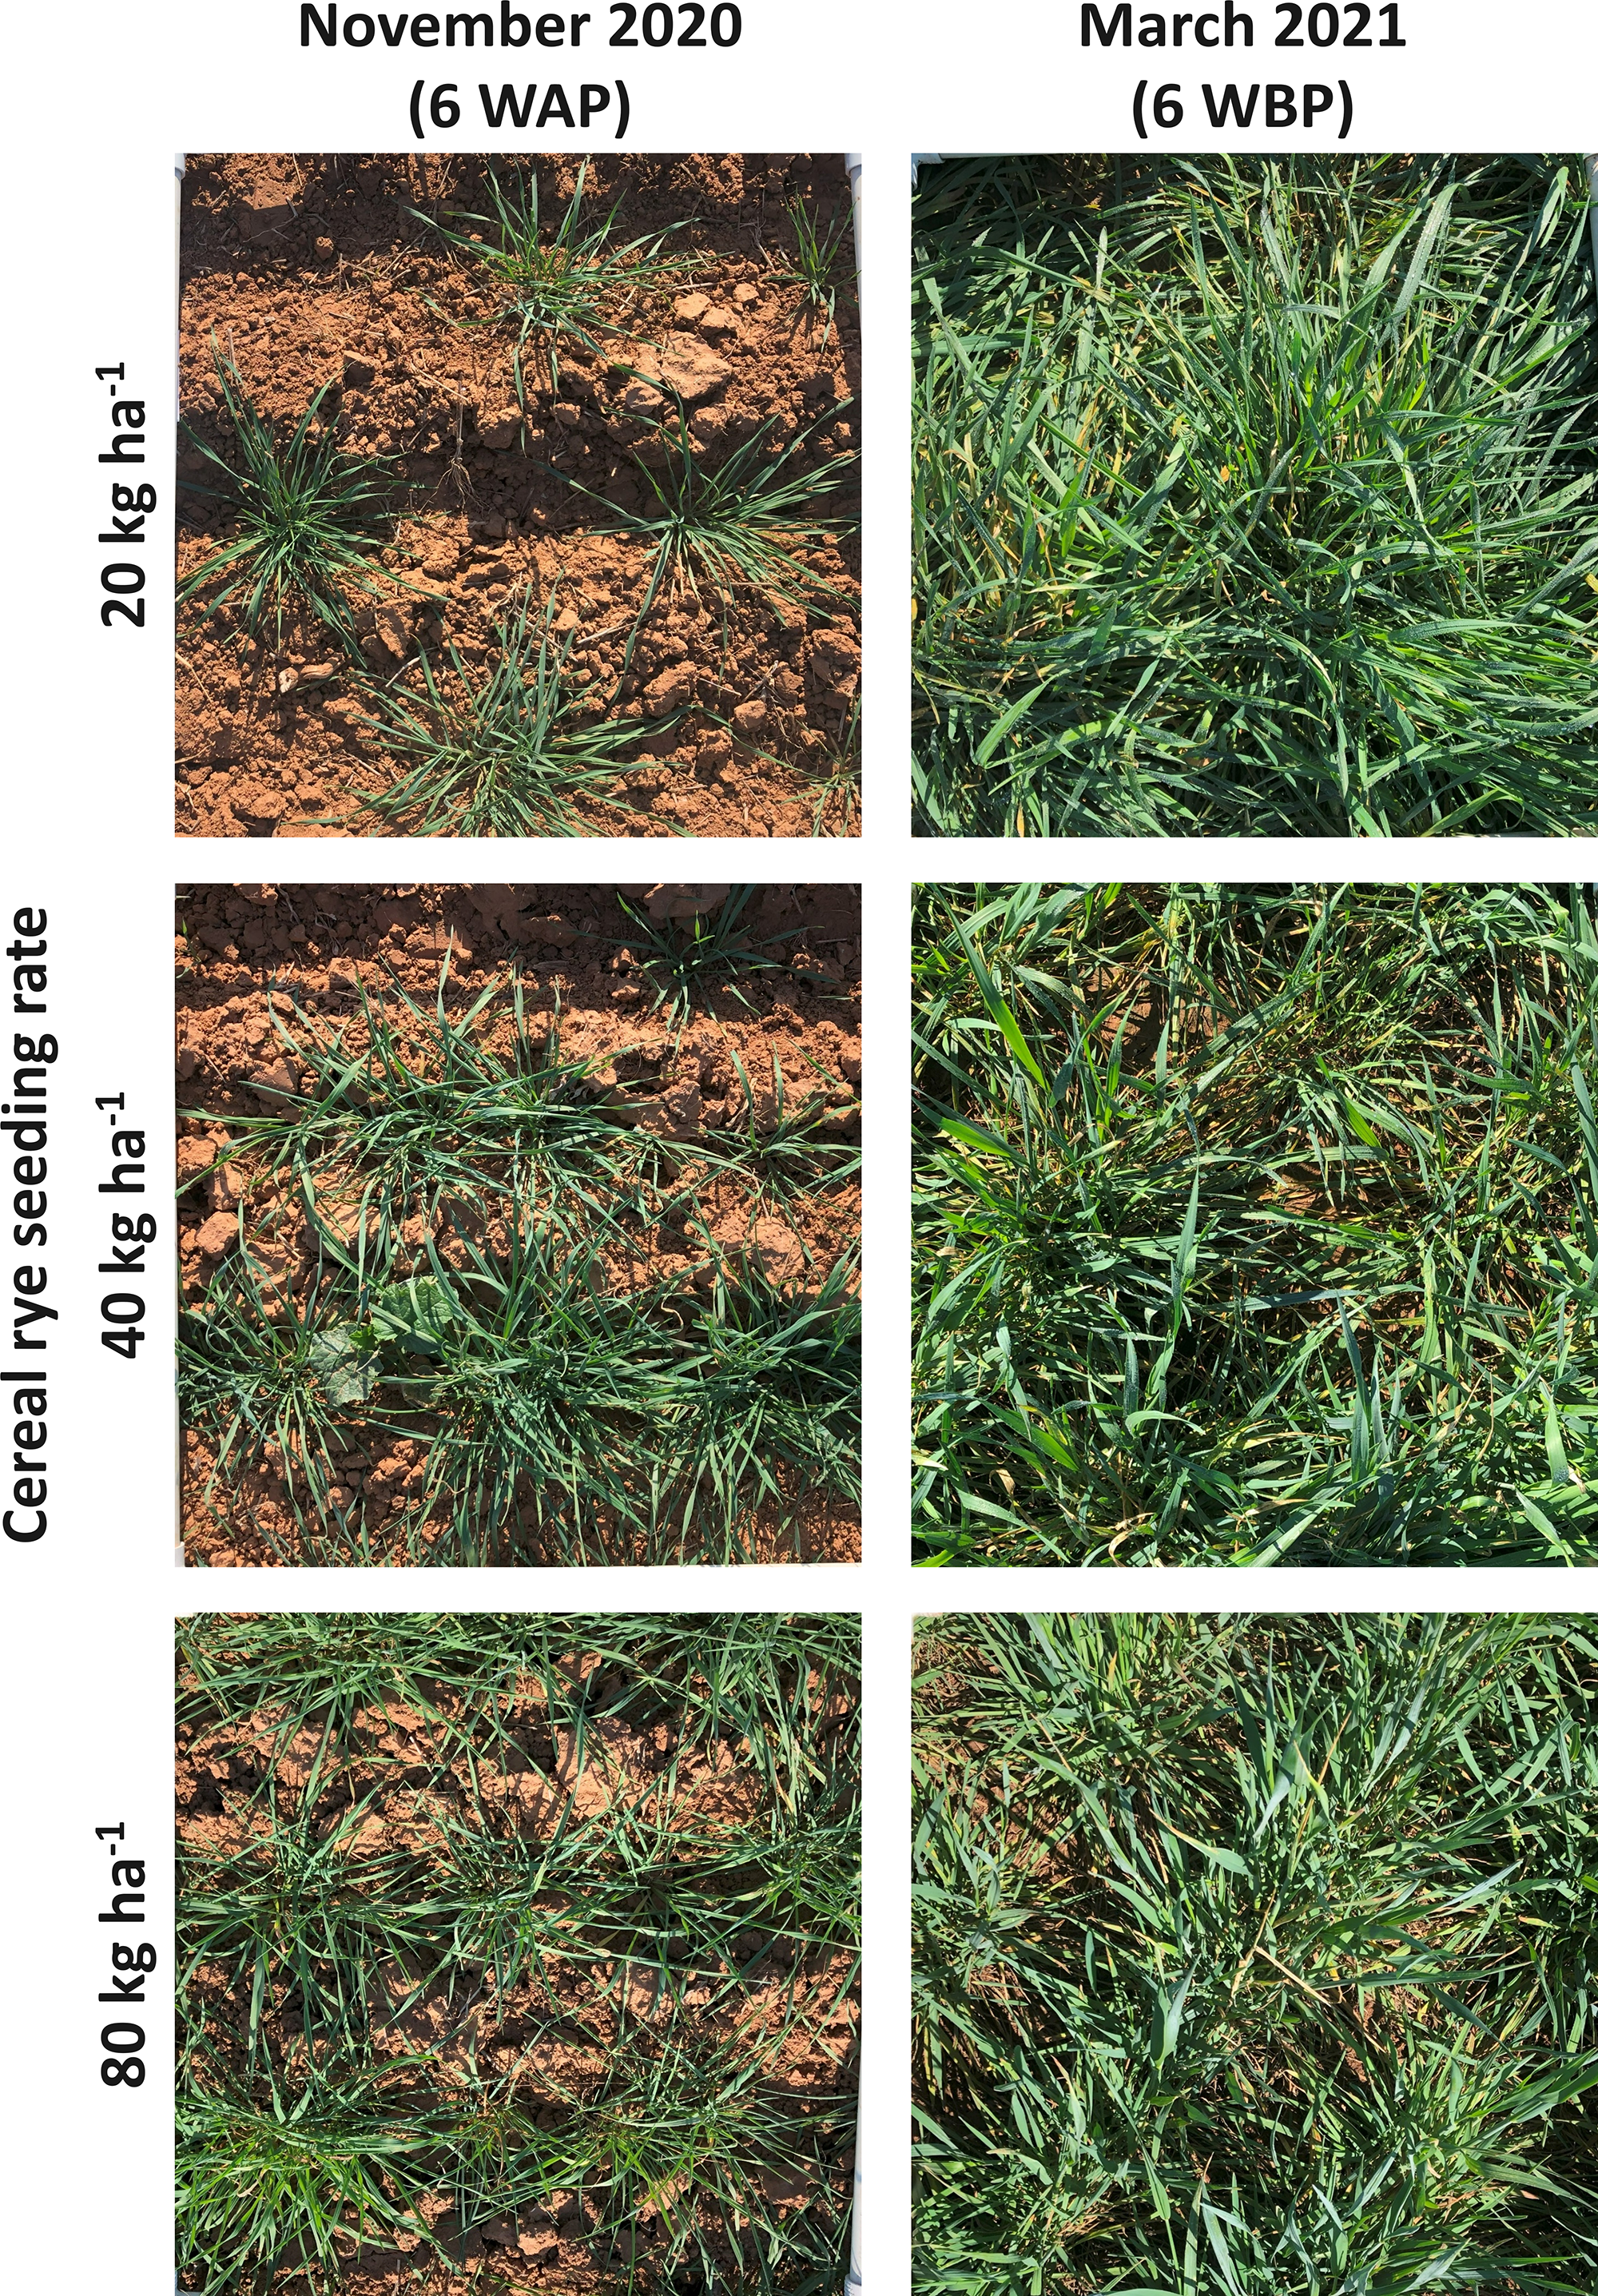
Cereal rye has prolific tillering ability, which compensates for low seeding rates and allows the cover crop to produce biomass levels comparable to those of high seeding rates (Ryan et al. Reference Ryan, Curran, Grantham, Hunsberger, Mirsky, Mortensen, Nord and Wilson2011a). Boyd et al. (Reference Boyd, Brennan, Smith and Yokota2009) demonstrated that cereal rye biomass production in the early growth stages is positively correlated with seeding rate, but not at termination in the spring. Haramoto (Reference Haramoto2019) recorded similar biomass production between high and low cereal rye seeding rates (34 and 112 kg ha−1, respectively), which was attributed to tillering. Our results confirm that increasing the cover crop seeding rate does not always increase biomass production at termination in the spring, including under the relatively marginal production environments of our study. However, higher seeding rates may improve ground coverage in the fall and winter (Figure 2), which may be important in environments prone to high rates of soil erosion. Delaying termination leads to higher biomass production (Mirsky et al. Reference Mirsky, Curran, Mortensen, Ryan and Shumway2011), especially after cereal rye switches to reproductive growth, which typically occurs in late spring and early summer (Mirsky et al. Reference Mirsky, Curran, Mortensen, Ryan and Shumway2009). Studies have reported that cereal rye biomass can increase from 2,000 kg ha−1 to 4,000 kg ha−1 in just 2 wk and to 8,000 kg ha−1 in 1 mo once reproductive growth starts (Nord et al. Reference Nord, Curran, Mortensen, Mirsky and Jones2011). Therefore, when feasible, delaying termination can increase cover crop biomass, and tillering can compensate for poor stand establishment.
Comparison of cereal rye ground coverage 6 wk after planting (WAP) in fall 2020 and at termination, 6 wk before cotton planting (WBP), in spring 2021, under different seeding rates (20, 40, and 80 kg ha−1). The photos represent an area of 0.25 m2. This figure illustrates the compensatory potential of cereal rye due to profuse tillering.

Soil Water and Temperature
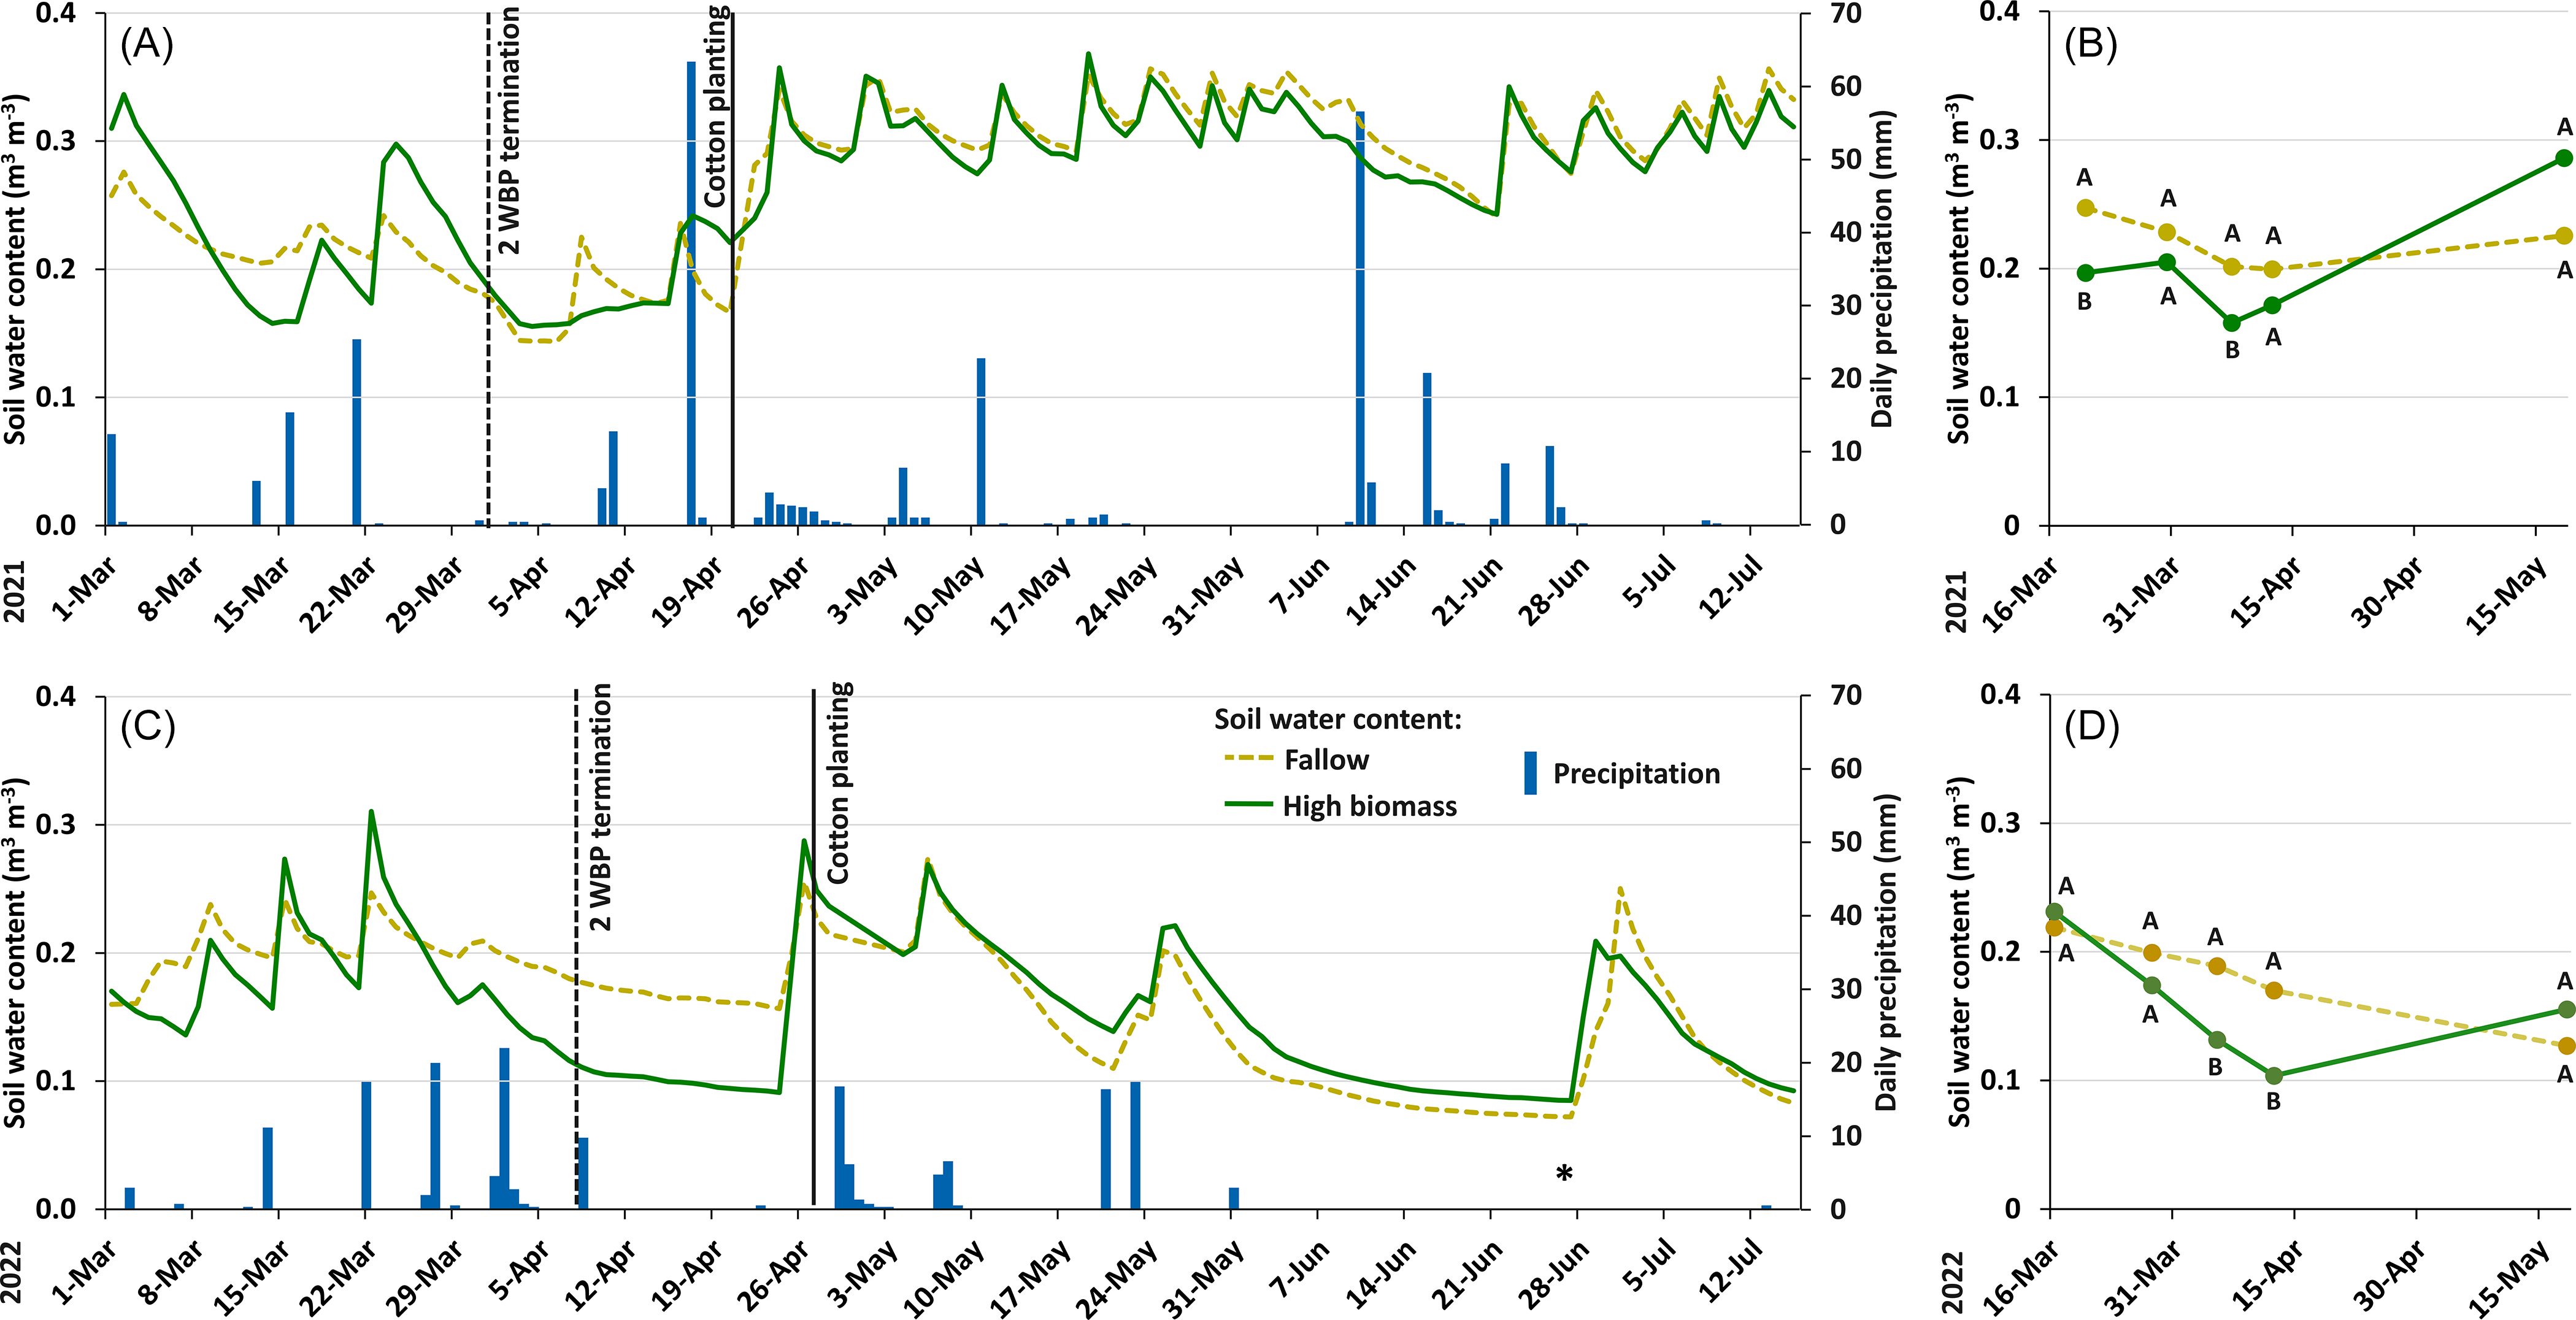
In a high biomass–yielding treatment (i.e., 80 kg ha−1 seeding rate, 2 WBP termination), soil water content was lower before cover crop termination (2021: March 20 [P = 0.011] and April 7 [P = 0.04]; 2022: April 5 [P = 0.0283] and April 12 [P = 0.008]) compared with the fallow control (i.e., 0 kg ha−1 seeding rate, 2 WBP termination of the fallow weeds), but differences were negligible after termination (Figure 3). There was a significant effect of year on the data (P < 0.05); thus, data are presented separately by year. In 2021, the fallow treatment had a significantly higher soil water content compared with the high biomass treatment on March 20 (0.247 vs. 0.197 m3 m−3, respectively), before termination, and on April 7 (0.202 vs. 0.158 m3 m−3, respectively), immediately after termination (Figure 3B). In 2022, fallow plots had a higher water content than the high biomass treatment on April 5 (0.189 vs. 0.132 m3 m−3, respectively) and April 12 (0.170 vs. 0.104 m3 m−3, respectively) (Figure 3D). The cereal rye cover crop began reproductive development during this period, and the growth rate increased; thus, soil water was depleted at a faster rate, which corroborates the findings of Reicks et al. (Reference Reicks, Clay, Clay, Joshi, Moriles-Miller, Westhoff, Daigh and Bruggeman2021). After termination, the soil water recharged under high cereal rye biomass following rains, which can be attributed to reduced runoff and increased rainwater infiltration (Haruna et al. Reference Haruna, Nkongolo, Anderson, Eivazi and Zaibon2018). After cotton planting, there were no significant differences in soil water content between the fallow treatment and the high biomass plots (Figure 3C and 3D). Vann et al. (Reference Vann, Reberg-Horton, Edmisten and York2018) reported that cereal rye residue consistently increased soil water in the early summer season when weather conditions were similar to those of the 2022 season in the current study. Because the soil water sensors were placed close to the soil surface (5 to 10 cm), as opposed to at the 12-cm depth in Vann et al.’s (Reference Vann, Reberg-Horton, Edmisten and York2018) study, these differences may not have been as evident in our study.
Comparison of the mean daily volumetric soil water content (m3 m−3) between a high cover crop biomass treatment (>4,000 kg ha−1, 2 wk before cotton planting [WBP] termination, green solid lines) and fallow (brown dashed lines) during March 1 to July 15 in 2021 (A) and 2022 (C). A detailed comparison of the two treatments for the window of cover crop termination to cotton establishment (March 16 to May 18) at biweekly intervals is shown for 2021 (B) and 2022 (D). The values represent an average of three soil water sensors in each treatment. Means followed by the same letter within a date are not different based on Student’s t-test (α = 0.05). The blue bars indicate total daily precipitation (mm). Dashed and solid vertical lines represent the cover crop termination dates (2 WBP) and cotton planting dates, respectively. The asterisk (*) denotes supplemental irrigation provided on June 28, 2022.

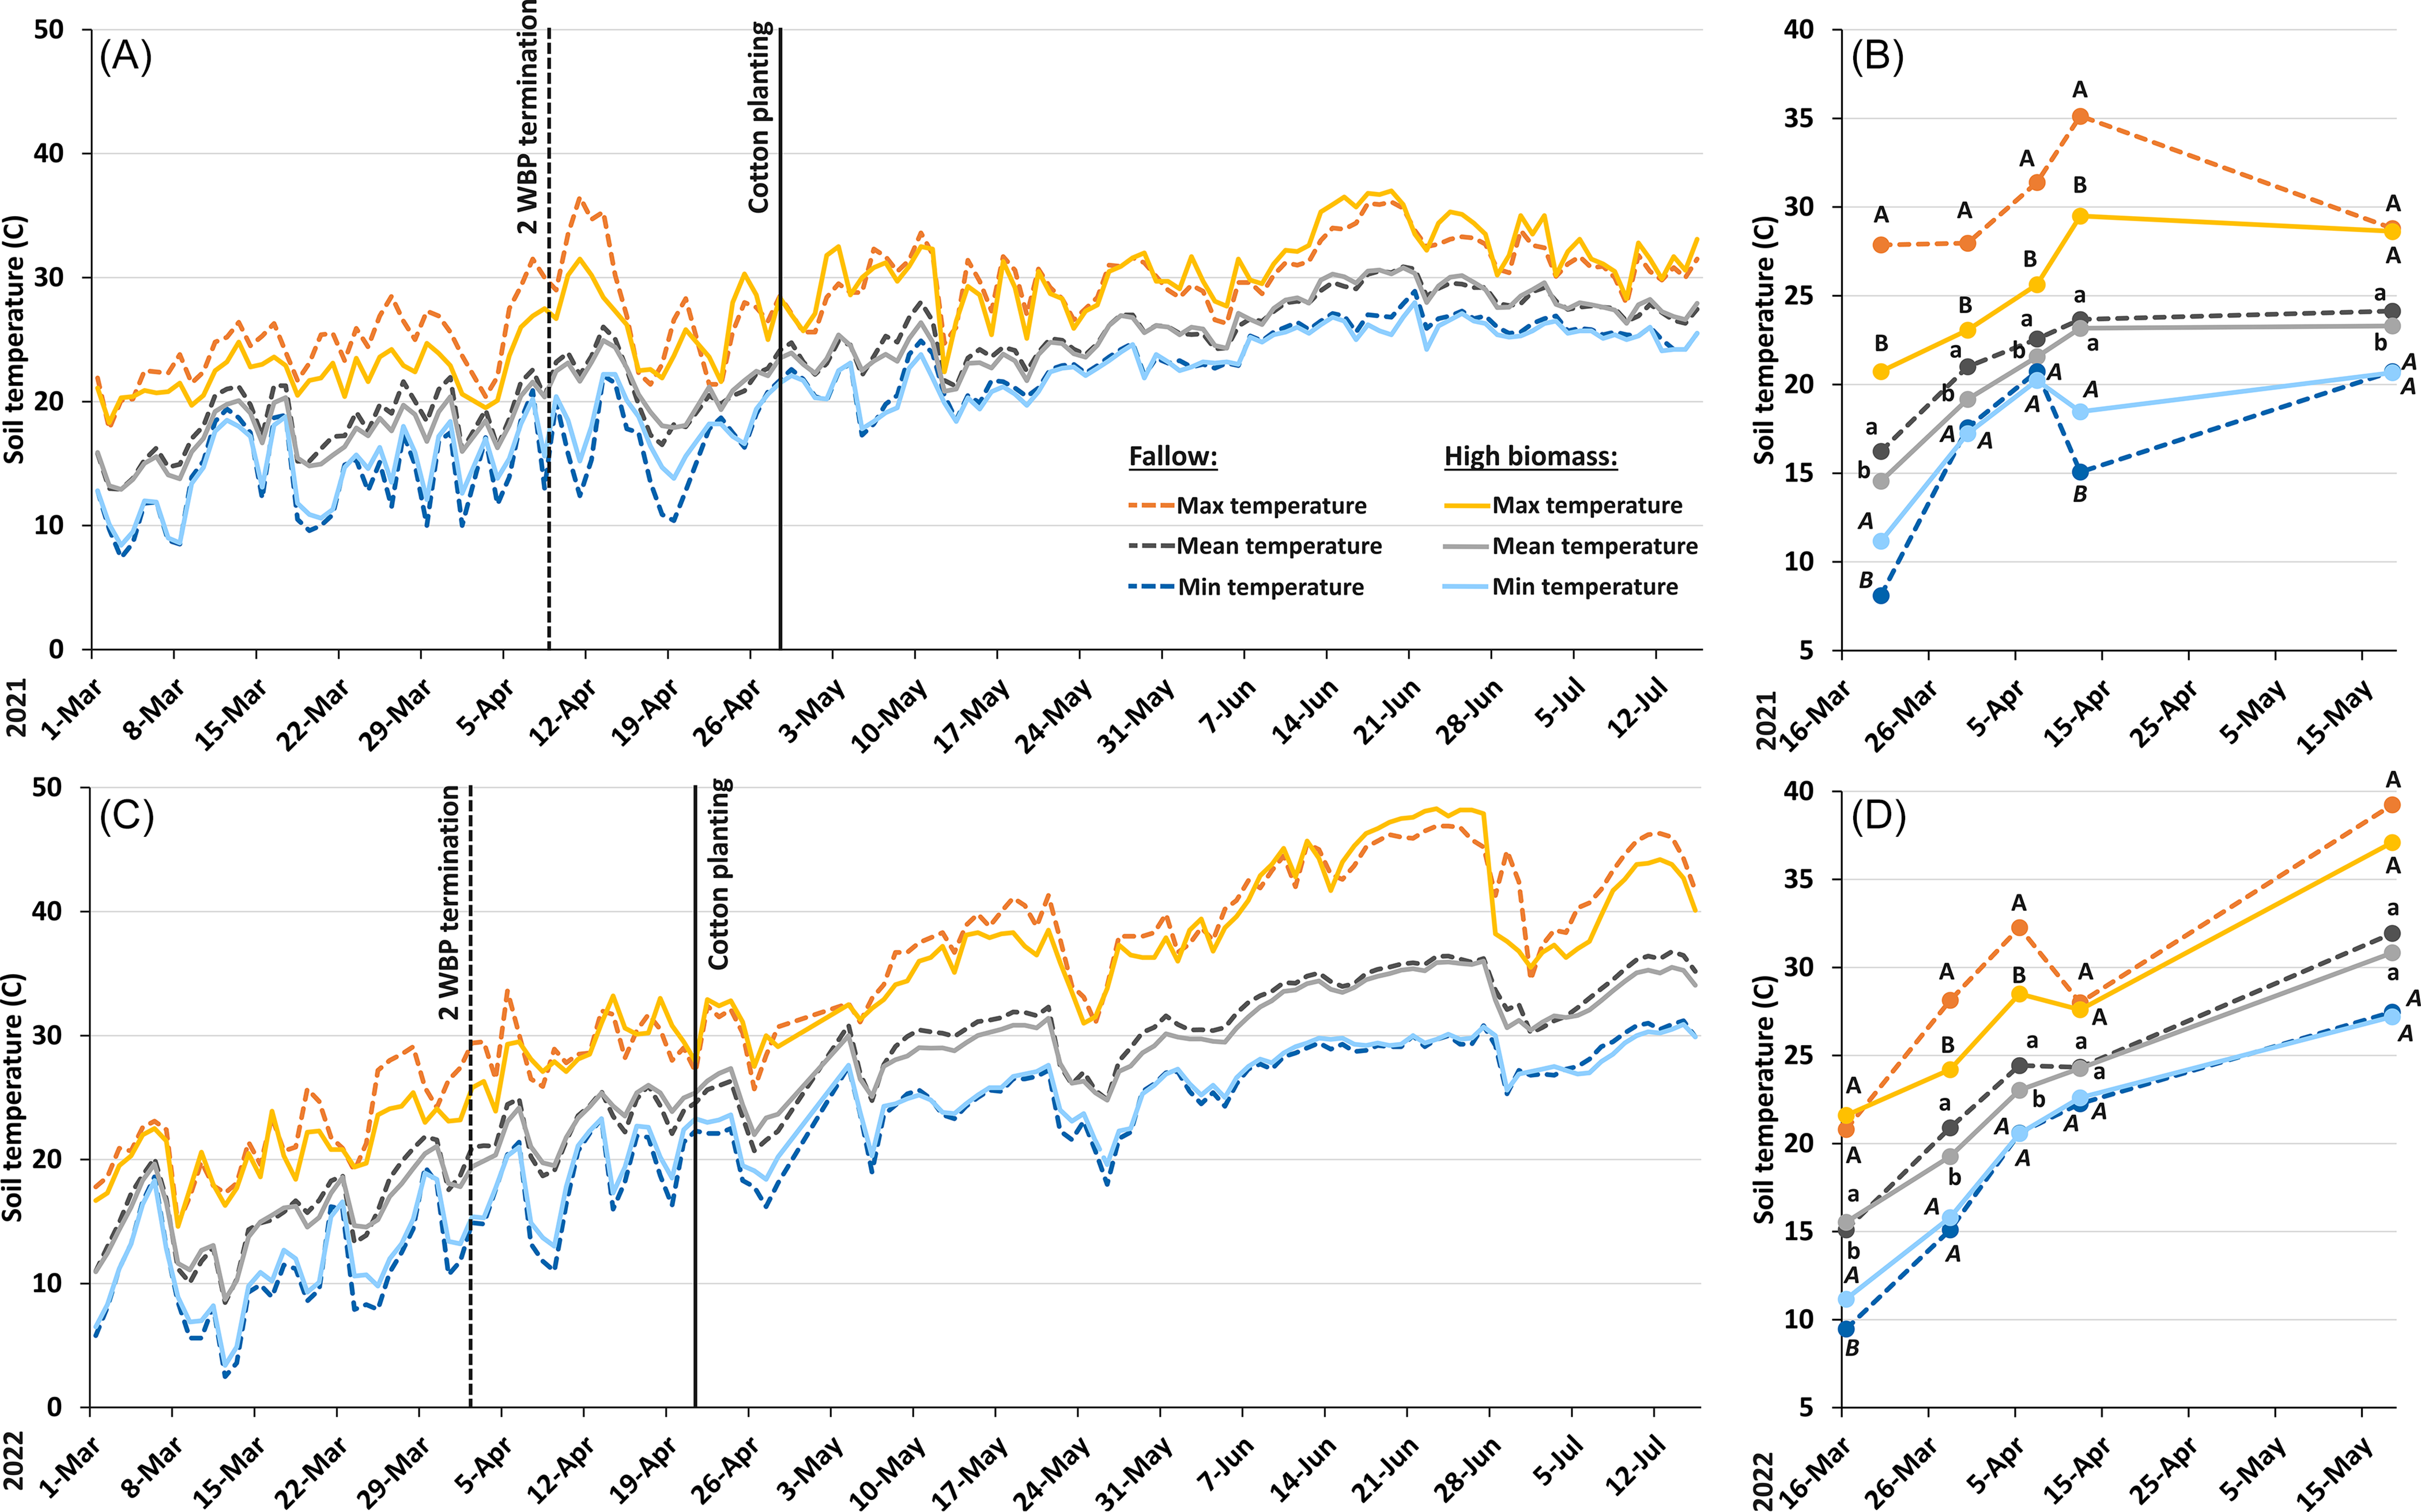
Soil temperature was reduced by cereal rye residue, especially before cotton planting (Figure 4). Plots with high cereal rye biomass had consistently lower maximum temperatures, higher minimum temperatures, and lower mean temperatures than fallow (P < 0.05). During the soil warming period (late March to early April), fallow had high peaks of warm temperatures (e.g., 27.9 C on March 20, 2021) and low peaks of cold temperatures (e.g., 8.1 C on March 20, 2021); however, these values were 20.7 C and 11.2 C, respectively, for the high biomass treatment on the same day of observation. Thus, the cereal rye canopy (before termination) and residue (after termination) reduced the thermal amplitude at the soil surface. Cover crop residues can intercept or reflect most of the solar radiation, thus preventing it from reaching the soil surface (Teasdale and Mohler Reference Teasdale and Mohler1993). Previous research has shown that cover crop residue can be up to 10 C warmer than the soil during peak solar radiation times (Thapa et al. Reference Thapa, Tully, Cabrera, Dann, Schomberg, Timlin, Gaskin, Reberg-Horton and Mirsky2021), highlighting its potential to insulate the soil surface, thereby reducing the soil thermal amplitude, as observed in our experiment. After cotton planting, soil temperature parameters were generally not significantly different between the two treatments, except for a small, significant difference of 1 C in mean soil temperature on May 18, 2021 (Figure 4B). Our results indicate that cereal rye residue can narrow the gap between daily maximum and minimum soil temperatures and lower mean soil temperatures in early summer.
Comparison of the daily maximum (Max temperature), minimum (Min temperature), and mean (Mean temperature) soil temperatures (C) between a high cover crop biomass treatment (>4,000 kg ha−1, 2 wk before cotton planting [WBP] termination treatment, solid lines) and fallow (dashed lines) during March 1 to July 15 in 2021 (A) and 2022 (C). A detailed comparison of the two treatments for the window of cover crop termination to cotton establishment (March 16 to May 18) is shown for 2021 (B) and 2022 (D). The values represent an average of three sensors in each treatment. Within each temperature category (Max, Min, or Mean), and for each date of observation, means followed by the same letter (uppercase letters = Max; uppercase italicized letters = Min; lowercase letters = Mean) are not different based on Student’s t-test (α = 0.05). Dashed and solid vertical lines represent the cover crop termination dates (2 WBP) and cotton planting dates, respectively.

Figure 4. Long description
The image contains four line graphs comparing soil temperatures under different treatments over time. Panel A shows daily maximum, minimum, and mean soil temperatures from March 1 to July 15, 2021, for high cover crop biomass and fallow treatments. The x-axis represents the date, and the y-axis represents soil temperature in degrees Celsius. The high biomass treatment is represented by solid lines, while the fallow treatment is represented by dashed lines. Panel B provides a detailed comparison of soil temperatures from March 16 to May 18, 2021, highlighting specific temperature categories with different letter annotations indicating statistical significance. Panel C shows similar data for the same period in 2022. Panel D offers a detailed comparison for the same window in 2022. Each graph includes annotations for cover crop termination and cotton planting dates. The graphs illustrate how soil temperatures vary between the two treatments over time, with notable differences in maximum, minimum, and mean temperatures.
Soil Nutrient Dynamics
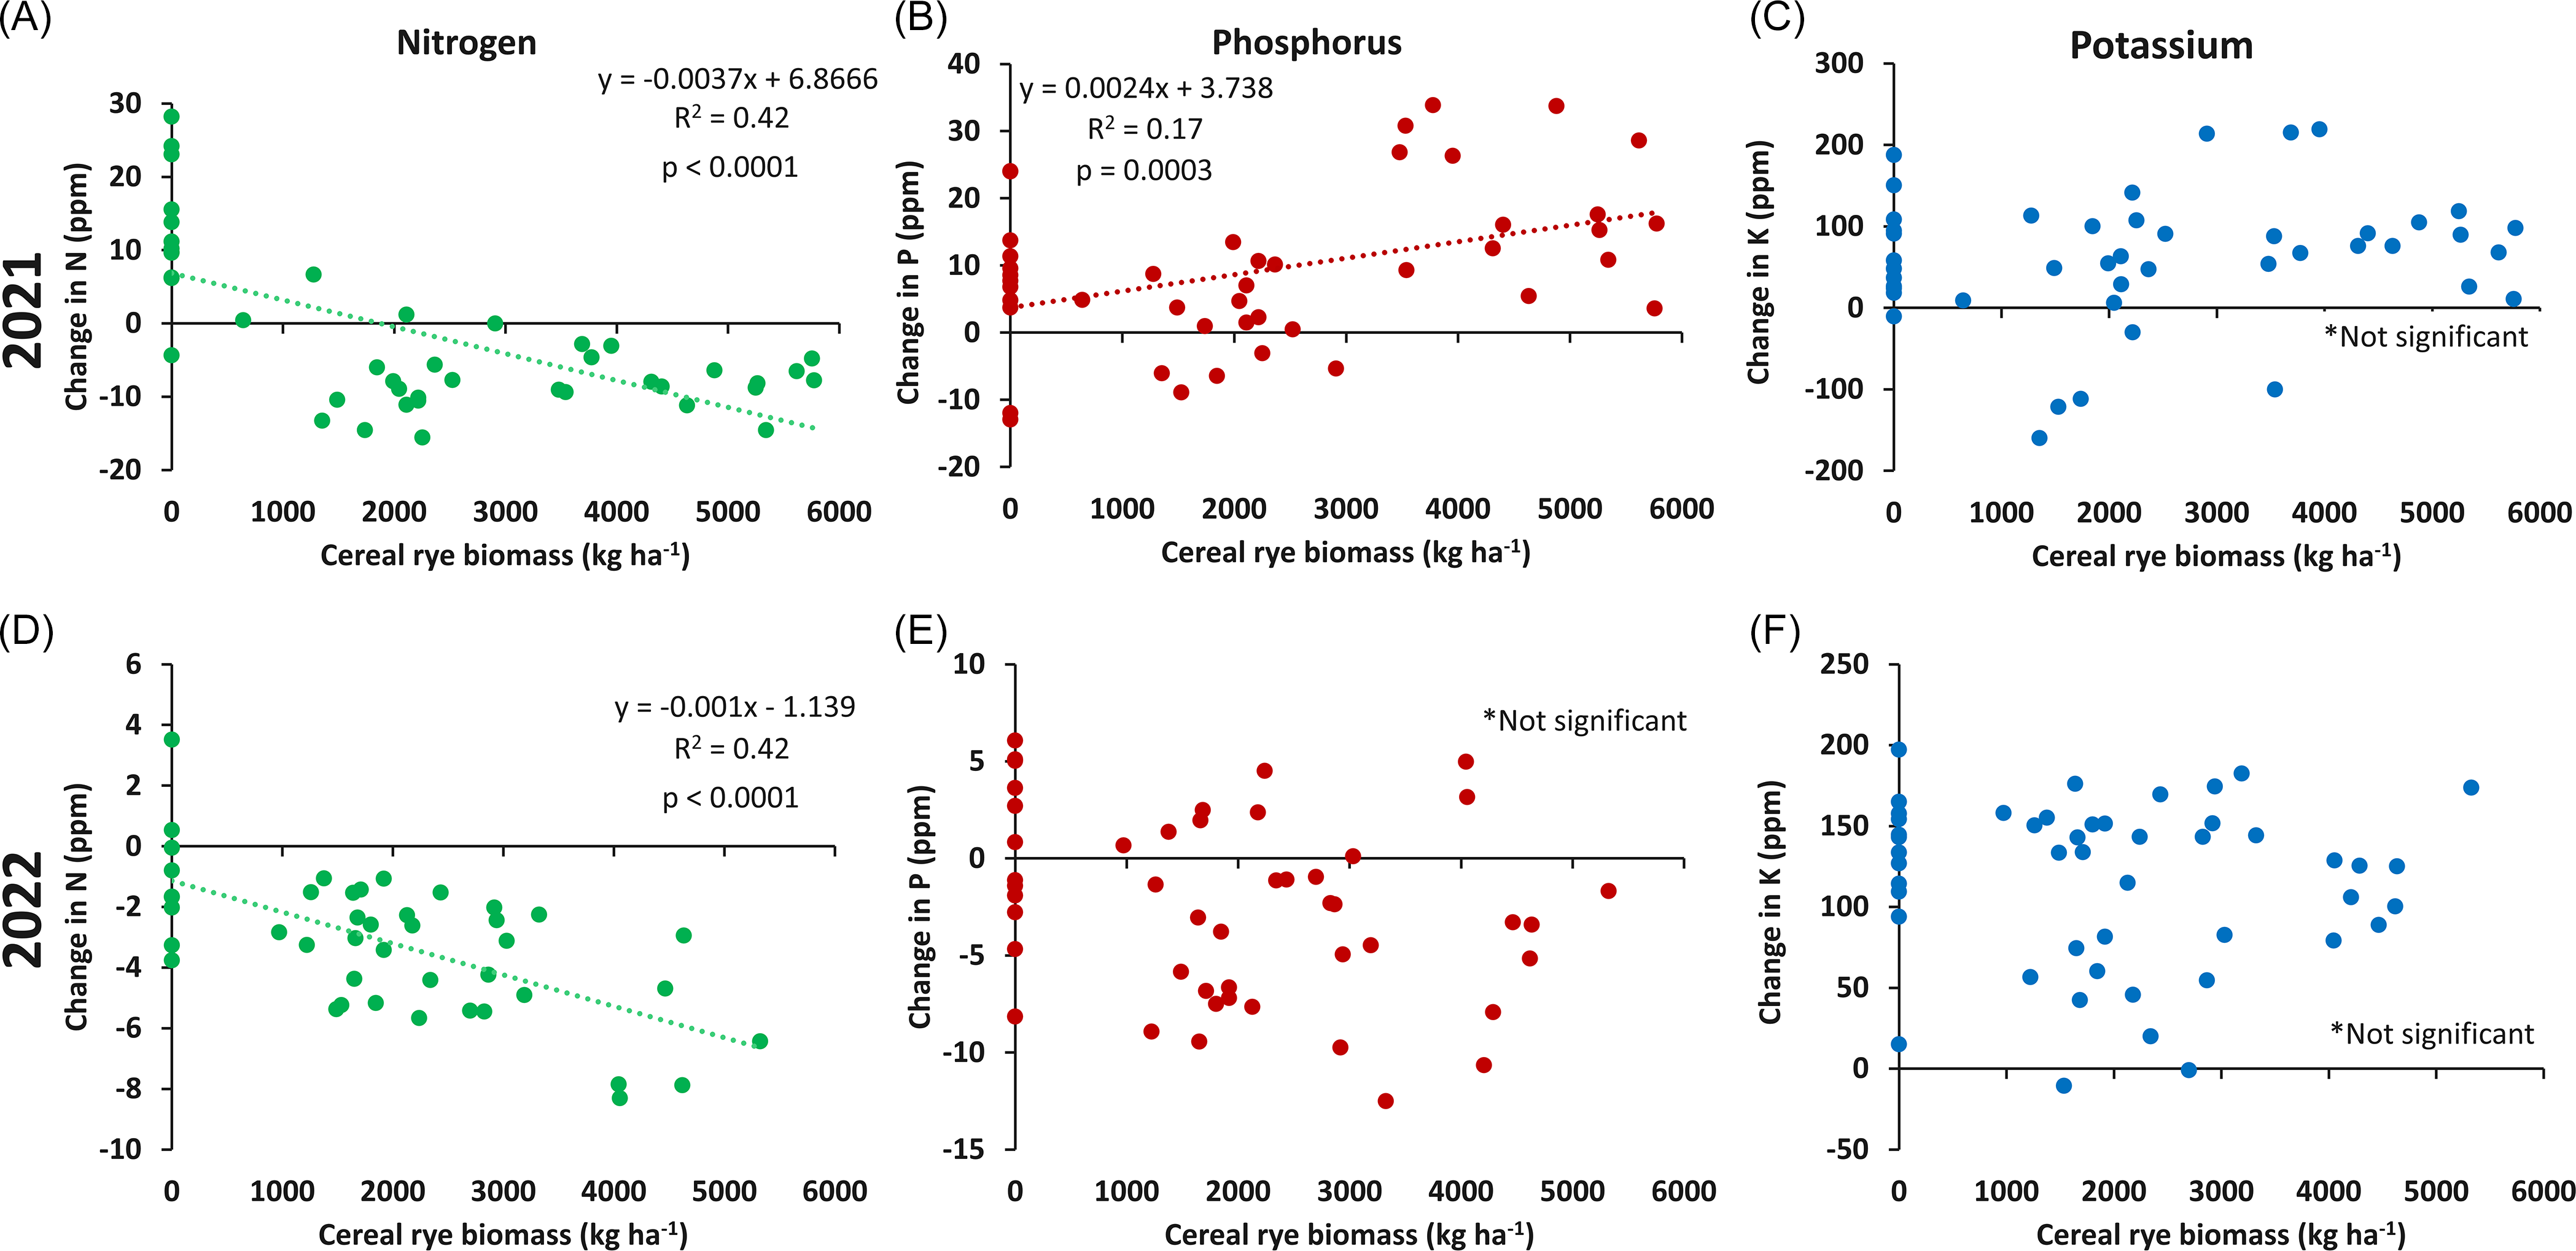
Soil N decreased as cereal rye biomass increased (Figure 5). Generally, cereal rye reduced nitrate levels, whereas fallow had higher soil N levels (Figure 5A and 5D). The regression model was significant (P < 0.0001) in both years. While the trend in soil N across both years was similar, the magnitudes differed. Fallow plots in 2021 had up to 25 ppm more N (Figure 5A), while plots with high cover crop biomass had 15 ppm less N. The effect was less evident in 2022; the fallow treatment maintained constant soil N levels, while plots with cereal rye had up to 8 ppm less N (Figure 5D). Cereal rye is known to be an efficient soil N scavenger and is commonly used to reduce nitrate leaching (Brandi-Dohrn et al. Reference Brandi-Dohrn, Hess, Selker, Dick, Kauffman and Hemphill1997). Studies have shown that cereal rye cover crops can reduce N leaching by as much as 75% (Heinrich et al. Reference Heinrich, Smith and Cahn2014; Malone et al. Reference Malone, Jaynes, Kaspar, Thorp, Kladivko, Ma, James, Singer, Morin and Searchinger2014). The higher N mineralization rate in the fallow plots in 2021 compared with 2022 could be due to differences in climatic conditions (Figure 5A and 5D). The wet, warm weather conditions in 2021 promoted greater vegetative growth in cotton, resulting in a smaller residual N pool for the 2022 crop than the amount remaining after the 2020 season. At the start of the experiment in 2021, soil N averaged 12 ppm, whereas at rye termination in 2022 it had declined to 4 ppm (data not shown). The lower soil N content appeared to be driven primarily by the presence of the cover crop, as cereal rye reduced soil N regardless of its biomass level.
Effect of cereal rye biomass levels at termination (kg ha−1) on soil nitrogen (A and D), phosphorus (B and E), and potassium (C and F) in 2021 (top) and 2022 (bottom). The changes in the soil nutrient contents were calculated by subtracting the nutrient level in spring at cereal rye termination from the initial levels in the fall before cereal rye planting. Positive values indicate an increase in soil nutrient levels, whereas negative values show a reduction in available nutrient levels. The 0 kg ha−1 cereal rye biomass indicates the fallow treatment.

Soil phosphorus levels increased with cereal rye in 2021, but not in 2022. The change in plant-available P was significant (P = 0.0003) in 2021, with cereal rye increasing available soil P by as much as 35 ppm compared with fallow (Figure 5B). There was no significant (P > 0.05) relationship observed between cereal rye biomass and plant-available P in 2022 (Figure 5E). We expected to see a reduction in extractable soil P levels under the cereal rye treatments, as studies have shown that cereal rye readily scavenges soil P during its growth (Gonzalez et al. Reference Gonzalez, Dick, Islam, Watts, Fausey, Flanagan, VanToai, Batte, Reeder, Kost and Shedekar2022). However, cereal rye root activity may also solubilize and mobilize bound soil P (Cole et al. Reference Cole, Innis, Stewart and Innis1978), resulting in either increased soil P (as in 2021) or no difference (as in 2022) compared with levels present before rye planting. In a 9-yr study, Kuo et al. (Reference Kuo, Huang and Bembenek2005) reported that cereal rye increased the inorganic and labile P pool at the topsoil (0 to 15 cm, the same depth observed in this study), although not deeper in the soil profile (15 to 30 cm). Using a cereal rye cover crop for several years may be necessary to achieve significant P movement from inaccessible to labile pools in soils with a high clay content like the soil in our study (Dada et al. Reference Dada, Armstrong and Smith2023).
Cereal rye had no effect on potassium levels in the soil (Figure 5C and 5F). Soil K concentrations at our site were naturally very high (averaging 350 ppm in 2021 and 190 ppm in 2022), which likely masked any measurable effects of the cereal rye cover crop on soil K availability. Some research has shown that cereal rye cover crop can even increase exchangeable K concentrations at the soil surface by transporting it upward from deeper soil layers (DeLaune et al. Reference DeLaune, Mubvumba, Lewis and Keeling2019; Eckert Reference Eckert1991; Gonzalez et al. Reference Gonzalez, Dick, Islam, Watts, Fausey, Flanagan, VanToai, Batte, Reeder, Kost and Shedekar2022), but such an effect was not observed in this study. Furthermore, cereal rye can also prevent substantial soil K losses by reducing soil erosion and runoff (Korucu et al. Reference Korucu, Shipitalo and Kaspar2018), thereby preventing a reduction in soil K levels.
Winter Weed Suppression
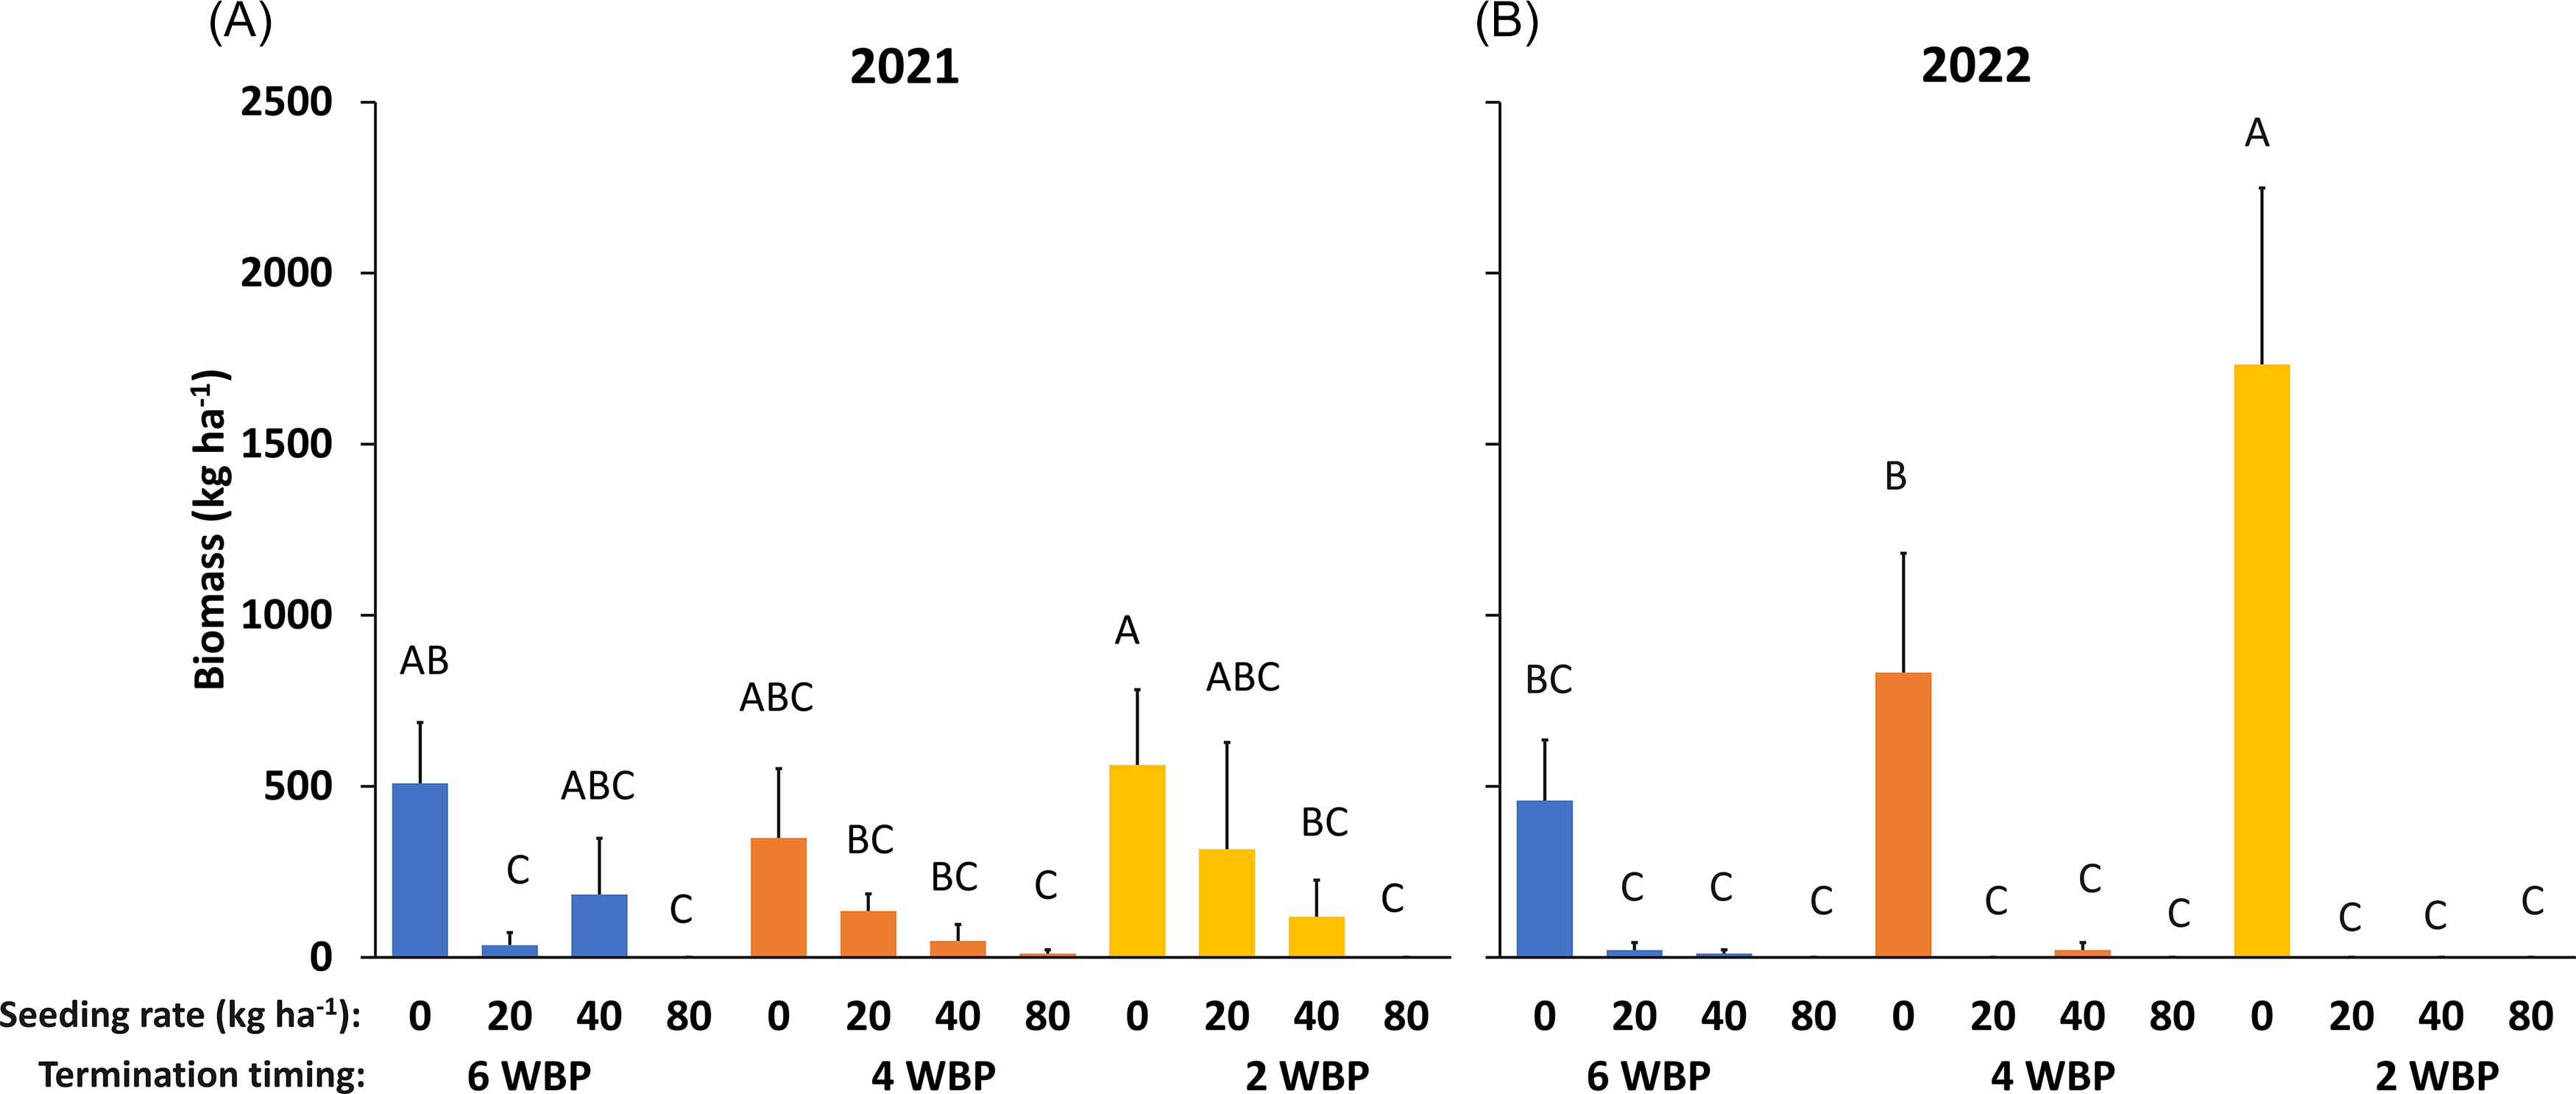
Winter annual weed biomass was reduced by the cereal rye cover crop (Figure 6). Winter weed biomass was similar (P > 0.05) in all cover crop treatments but was higher (P < 0.05) in the fallow plots (Figure 6). A similar trend was observed for winter weed densities across treatments (Supplementary Figure 1). There were no significant interactions between seeding rate and termination timing in 2021 (P > 0.05), whereas a significant interaction was detected in 2022 (P = 0.0076). It is well documented that cereal rye cover crops consistently reduce winter weed growth, especially under high biomass conditions (Hayden et al. Reference Hayden, Brainard, Henshaw and Ngouajio2012; Sherman et al. Reference Sherman, Haramoto and Green2020; Werle et al. Reference Werle, Burr and Blanco-Canqui2017). Strong competition from cereal rye severely suppressed winter weed growth, as reflected by low winter weed biomass in the rye treatments (Figure 6). Additional mechanisms, such as allelopathy (Schulz et al. Reference Schulz, Marocco, Tabaglio, Macias and Molinillo2013), shading (Wayman et al. Reference Wayman, Cogger, Benedict, Collins, Burke and Bary2015), and reduced light quantity under the rye canopy (Ballaré et al. Reference Ballaré, Sánchez, Scopel, Casal and Ghersa1987), may also have contributed to limiting winter weed growth. Reducing winter weed pressure with a cover crop may not have a significant direct impact on a summer crop like cotton, but it could benefit future winter crops by reducing inputs to the winter weed seedbank.
Winter weed biomass total (kg ha−1) in 2021 (A) and 2022 (B) at cereal rye cover crop termination. Termination timings are presented as weeks before planting cotton (WBP) (6 WBP = blue bars; 4 WBP = orange; 2 WBP = yellow). The dominant winter weeds in the study site were wild radish (Raphanus raphanistrum L.), cutleaf evening primrose (Oenothera laciniata Hill), and henbit (Lamium amplexicaule L.). Cereal rye cover crop seeding rates (kg ha−1) are labeled under each bar. Bars topped with different letters denote significant differences (P < 0.05) based on Fisher’s protected LSD test. Years were considered a fixed effect and analyzed separately.

Figure 6. Long description
Panel A: A bar graph showing winter weed biomass totals in 2021. The horizontal axis represents different seeding rates in kg per hectare (0, 20, 40, 80) and termination timings in weeks before planting cotton (6 WBP, 4 WBP, 2 WBP). The vertical axis represents biomass in kg per hectare, ranging from 0 to 2500. The bars are color-coded: blue for 6 WBP, orange for 4 WBP, and yellow for 2 WBP. Each bar is labeled with letters indicating significant differences based on Fisher’s protected LSD test. Notable trends include higher biomass at lower seeding rates and earlier termination timings. Panel B: A bar graph showing winter weed biomass totals in 2022. The horizontal axis represents the same seeding rates and termination timings as in Panel A. The vertical axis represents biomass in kg per hectare, ranging from 0 to 2500. The bars are color-coded similarly to Panel A. Each bar is labeled with letters indicating significant differences based on Fisher’s protected LSD test. Notable trends include higher biomass at lower seeding rates and earlier termination timings, with the highest biomass observed at 0 kg per hectare and 2 WBP.
Summer Weed Suppression
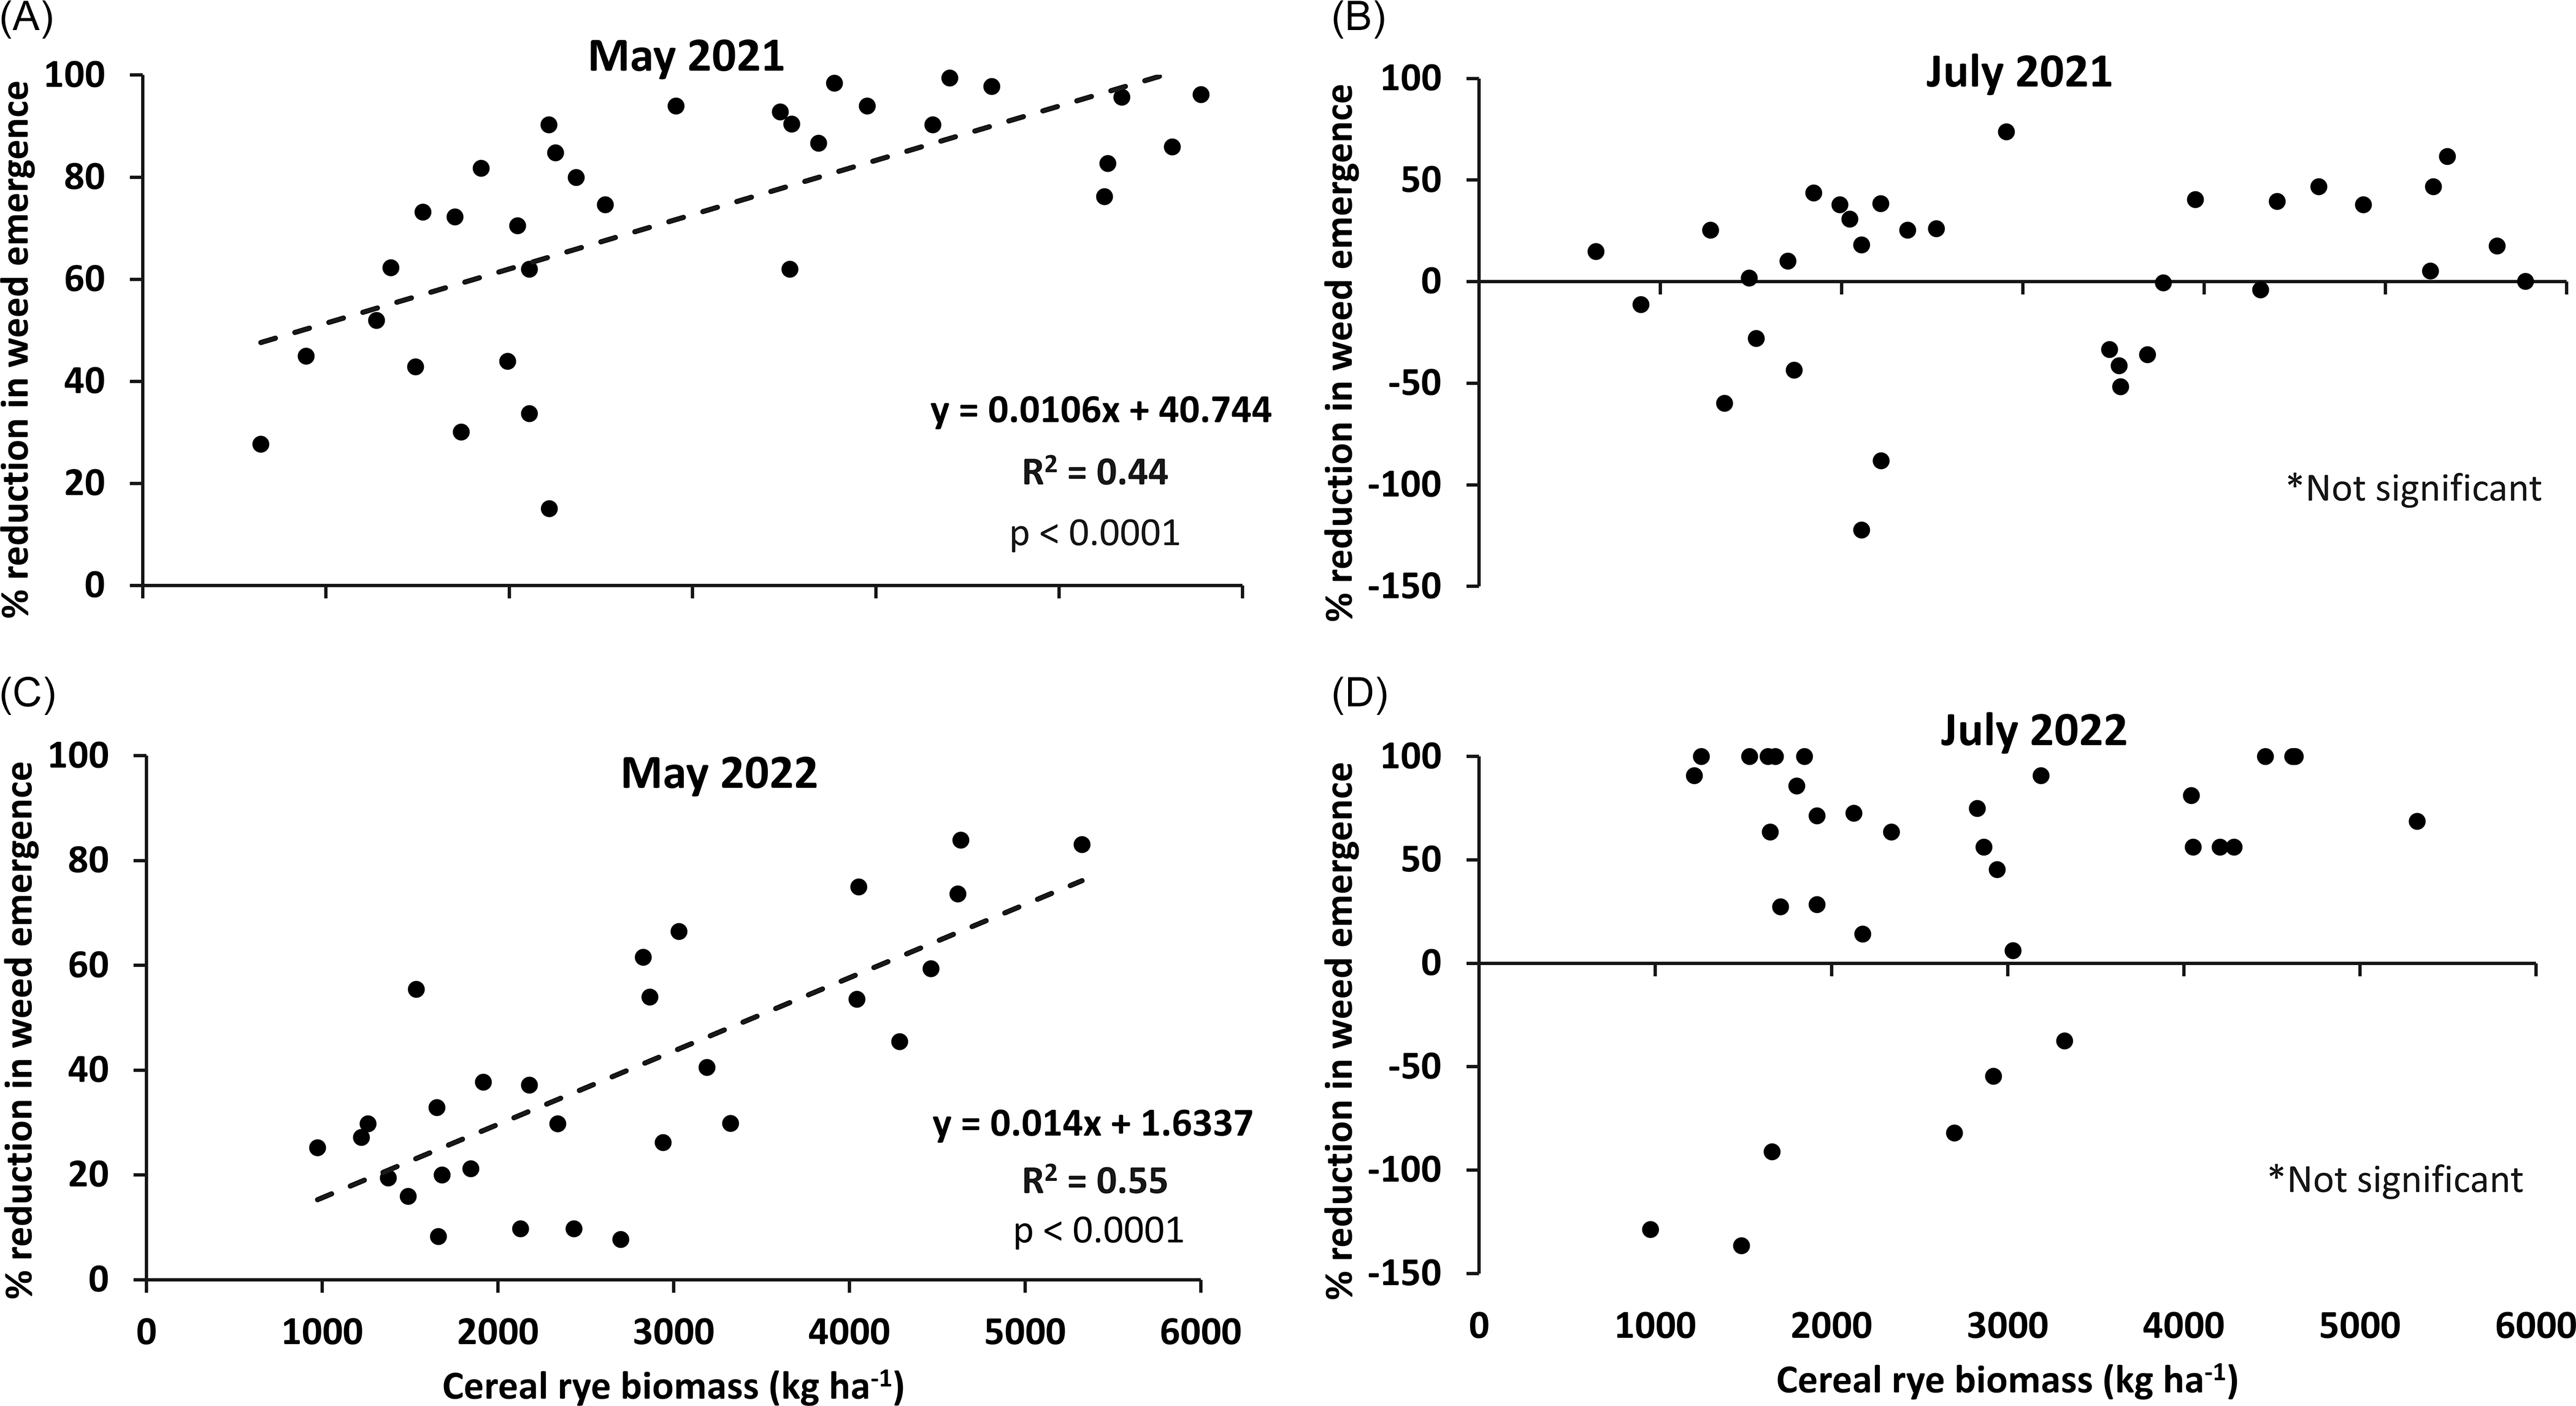
Cereal rye biomass was negatively correlated with summer weed emergence (P < 0.0001) in May (i.e., first weed emergence event after cotton planting) (Figure 7A and 7C), but no significant influence was observed in July (Figure 7B and 7D). Many published studies report a reduction in weed pressure with a cereal rye cover crop. However, biomass levels and weed suppression vary across studies (Camargo Silva and Bagavathiannan Reference Camargo Silva and Bagavathiannan2023). The general trend is similar: high biomass levels improve weed suppression (Mischler et al. Reference Mischler, Curran, Duiker and Hyde2010; Nord et al. Reference Nord, Curran, Mortensen, Mirsky and Jones2011; Nunes et al. Reference Nunes, Arneson, Smith, Ruark, Conley and Werle2024).
Percent reduction in summer weed emergence, compared with fallow (0 kg ha−1 cover crop seeding rate), as influenced by cereal rye biomass production at termination in May (A and C) and July (B and D) across the two study years (2021, 2022). Linear models provided the best fit for the May observations, whereas no significant relationships were detected for the July observations in either year. Negative values indicate an increase in weed emergence compared with fallow.

The influence of cereal rye biomass on summer annual weed emergence diminished as the season progressed. In general, weed-suppression benefits from a cover crop are known to be more effective early in the summer when the residue is still mostly intact, a pattern that was clear in this study. During this window, the mechanisms attributable to mulching (Teasdale and Mohler Reference Teasdale and Mohler2000), shading (Teasdale and Mohler Reference Teasdale and Mohler1993), and N immobilization (Williams et al. Reference Williams, Scott Wells, Dickey, Hu, Maul, Raskin, Reberg-Horton and Mirsky2018) are at their maximum potential. As the growing season progresses, cereal rye residue decomposes, and weed-suppression mechanisms become less effective. These findings suggest that cereal rye cover crops are most effective for early-season weed suppression and provide the cash crop with a competitive advantage until canopy closure. Later in the season, other methods of weed control are recommended to maintain a weed-free crop. It was also observed that some plots with low cereal rye biomass had higher weed emergence than the fallow plots around July in both years (Figure 7B and 7D). In these plots, there were high densities of annual grasses like U. texana and U. ramosa, indicating a delay in weed emergence timing, which will be discussed in the next section. Similarly, Nunes et al. (Reference Nunes, Arneson, Smith, Ruark, Conley and Werle2024) documented that low cereal rye biomass resulted in higher germination of waterhemp [Amaranthus tuberculatus (Moq.) Sauer] than fallow, which they attributed to improved soil moisture.
Weed Emergence Patterns
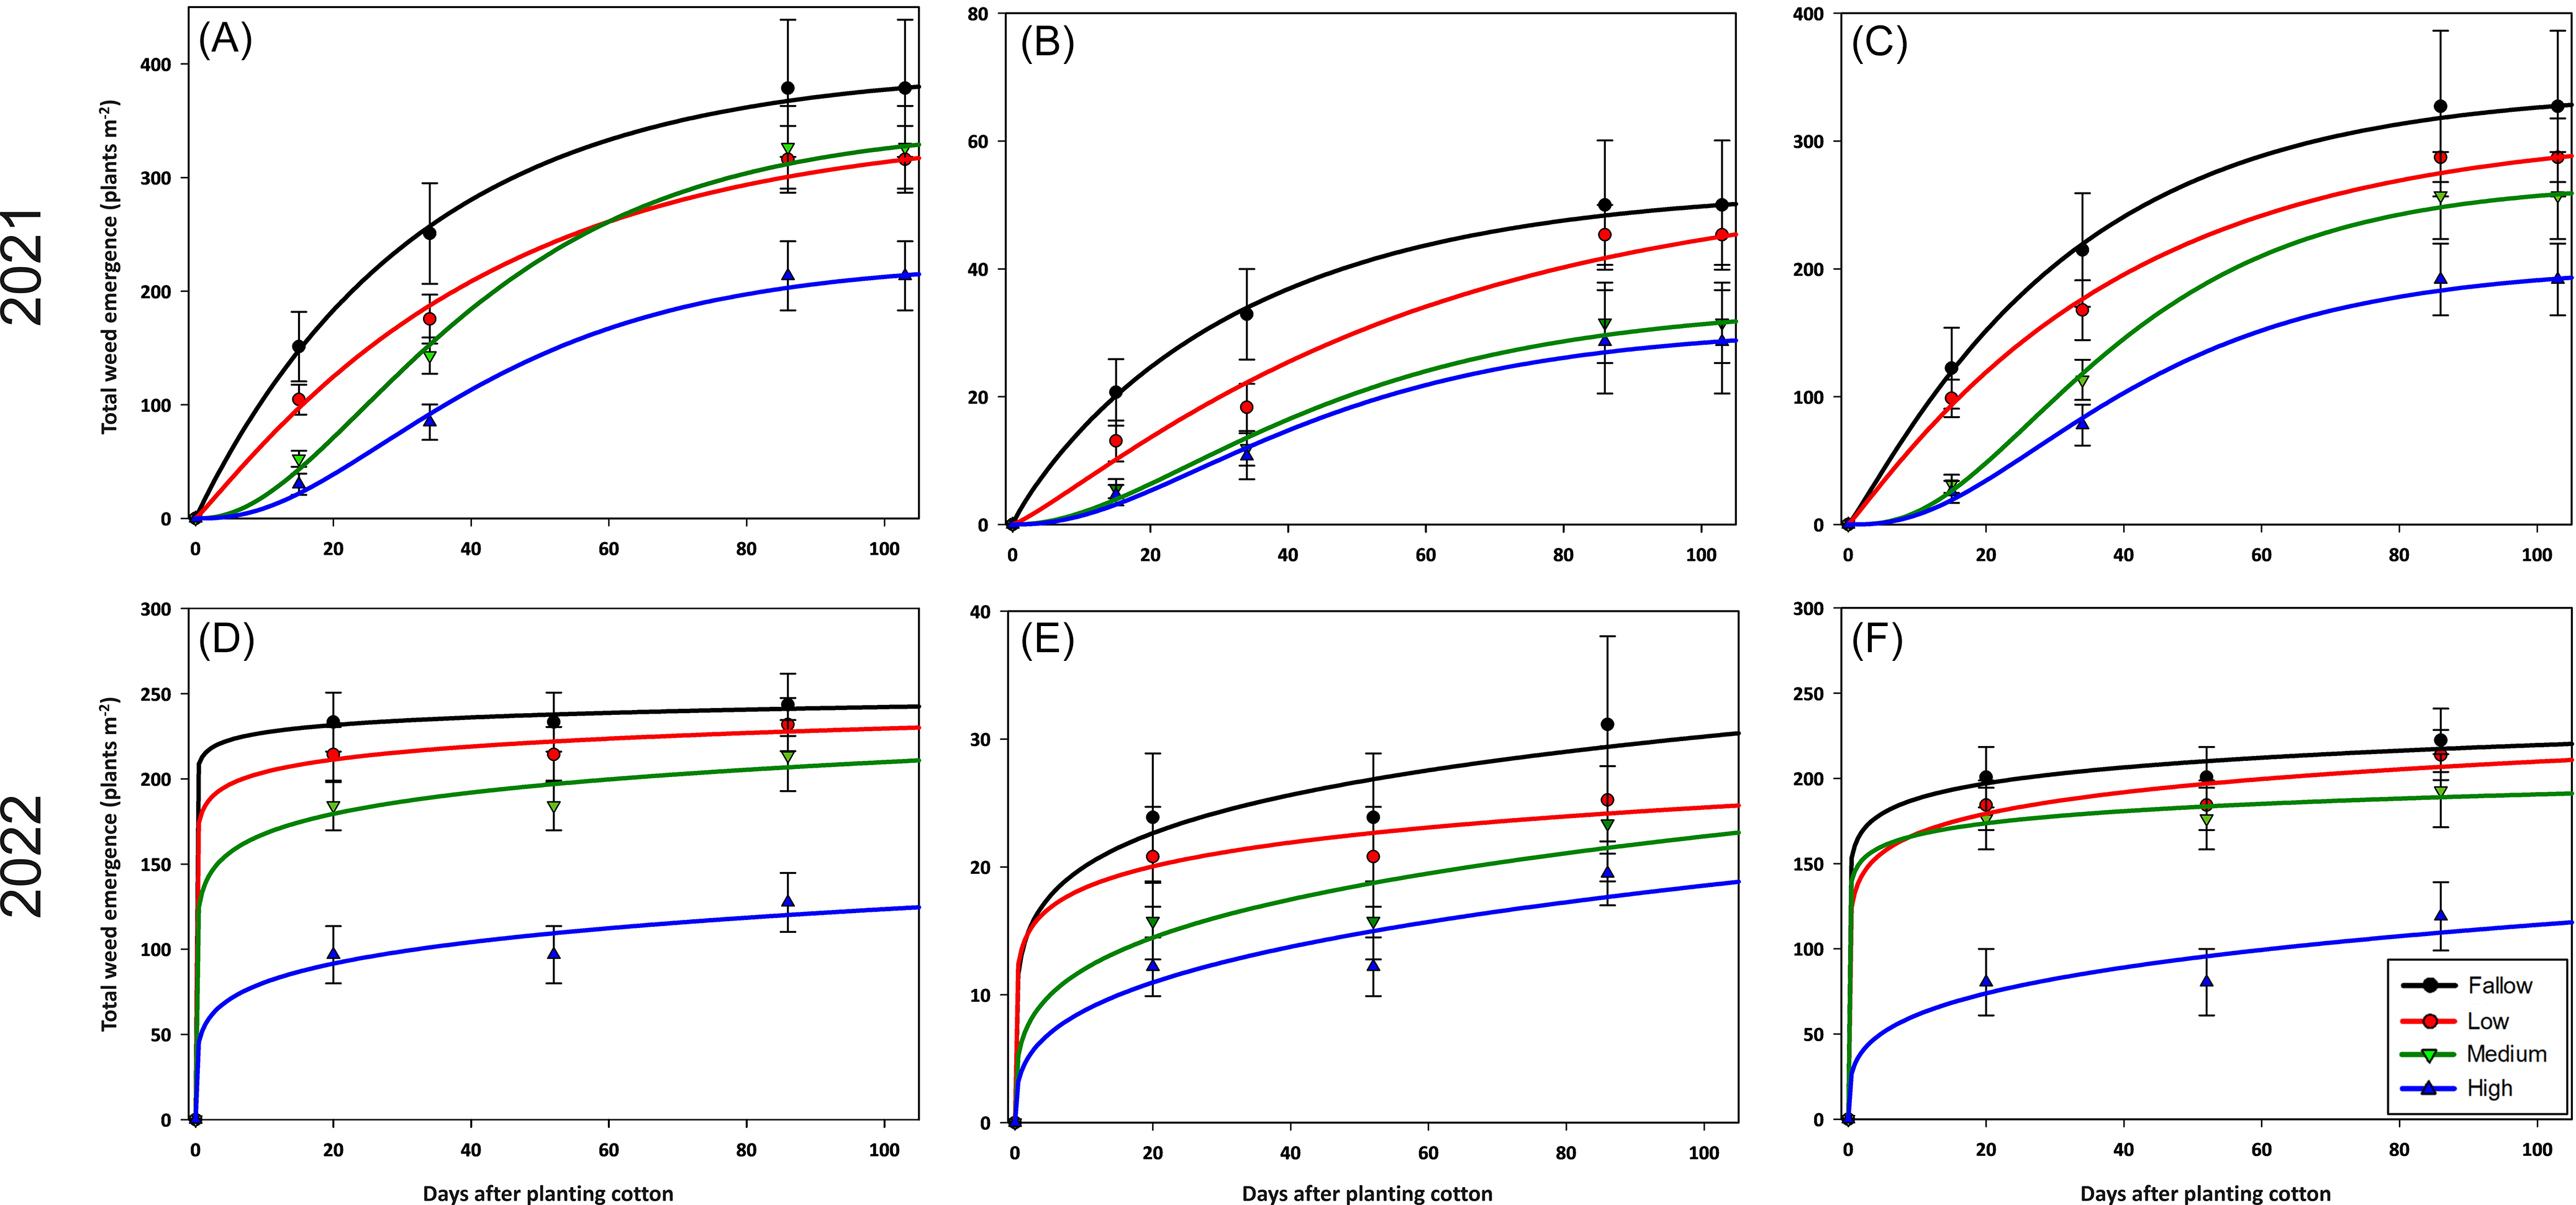
Weed emergence in 2021 was both reduced and delayed by cereal rye biomass (Figure 8). More weed seedlings emerged early (<20 d after planting cotton) in fallow than in cereal rye treatments. In plots with cereal rye, the higher the biomass, the greater the suppression and delay in weed emergence (Figure 8A–C). The emergence of broadleaf weeds was delayed by cereal rye biomass more than the emergence of grasses. The time difference to reach 5% emergence between fallow and high biomass plots was 15 and 11 d for broadleaves and grasses, respectively. The delay between fallow and high cereal rye biomass reaching 50% emergence was 23 and 15 d for broadleaves and grasses, respectively (Supplementary Table 1). Moore et al. (Reference Moore, Gillespie and Swanton1994) reported that a cereal rye cover crop reduced the emergence of redroot pigweed (Amaranthus retroflexus L.) early in the season and caused most seedlings to emerge later in the summer. Similar delays in A. palmeri emergence have also been reported with wheat (Triticum aestivum L.) and oat (Avena sativa L.) cover crops (McCall Reference McCall2018). Korres and Norsworthy (Reference Korres and Norsworthy2015) documented that a cereal rye cover crop delayed both weed emergence and weed biomass accumulation when compared with fallow treatments. Our study confirms that, in addition to suppressing weed germination (Figure 9), cereal rye also delays the emergence patterns of weeds.
Cumulative summer weed emergence (plants m−2) as influenced by cover crop biomass levels (black = fallow [0 kg ha−1], red = low biomass [<2,000 kg ha−1], green = medium biomass [2,000 to 4,000 kg ha−1], and blue = high biomass [>4,000 kg ha−1]) for all weed species (A and D), grasses (B and E), and broadleaves (C and F) across the two study years (2021, 2022). A sigmoidal model (Chapman four parameters: E(t) = y 0 + a[1 – exp(–bt)] c ) provided the best fit to the data.

Figure 8. Long description
The image contains six line graphs showing cumulative summer weed emergence influenced by cover crop biomass levels across two study years, 2021 and 2022. Each graph represents different categories of weed emergence: all weed species, grasses, and broadleaves. The graphs are labeled as follows: Panel A, Panel B, Panel C for the year 2021, and Panel D, Panel E, Panel F for the year 2022. Each graph has the x-axis labeled as Days after planting cotton and the y-axis labeled as Total weed emergence (plants per square meter). The graphs use different colors to represent various cover crop biomass levels: black for fallow (0 kg per hectare), red for low biomass (less than 2,000 kg per hectare), green for medium biomass (less than 4,000 kg per hectare), and blue for high biomass (greater than 4,000 kg per hectare). Panel A shows the cumulative emergence of all weed species in 2021, with the black line indicating the highest emergence and the blue line the lowest. Panel B shows the cumulative emergence of grasses in 2021, following a similar pattern. Panel C shows the cumulative emergence of broadleaves in 2021, again with the black line indicating the highest emergence. Panel D shows the cumulative emergence of all weed species in 2022, with the black line indicating the highest emergence and the blue line the lowest. Panel E shows the cumulative emergence of grasses in 2022, following a similar pattern. Panel F shows the cumulative emergence of broadleaves in 2022, with the black line indicating the highest emergence. The graphs illustrate that higher cover crop biomass levels generally result in lower weed emergence.
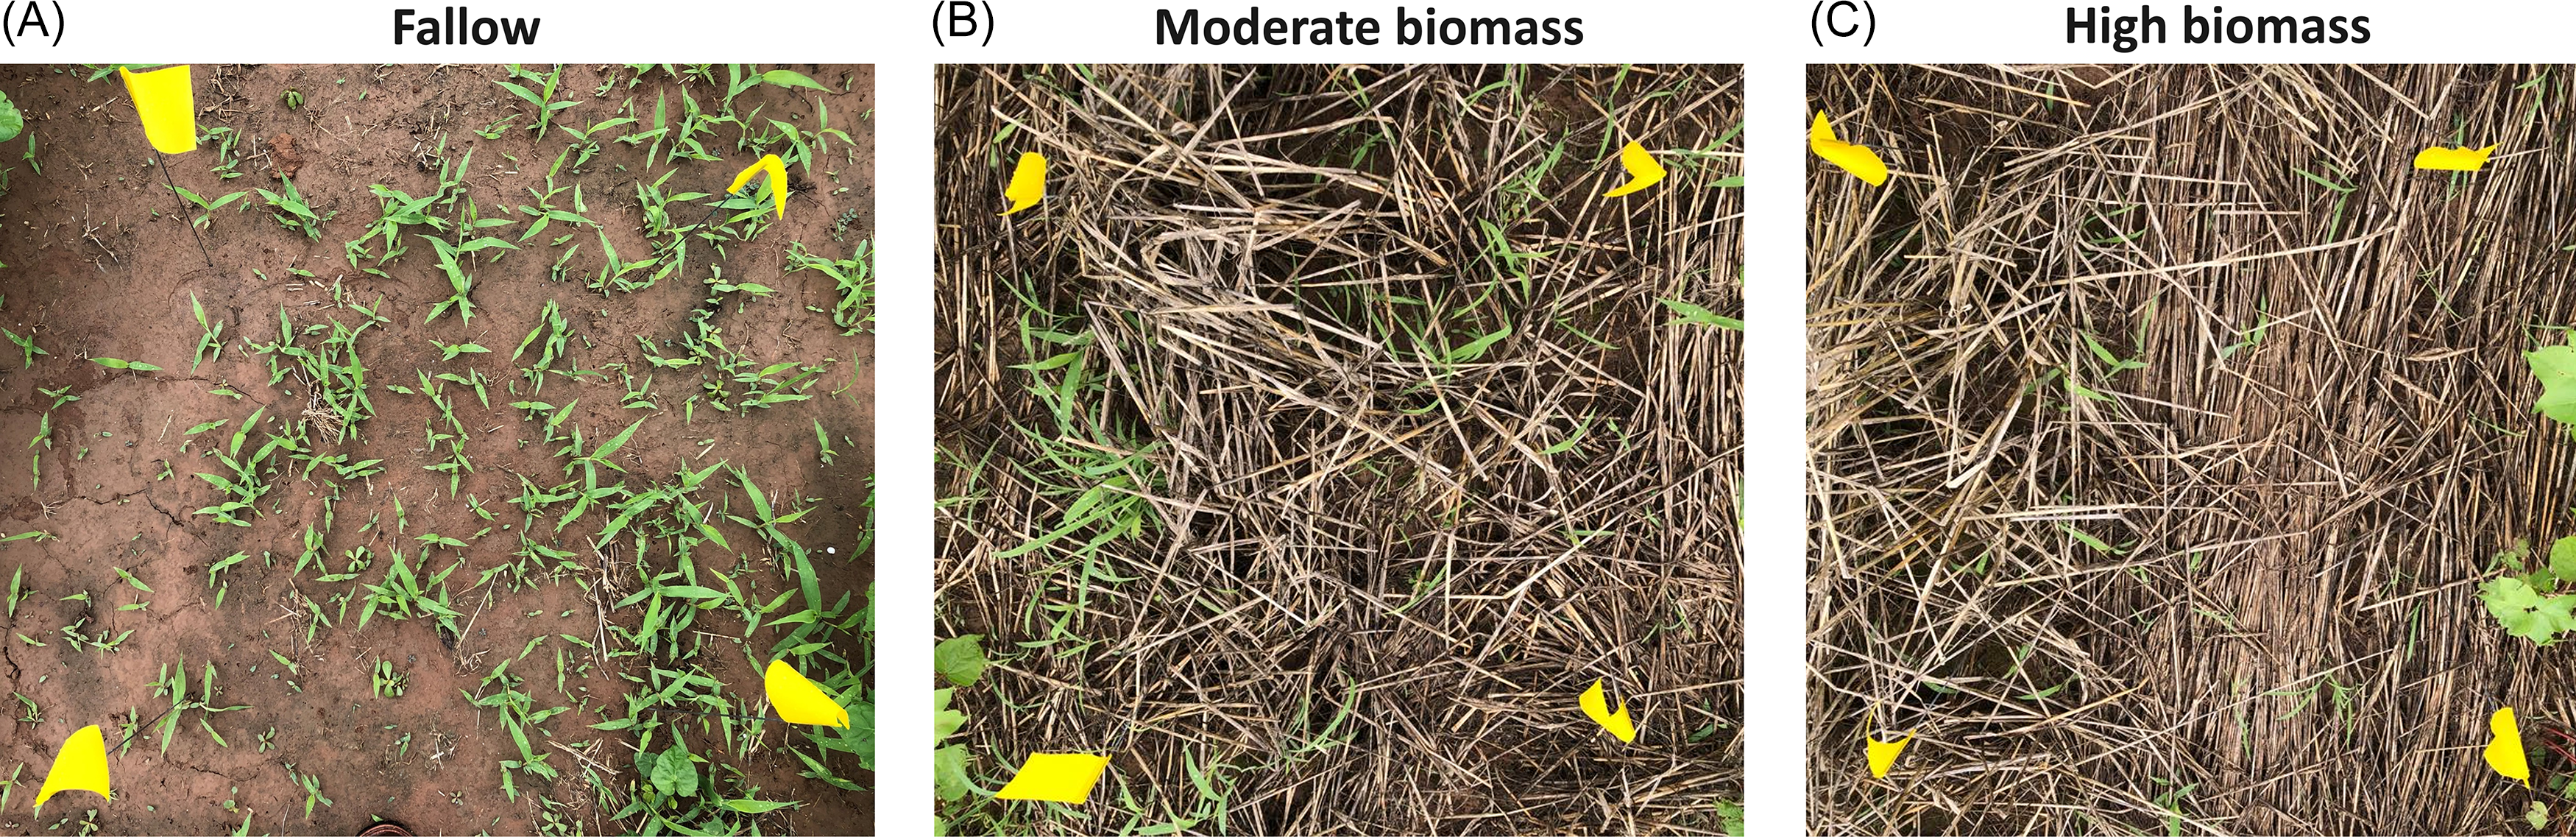
Examples of summer weed population densities in fallow (A), moderate cereal rye cover crop biomass (∼3,000 kg ha−1) (B), and high cereal rye cover crop biomass (∼5,000 kg ha−1) (C) at 3 wk after planting cotton in 2021.

Weed emergence patterns in 2022 were much different than those in 2021. Due to the lack of precipitation during the 2022 growing season, especially after May (Figure 3C), only one major weed cohort emerged early while soil water conditions were sufficient. Emergence almost stopped thereafter due to the lack of soil water and extreme heat until one irrigation event in late June (Figure 8D–F). Although irrigation was enough to keep the cotton crop alive, weed emergence was extremely low late in the season. Nonetheless, the total seedling emergence was lower in high cereal rye biomass plots than in fallow, as evidenced by the upper asymptotes (i.e., parameter a) of the emergence equations provided in Supplementary Table 2.
The delay in summer weed emergence patterns is likely related to the effect of cereal rye residues on soil temperature, specifically on thermal amplitude (Figure 4). Summer weed seeds need a specific minimum temperature (i.e., base temperature) to trigger germination and have an optimal temperature range in which germination is maximized (Horak et al. Reference Horak, Gao, Peterson and Maddux1998; Jha et al. Reference Jha, Norsworthy, Riley and Bridges2010). The optimum temperature for germination of A. palmeri, E. crus-galli, and A. ostryifolia, which are the most common weed species in our experimental site, is around 25 C (Horak et al. Reference Horak, Gao, Peterson and Maddux1998; Jha et al. Reference Jha, Norsworthy, Riley and Bridges2010; Martinkova et al. Reference Martinkova, Honek and Lukas2006). Cereal rye residue maintained the maximum soil temperature under 25 C until mid-April in both years. The maximum soil temperature in fallow exceeded this mark in early and mid-March in 2021 and 2022, respectively (Figure 4). A reduced soil thermal amplitude resulting from cereal rye residue may also have contributed to delayed summer weed emergence. Several studies have shown that many weed species germinate more readily when there is a wide fluctuation between minimum and maximum temperatures, compared with conditions where temperature variation is low or absent (Benech Arnold et al. Reference Benech Arnold, Ghersa, Sanchez and Insausti1990; Horak et al. Reference Horak, Gao, Peterson and Maddux1998; Jha et al. Reference Jha, Norsworthy, Riley and Bridges2010; Kruk et al. Reference Kruk, Insausti, Razul and Benech-Arnold2006). Therefore, by reducing both the soil maximum temperature and thermal amplitude, cereal rye could delay weed seedling emergence in summer cash crops.
Another possible factor in delaying weed emergence may be the depletion of soil N by the cereal rye cover crop. In field studies, germination rates of Powell amaranth (Amaranthus powellii S. Watson) increased with the addition of N fertilizer (Brainard et al. Reference Brainard, DiTommaso and Mohler2006). Other studies have reported that low soil N reduced the emergence and biomass of summer annual weeds (Menalled et al. Reference Menalled, Pethybridge, Pelzer, Smith, DiTommaso and Ryan2021; Sweeney et al. Reference Sweeney, Renner, Laboski and Davis2008). In natural settings, high soil nitrate concentrations typically occur when aboveground plant density is low, signaling minimal potential competition for emerging weed seedlings; weed ecologists refer to this as a gap detection mechanism (Pons Reference Pons1989). In our study, cereal rye consistently lowered soil nitrate levels, potentially delaying weed seed germination in early summer.
Delaying weed emergence has implications for crop health and yield. Recent research has shown that early-emerging weeds can negatively influence crop yield even before the established critical weed-free period. Crops detect imminent competition through reflected R/FR from the soil and thus spend more resources on growing tall and expanding canopy area at the expense of reproductive growth (Horvath et al. Reference Horvath, Bruggeman, Moriles-Miller, Anderson, Dogramaci, Scheffler, Hernandez, Foley and Clay2018). However, studies have proven that late-emerging weeds do not interfere as much with resource allocation in the crop, even when population densities are high (Horvath et al. Reference Horvath, Clay, Swanton, Anderson and Chao2023). Therefore, delaying weed emergence with a cereal rye cover crop could prevent weed-induced yield losses in the early growing season. Furthermore, delaying weed seedling emergence can delay weed maturity and seed shattering before harvest, thereby improving the effectiveness of harvest weed seed control strategies.
This study documents the biomass production potential of a cereal rye cover crop in southeast Texas and in comparable environments. It also demonstrates the relationship between cereal rye biomass production and the reduction in weed population densities. Cereal rye can be an effective weed management tool in cotton-based crop systems. Our results show that increasing seeding rate does not always increase cereal rye biomass production, but delaying cereal rye cover crop termination is effective in increasing aboveground biomass. Cereal rye residue effectively suppressed weed emergence in the early season, and high cereal rye biomass is more reliable at preventing emergence than lower biomass levels (Figure 9). However, it is still possible to achieve ∼60% or higher weed suppression with biomass levels between 2,000 and 3,000 kg ha−1. Additionally, this study provides information on how a cereal rye cover crop may delay weed emergence by influencing the soil environment under the residues. Our results show that a cereal rye cover crop can deplete soil water while it is alive, thus limiting water availability to weeds. Cereal rye residue can lower maximum soil temperatures and raise minimum soil temperatures, thereby reducing overall soil thermal amplitude in spring and delaying weed emergence in early summer. Cereal rye can also remove soil N, thereby reducing its availability to weed seedlings. Thus, our results offer clear evidence that a cereal rye cover crop can play an important role in delaying summer weed seedling emergence by affecting maximum soil temperature, soil thermal amplitude, and soil N availability. This study also provides evidence that cereal rye cover crop suppresses weeds through mechanisms beyond mulching, although the study was not designed to determine the exact contribution of each mechanism. Future research should isolate the mechanisms of weed suppression by cereal rye to determine their relative contributions to overall weed suppression.
Supplementary material
To view supplementary material for this article, please visit https://doi.org/10.1017/wsc.2026.10112
Acknowledgments
We acknowledge Daniel Hathcoat and Daniel Lavy for their help with field operations.
Funding statement
GCS acknowledges financial support from the Avilés-Johnson Fellowship from the Office of Graduate and Professional Studies at Texas A&M University. This research was funded in part by a USDA-NIFA Organic Transitions Program (award no. 2019-51106-30192) and Cotton Incorporated (award no. 20-739).
Competing interests
The authors declare no conflicts of interest.


 Open access

