





1. Introduction
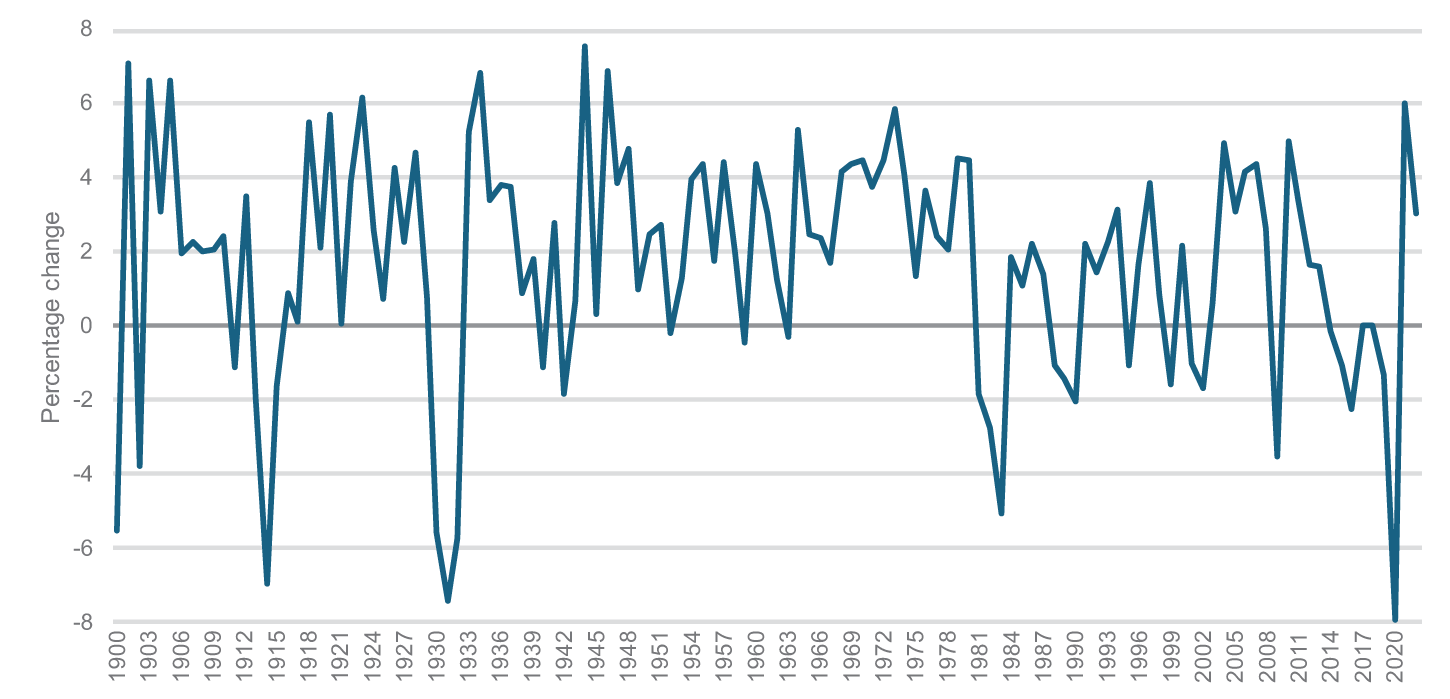
The COVID-19 pandemic drove the world economy to its worst downturn in almost a century (Figure 1). Latin America was the region of the world most affected, both in terms of public health and economic outcomes. In 2020, GDP per capita fell by nearly 8% at the regional level, and considerably more in various countries. Over the past 100 years, Latin America has endured several macroeconomic shocks, but none has been so deep, with all of its economies experiencing significant drops in a synchronized way. As our analysis shows, this is the single largest year-over-year decline in Latin America’s GDP per capita since at least the early 20th century, and the largest yearly drop in 2020 compared to the most important global regional aggregates. All the large economies in the region saw sharp contractions, exhibiting significant co-movement in their negative rates.Footnote 1
Latin America, GDP per capita (constant 2017 international $), year-on-year percentage change.

COVID-19 is a special shock in at least three ways. First, it is a natural disaster with severe economic consequences—a type of shock not seen by the region since the Great Influenza Pandemic of 1918–20. Unlike other natural disasters, like earthquakes and hurricanes, pandemics destroy human but not physical capital. However, they trigger policy and behavioral responses aimed at minimizing contagion that carry significant economic costs. Second, although country-specific outcomes varied widely (reflecting local vulnerabilities, policy choices, and institutional capacity), the synchronicity of the regional downturn was historically unprecedented. Third, the shock hit after years of economic underperformance in many countries, amplifying its effects and increasing the risk of a “lost decade” for the region. While we do not attempt to isolate the impact of pre-existing conditions, their role in shaping both exposure and resilience is critical for understanding the overall scale of the crisis. Finally, although the policy response to the pandemic in the region was much larger than originally expected, it paled in comparison to the one implemented by advanced economies.
In this paper, we compare the contractions triggered by COVID-19 to the various negative shocks that have hit Latin America over the past 100 years. We look at the largest drops in economic activity, either in a single year or cumulatively over multiple years (known in the literature as “rare disasters”), and at long periods of stagnation (which we call “lost decades,” as we explain in the literature review). Our analysis relies on historical GDP per capita data available for eight Latin American countries (that represented 87% of regional GDP in 2022) and 31 additional countries in other regions starting in 1870 (Barro and Ursúa, Reference Barro and Ursúa2008). The eight Latin American countries are Argentina, Brazil, Chile, Colombia, Mexico, Peru, Uruguay, and Venezuela. Because COVID-19 is the materialization of a prototypical rare disaster—a low-probability event with severe macroeconomic consequences—our analyses require taking the broadest possible perspective in time and space. We also make use of economic growth projections from IMF staff (International Monetary Fund, 2023). While not set in stone, these are helpful guides of what may follow COVID-19 if inertial trends and policy directions continue as expected.
Section 2 presents a short literature review, and in Section 3, we take a regional perspective and compare the COVID-19 shock to previous macroeconomic disasters in Latin America and other parts of the world. COVID-19 led to sharp contractions in other regions, but they paled in comparison to the one experienced by Latin America, where the regional aggregate experienced its largest historical contraction. In Section 4, we focus on country-specific experiences, analyzing how the largest yearly contractions due to COVID-19 happened in Venezuela, Peru, Argentina, Colombia, and Mexico, which are also the countries with the largest cumulative contractions if we consider sequential negative growth rates in years prior to 2020. These COVID-19 contractions meet the typical threshold used to define rare disasters—a peak-to-trough decline in GDP per capita by 10% or more.Footnote 2 But they are not among the largest the region has ever seen, as they are smaller than experiences during the Great Depression and the debt crises of the 1980s. That said, it is the first time that Latin American countries suffer such a major macroeconomic hit from a natural phenomenon, surpassing the impact from the Great Influenza Pandemic of 1918–20. In Section 5, we then discuss how COVID-19 compounded Latin America’s economic underperformance relative to other regions and its own history. In Section 6, we build on those observations to explore Latin America’s experience with “lost decades”—which we define as periods lasting at least 8 years when smoothed GDP per capita was lower at the end of the episode than at the beginning.Footnote 3 Across countries, we find 30 episodes—including ongoing ones in Argentina, Brazil, Mexico, and Venezuela. We also find that the 2010s episodes are the result of the confluence of the large shock of the pandemic, its scarring effects, and the underlying vulnerabilities of countries that in many cases were built over several decades.
We conclude with a discussion on how the COVID-19 shock could cast a long shadow. Since the onset of the pandemic, concerns emerged over cumulative costs of foregone output (Gopinath, Reference Gopinath2020). Despite economic growth rebounds seen over the course of 2021, ensuing dynamics over the course of 2022 muddled the recovery and added a number of challenges. These include repercussions from the Russia–Ukraine conflict, the significant rise in global interest rates, the drops in equity markets, raising inflation, and the strengthening of the U.S. dollar. As happened in other emerging and developing countries, although the rate of recovery was strong, none of the major economies of the region went back to the pre-2020 growth trend. Growth in the years following the pandemic was not sufficient to go back to the pre-pandemic trend, therefore making for significant scarring effects in all countries in the sample. When one adds the very large output gaps that countries experienced during 2020–22 with the large scarring that took place, the pandemic had major negative welfare implications for the region.
All in all, our historical analyses show that the COVID-19 economic crisis was Latin America’s largest annual contraction of GDP per capita in history. Since the early 20th century, the eight Latin American countries studied in this paper suffered a total of 52 macroeconomic disasters. Although the frequency of these disasters dropped after 1950, it did so by less than in the rest of the world. About two-thirds of rare disasters in the region are “of their own making,” as they are associated with domestic idiosyncratic, political, economic, or financial debacles. Colombia is the only country in our sample that has never experienced a macroeconomic rare disaster (although it came close to it during COVID-19). Latin America will have suffered another “lost decade” in the 2013–25 period due to the negative terms of trade shock, the COVID-19 shock, the unraveling of macroeconomic disequilibria in some countries, and the inability to weather a variety of additional shocks emerging in 2022. In half of the countries in our sample, a lost decade is already unfolding or is extremely likely, including Argentina, Brazil, Mexico, and Venezuela.
In essence, and as we have mentioned, Latin America is not uniquely prone to external shocks, but it is unusually prone to turning shocks into prolonged stagnation. This pattern reflects a combination of high macroeconomic volatility (Hnatkovska and Loayza, Reference Hnatkovska and Loayza2004; Arroyo Marioli et al., Reference Arroyo Marioli, Fatás and Vasishtha2023), institutional weaknesses (Berg et al., Reference Berg, Ostry and Zettelmeyer2008), and policy cycles characterized by populism and fiscal mismanagement (Dornbusch and Edwards, Reference Dornbusch, Edwards, Dornbusch and Edwards1991). Our use of the rare disaster and lost decade frameworks is consistent with these historical findings and with the broader literature on growth collapses. While these concepts necessitate arbitrary thresholds, they provide a systematic way to identify and compare severe macroeconomic episodes across time and geography, and they resonate with Latin America’s historical experience.
This paper contributes to this rich literature by identifying growth disasters over an extensive historical sample of 8 countries, examining the COVID-19 episode through the lens of historical macroeconomic collapses, and focusing specifically on Latin America. It explores the nature of the shock that drove the region’s economies into rare disaster territory, contextualizing this event within Latin America’s broader history of financial crises and political instability. It further introduces the concept of “lost decades,” identifying and characterizing this prolonged period of stagnation in various Latin American countries. This approach not only enriches our understanding of the COVID-19 crisis but also provides a more comprehensive perspective on the region’s recurring struggles with macroeconomic stability and long-term growth.
2. Literature review
There is a growing literature that goes beyond measuring traditional business cycle moments and crisis behavior in developed, but especially in emerging and developing economies, aiming to identify extreme and infrequent patterns in the growth process. For example, Rietz (Reference Rietz1988), Barro (Reference Barro2006), and Barro and Ursúa (Reference Barro and Ursúa2012) examine sharp cumulative drops in GDP, termed “economic disasters,” to explain the equity premium puzzle. Farhi and Gabaix (Reference Farhi and Gabaix2016) further extend this rare-disaster framework to explain exchange rate behavior, showing how rare, extreme shocks can help explain exchange rate dynamics and the forward premium puzzle.
Other scholars focus on growth in periods where GDP per capita contracts and remains at depressed levels for relatively large periods. Rodrik (Reference Rodrik1999) emphasizes that external shocks interact with domestic institutional and political weaknesses, making some economies far more prone to turning short-term disruptions into long-term stagnation. Analyzing breaks in the growth process in 1975, following the oil shock of 1973–74, he identifies “growth collapses” as clear structural breaks from previous trends, marked by a significant and persistent decline in average growth rates. Hausmann et al. (Reference Hausmann, Rodríguez and Wagner2006) investigated GDP collapses, defined as periods that begin with a contraction of per capita output and finalize when GDP per capita recovers its initial level. Their cross-country evidence shows that such collapses are not only frequent in Latin America but also unusually persistent compared to other regions, often lasting for over a decade.
Hausmann et al. (Reference Hausmann, Pritchett and Rodrik2005) look at the opposite dynamic, analyzing periods of growth acceleration sustained for 8 years or more with a post-acceleration growth rate of at least 3.5%, concluding that economic reforms are one of the best predictors of sustained growth accelerations. Berg et al. (Reference Berg, Ostry and Zettelmeyer2008) also provide further evidence that sustained and accelerated growth (growth spells) is more likely in countries with stable macroeconomic environments and credible policy frameworks by analyzing periods with a minimum growth acceleration of 2 percentage points and a duration of at least 8 years. In doing so, they use a hazard model to identify the determinants of the start and end of growth spells. Pritchett (Reference Pritchett2000) attempts to bring many of these patterns together and characterize, following a graphic analysis, hills, plateaus, plains, and mountains to denote growth, stagnation, and drops, as well as catastrophic falls in the form of cliffs and steady declines in the shape of valleys. All the papers in this literature end up making some arbitrary choices that fit their qualitative characterization of the type of episodes that represent sharp, persistent deviations from historical growth trends they want to study.
This first strand of literature lays out various frameworks for defining extreme episodes using arbitrary thresholds of “very large or very long” disruptions in GDP. We adopt the 10% cumulative GDP per capita decline threshold following Barro and Ursúa’s (Reference Barro and Ursúa2008, Reference Barro and Ursúa2012) “rare disasters” framework. We work with an extended version of their historical dataset, making their calibration relevant to the choice of what an “extreme and rare” negative growth period is. Moreover, there is some evidence that the 10% and 15% thresholds used by Barro (Reference Barro2006) and Barro and Ursúa (Reference Barro and Ursúa2008, Reference Barro and Ursúa2012) explain capital market and exchange rate pricing and therefore are a relevant threshold used by academics that explains market participants’ behavior. The 10% criterion also aligns well with the historical record of systemic breakdowns in Latin America.
A second strand of literature focuses on the roots of macroeconomic crises in Latin America. Kehoe and Nicolini’s (Reference Kehoe and Nicolini2022) important effort to document the monetary and fiscal history of Latin America is a good start to understand the policy problems behind the region’s experience with crises and collapses. Similarly, Calvo et al. (Reference Calvo, Izquierdo and Talvi2006) highlight the role of sudden stops of external financing in deepening such crises. Diaz Alejandro’s work was prescient (Reference Díaz Alejandro, Aspe, Dornbusch and Obstfeld1983) in identifying financial excesses as major contributors to macroeconomic disequilibria. These papers highlight the thesis that large output collapses in Latin America often emerge from a combination of external triggers and domestic macroeconomic imbalances.
Dornbusch and Edwards (Reference Dornbusch, Edwards, Dornbusch and Edwards1991) go deeper in search of the political economy roots of these macroeconomic problems to further explain these dynamics, arguing that the long history of Latin American populism provides an avenue to explain how politically motivated expansionary policies often generated short-term booms followed by severe fiscal crises and stagnation. This cycle is highly relevant to the post-2014 Latin American experience, where, after an almost decade-long boom in commodity prices, the reversal of the process coupled with populist policy in some countries created the conditions for collapses and another potential lost decade. Céspedes and Velasco (Reference Céspedes, Velasco, Arezki, Patillo, Quintyn and Zhu2012) argue in their study of commodity price cycles that Latin America’s macroeconomic volatility is often amplified by terms-of-trade shocks. This makes such disasters more likely to occur following global commodity downturns, such as the one that preceded the pandemic.
The other definition used in our paper relevant to the literature on Latin America’s economic crises is that of “lost decades,” essentially periods of prolonged economic stagnation. While our definition is admittedly arbitrary, it has strong historical resonance in Latin America. For example, Ocampo and Parra (Reference Ocampo, Parra, Ocampo and Jomo2007) date the 1980s as the beginning of the period of “dual divergence” between growth in advanced and developing nations. Within this dual divergence, they mentioned the deeper problems taking place in Latin America, which they also referred to as “the lost decade” when the region fell further behind both advanced economies and emerging Asia. The term “lost decade” is a widely accepted shorthand for long stagnation in the region.
3. A severe and simultaneous shock
Rare disasters, by definition, happen infrequently. They entail the realization of low-probability events that have dramatic consequences. A sprawling research agenda aims to study these shocks based on historical macroeconomic data (Barro and Ursúa, Reference Barro and Ursúa2012). Gauging the key characteristics of rare disasters, including their probability distribution and key statistical moments, requires capturing enough realizations of these events. In turn, these can be found by analyzing the longest possible time series for the largest possible number of countries (Ursúa, Reference Ursúa2011).
To position COVID-19 in the taxonomy of shocks that have hit Latin America over the past 100 years, we exploit available historical data on GDP per capita since at least the early 20th century (Barro and Ursúa, Reference Barro and Ursúa2008), extended to the present using data and projections from the IMF (2023). Throughout the paper, we refer to GDP per capita data in real terms (based on constant international dollars). There are eight Latin American countries for which these series are available: Argentina, Brazil, Chile, Colombia, Mexico, Peru, Uruguay, and Venezuela. Fortunately, these countries represented around 87% of the “Latin America and the Caribbean” aggregate commonly used by the IMF in 2022—with the rest of the countries entailing smaller economies in the continent and the Caribbean. This means that our analyses for the regional aggregate are satisfactorily representative. Table 1 lists those countries and 31 additional ones that we include in our regional comparisons. Data for all countries start since at least World War I. For Latin America, we have data for all countries starting in 1905, and even earlier in most cases.Footnote 4
GDP per capita coverage and starting years for historical country aggregates

Table 1 Long description
Country GDP per capita coverage is summarized by listing each country aggregate and the first year available for its historical series. Earliest starts are in the Western Offshoots, led by the United States in 1790 and Australia and France in 1820, while Western Europe also begins early with the Netherlands in 1807 and Sweden in 1800. Latin America mostly starts in the late nineteenth century, from Brazil in 1850 and Chile in 1860 to Colombia in 1905. South and East Asia generally begins later, including China in 1890, Indonesia in 1880, and South Korea and South Africa both in 1911, though Japan starts in 1870. Several series have gaps despite their listed start years, notably Malaysia, Singapore, and the Philippines, and Greece has a single missing year. Some starting years are flagged as not fully continuous back to before the First World War and were therefore not used in most analyses, so coverage comparisons should account for these continuity limitations.
Note: The symbol * next to a starting date means that the series has missing years or periods: Greece (1944), Malaysia (1943–46), Singapore (1940–49), and Philippines (1941–45). Italics for the starting year mean the series was not used in most analyses because it did not have a fully continuous time series since at least before WWI (GDP for Greece was included because it was only missing a single year, and this does not affect the level comparison between segments). The superscript symbol ° next to the country code indicates inclusion in what we call the “OECD” sample (which excludes recent members). Overall, the table includes 42 countries, of which 39 are used in our exercises (21 OECD, 18 Non-OECD).
Source: Barro and Ursúa (Reference Barro and Ursúa2008, Reference Barro and Ursúa2012).
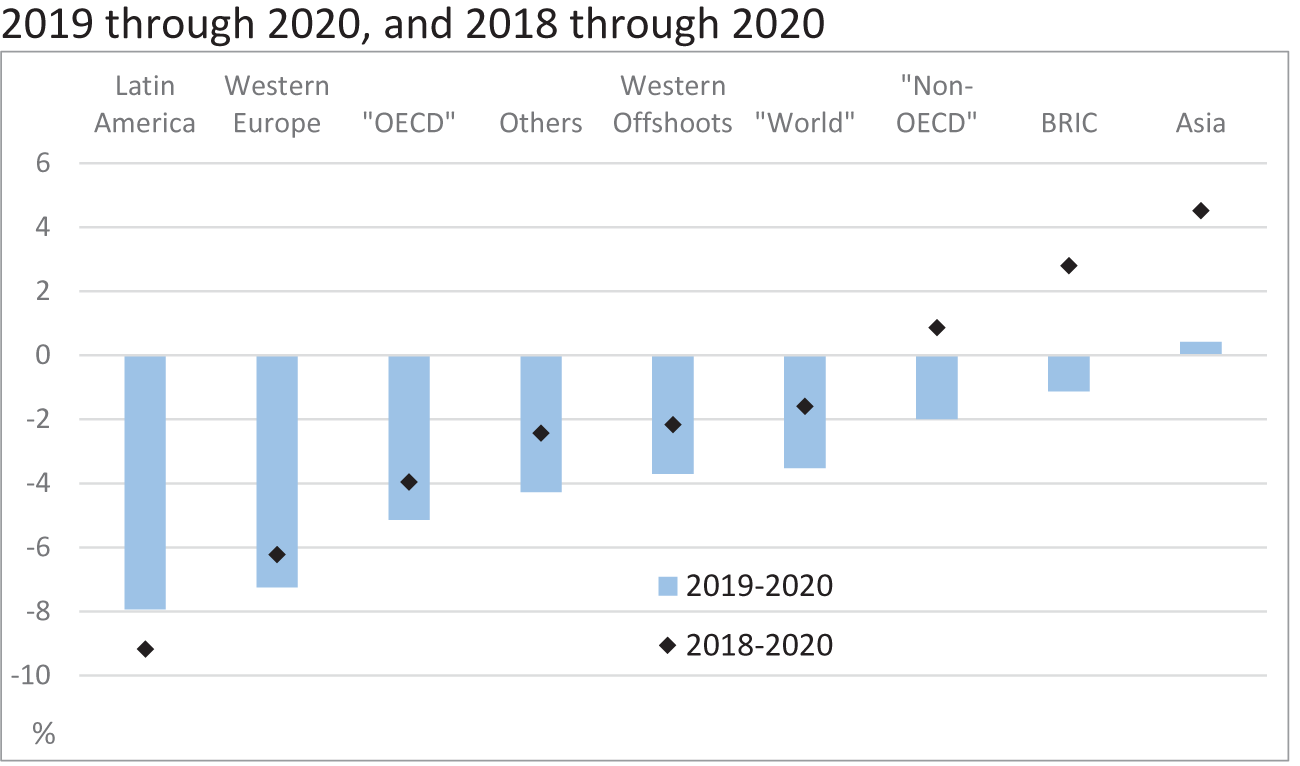
COVID-19 has been a devastating shock globally, but especially so for Latin America. From an economic standpoint, we can assess the damage by looking at 2020 changes in GDP per capita. Figure 2 compares the region’s historical aggregate performance to that of other country aggregates. No region was spared from the impact of the pandemic. Latin America heads the list, however, with a decline of 7.9% from 2019–20. In fact, it is the only region whose change in GDP per capita is even worse from 2018–20, with a decline by 9.2%. This stands in stark contrast with wealthier economies, captured in our historical aggregate called “OECD,” not to mention Asian economies, which fared significantly better.Footnote 6
COVID-19 GDP per capita declines in historical country aggregates: 2019 through 2020, and 2018 through 2020.

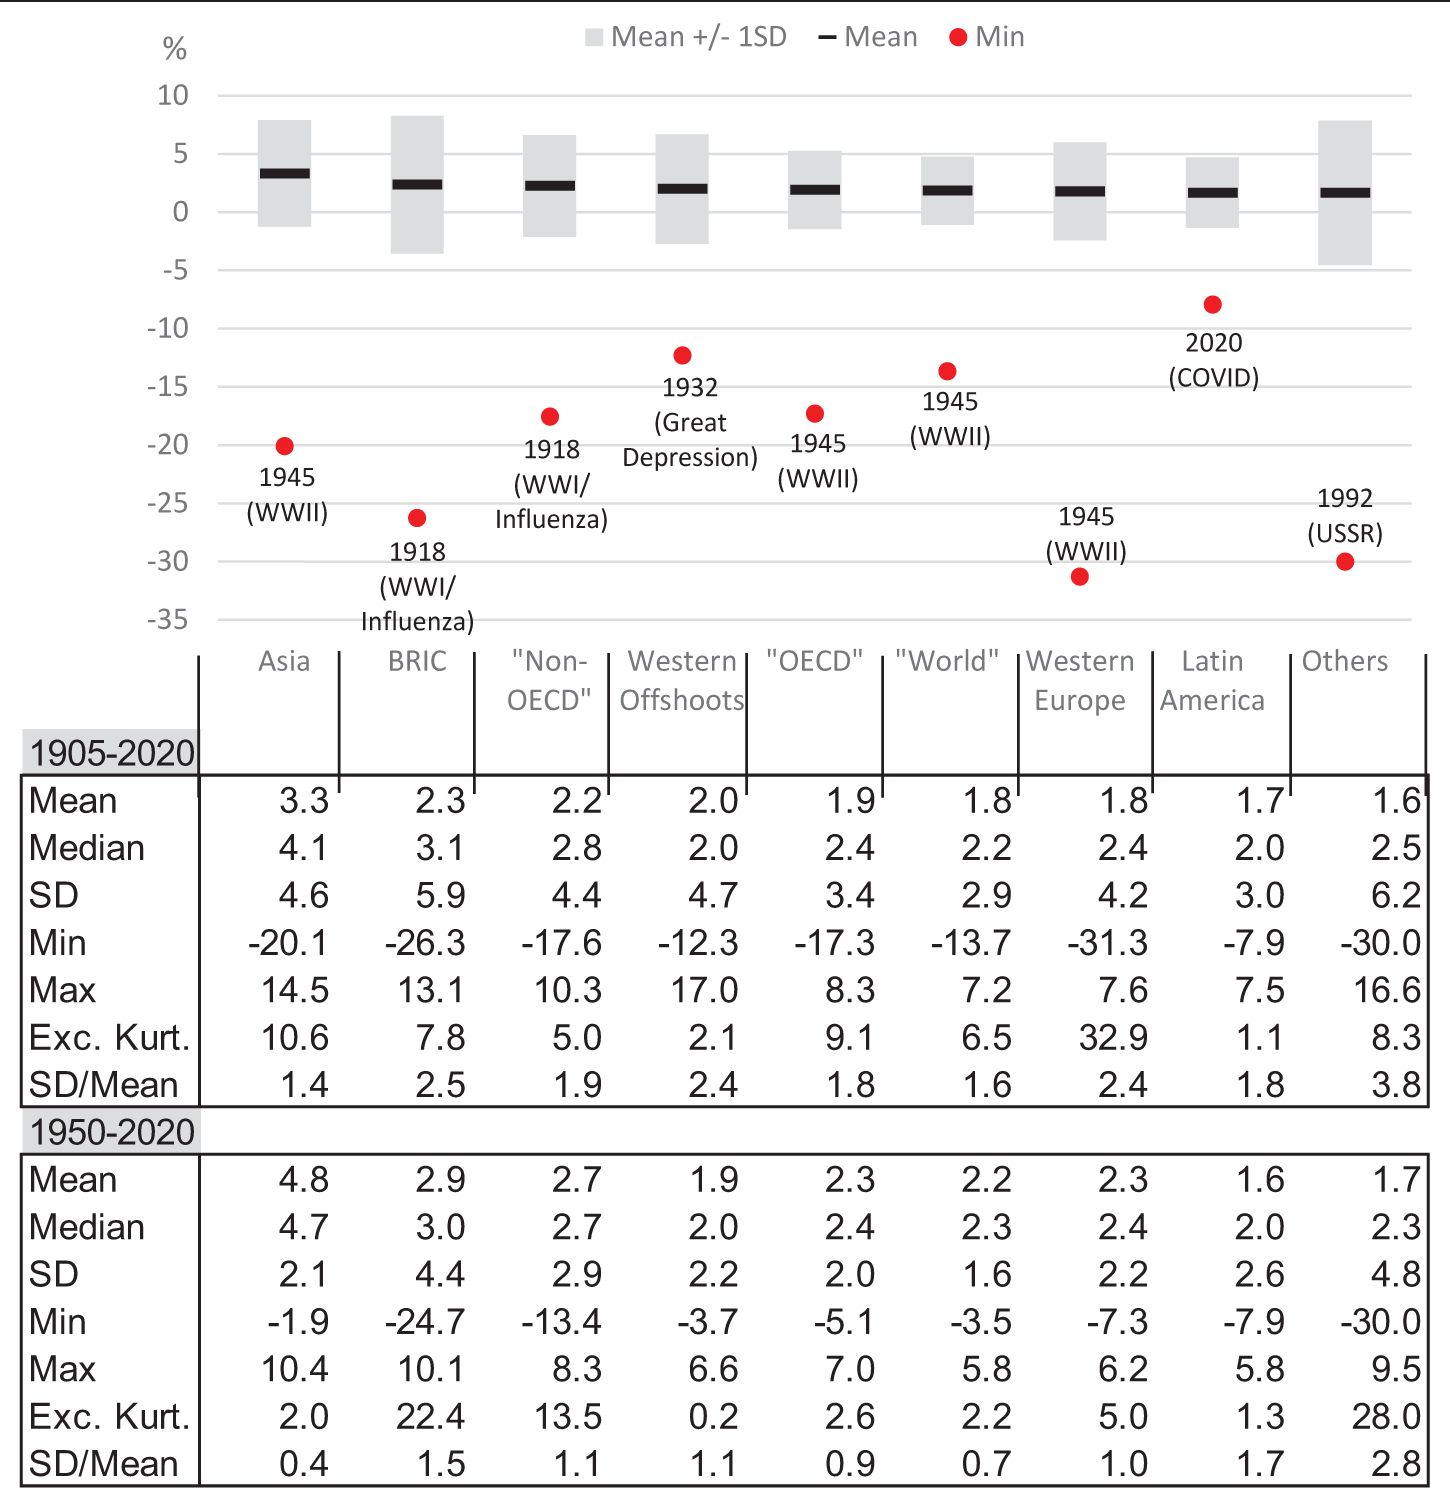
We now compare the COVID-19 shock to the historical record. Figure 3 ranks historical GDP per capita growth since 1905 for different country groups, with bands depicting plus and minus one standard deviation. It is clear that the past 100 years were not Latin America’s century. The lower part of Figure 3 shows key statistics by region. With an average growth of 1.7%, Latin America ranks second-to-last compared to other historical aggregates. The Asia historical aggregate, in contrast, leads the pack with an average growth rate of 3.3%.Footnote 7 Simply put, at those rates, it takes Asia nearly 21 years to double its GDP per capita; but it takes 42 years for Latin America to do the same.
2020 GDP per capita declines in historical country aggregates vs. historical distributions and record minimum yearly changes since 1905.

Figure 3 Long description
Annual GDP per capita growth rates in percent for various regions across two periods: 1905-2020 and 1950-2020. There are nine columns: Asia, BRIC, Non-OECD, Western Offshoots, OECD, World, Western Europe, Latin America and Others. Each period has six rows: Mean, Median, Standard Deviation, Minimum, Maximum and Excess Kurtosis. For 1905-2020, Asia has the highest mean growth at 3.3 percent, while Latin America has the lowest at 1.7 percent. The highest volatility is seen in BRIC with a standard deviation of 5.9 percent. The deepest minimum is in Western Europe at -31.3 percent. For 1950-2020, Asia again leads with a mean growth of 4.8 percent and Others have the lowest at 1.7 percent. BRIC shows the highest volatility with a standard deviation of 4.4 percent and the deepest minimum is in Others at -30.0 percent. The graph above the table shows GDP per capita growth with mean plus or minus one standard deviation and minimum values marked for historical events like WWI, WWII, the Great Depression and COVID-19. The axis is labeled in percent, indicating annual growth rates. The graph highlights the minimum growth during these events, showing significant declines in GDP per capita.
On the one hand, Latin America’s growth has been relatively less volatile than it has been for other regions. Of the regional aggregates shown in Figure 3, Latin America’s growth displays the lowest standard deviation across regions, at 3.0%. This compares to Asia’s 4.6%, for example. Moreover, until COVID-19, Latin America had not seen the depths of macroeconomic depressions observed elsewhere—generally associated with world wars or great dislocations.
This is reflected in considerably lower tail-risk estimates for the region (with excess kurtosis at 1.1 vs. Asia’s 10.6). On the other hand, “growth per unit of volatility” has recently been poor for Latin America. This is reflected in the second-highest coefficient of variation for the post-1950 period across sample groups. Intuitively, the tumultuous first half of the 20th century has a large impact on growth statistics across regions, as it encompasses major events like the World Wars, the Great Influenza Pandemic, and the Great Depression. The lower table in Figure 3 reproduces the exercise for the 1950–20 period. Descriptive statistics for Latin America do not change as much as they do for other regions. In this restricted time period, Latin America shows the lowest average growth, but it is no longer the least volatile, nor the one least prone to tail-risks. If anything then, the post-WWII period casts Latin America’s economic performance in an even less favorable light compared to other regions.
COVID-19 was the worst yearly growth experience on record for Latin America. Despite the region’s familiarity with recurrent financial crises, these had mostly occurred in specific countries at differentiated times—Chile in 1973, Brazil in 1990, Mexico in 1995, or Argentina in 2001. Even compared to the Great Depression, when Latin America saw consecutive contractions in each year from 1930–32, the COVID-19 contraction in 2020 surpasses them as the largest yearly decline on record.
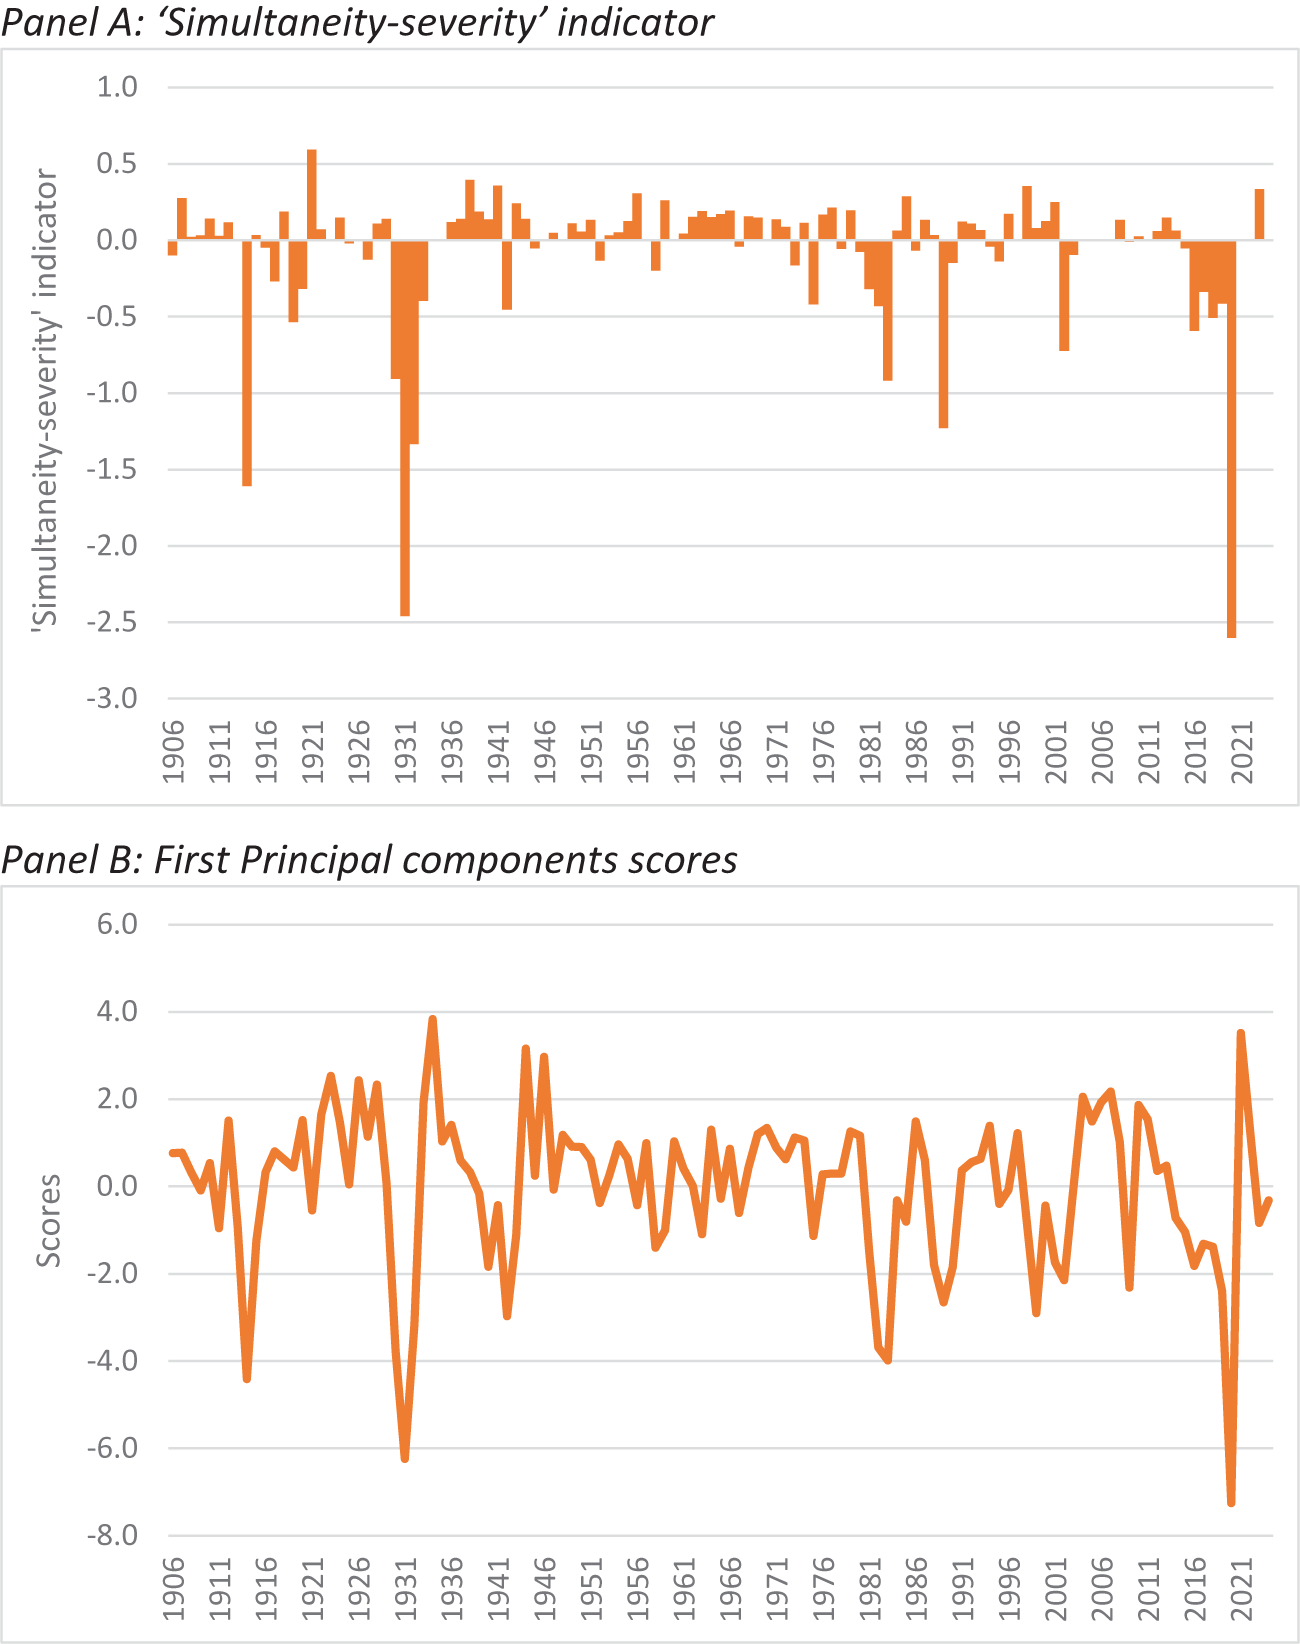
The COVID-19 shock imposed additional strains on Latin America because of its simultaneity, as measured by 2 different methods of co-movement of GDP and the common occurrence of negative rates in the region’s major economies in this period.Footnote 8 Most crises of the 20th century hit the region’s economies idiosyncratically. Instead, the COVID-19 shock was not only severe but also happened at the same time across countries. Figure 4 shows two ways to measure this from a statistical perspective. Panel A plots an indicator that accounts for the pervasiveness of negative growth rates and their depth in each year since we have full data for all countries. In turn, Panel B shows a measure of the commonality of the shock based on principal components analysis. The takeaway is that COVID-19 surpassed the Great Depression on both accounts. World War I and the 1980s crises come at distant third and fourth places, respectively.
Assessing the simultaneity of the COVID-19 shock in Latin America.

Figure 4 Long description
Simultaneity-severity indicator. Horizontal axis label: 1906 to 2021. Vertical axis label: Simultaneity-severity indicator. Vertical axis range: 1.0 to negative 3.0. Bars are plotted for each year. Many bars are close to 0.0. Several bars extend below 0.0, including one near negative 2.5 and another near negative 2.7. Several bars extend above 0.0, including one near 0.6. The image B showing First Principal components scores. Horizontal axis label: 1906 to 2021. Vertical axis label: Scores. Vertical axis range: 6.0 to negative 8.0. One line is plotted across the years. The line crosses 0.0 multiple times. The line includes a low point near negative 6.0 in the early part of the series and a low point near negative 7.5 near the end of the series. The line includes a high point near 4.0 in the early part of the series and a high point near 3.5 near the end of the series.
Simultaneity adds at least four challenges from a crisis management standpoint. First, it prevents an economy suffering a crisis from finding a release valve in other economies that may be doing well; for example, by softening the blow through import demand or cross-border labor/remittance flows. Second, it prevents the type of shock absorber that would commonly stabilize an economy; for example, FX depreciation relative to trading partners boosting exports or FDI flows in search of the relative cheapening of a country’s assets. Third, it might raise the bar for the type and size of international support that can be activated when crises are ring-fenced; for example, due to competing demand on multilateral institutions. Fourth, in a state of global commotion, local policy mistakes are less noticeable and may go uncorrected; for example, misguided approaches to dealing with the pandemic itself or the lack/excess of fiscal response. Altogether, and even if to varying extents across Latin American countries, these issues made the COVID-19 crisis worse than it would have been in isolation.
4. Differing country-specific outcomes
The history of economic collapses in Latin America is extensive, but there are important differences at the country level. In that sense, the heterogeneous impact of COVID-19 is not different from past episodes of global crisis. The earliest macroeconomic records that allow assessing the characteristics of these events from a statistical standpoint start in the mid-to-late 19th century. In this section, we use these data to make a few observations about individual country histories and comparisons.
All eight Latin American countries in our historical sample saw sizeable GDP per capita contractions in 2020. Some countries did significantly worse than others, or with respect to their own history. The group of “underperformers” includes Venezuela (−30.3%), Peru (−11.9%), Argentina (−10.8%), Mexico (−8.9%), and Colombia (−9.1%). Venezuela’s contraction is the second largest in its history, only surpassed by 2019. Argentina and Peru had not seen yearly contractions of this magnitude since their crises in the early 2000s and late 1980s, respectively. For Mexico, the 2020 contraction was the sharpest since the Great Depression, and noticeably worse than the “Tequila crisis” of the mid-1990s. For Colombia, the contraction was the sharpest ever. In turn, the group of “overperformers” includes Chile (−7.8%), Uruguay (−6.4%), and Brazil (−4.0%). Despite the relatively more benign outcomes compared to peers, these yearly contractions were the worst in nearly three decades for Chile, Uruguay, and Brazil.
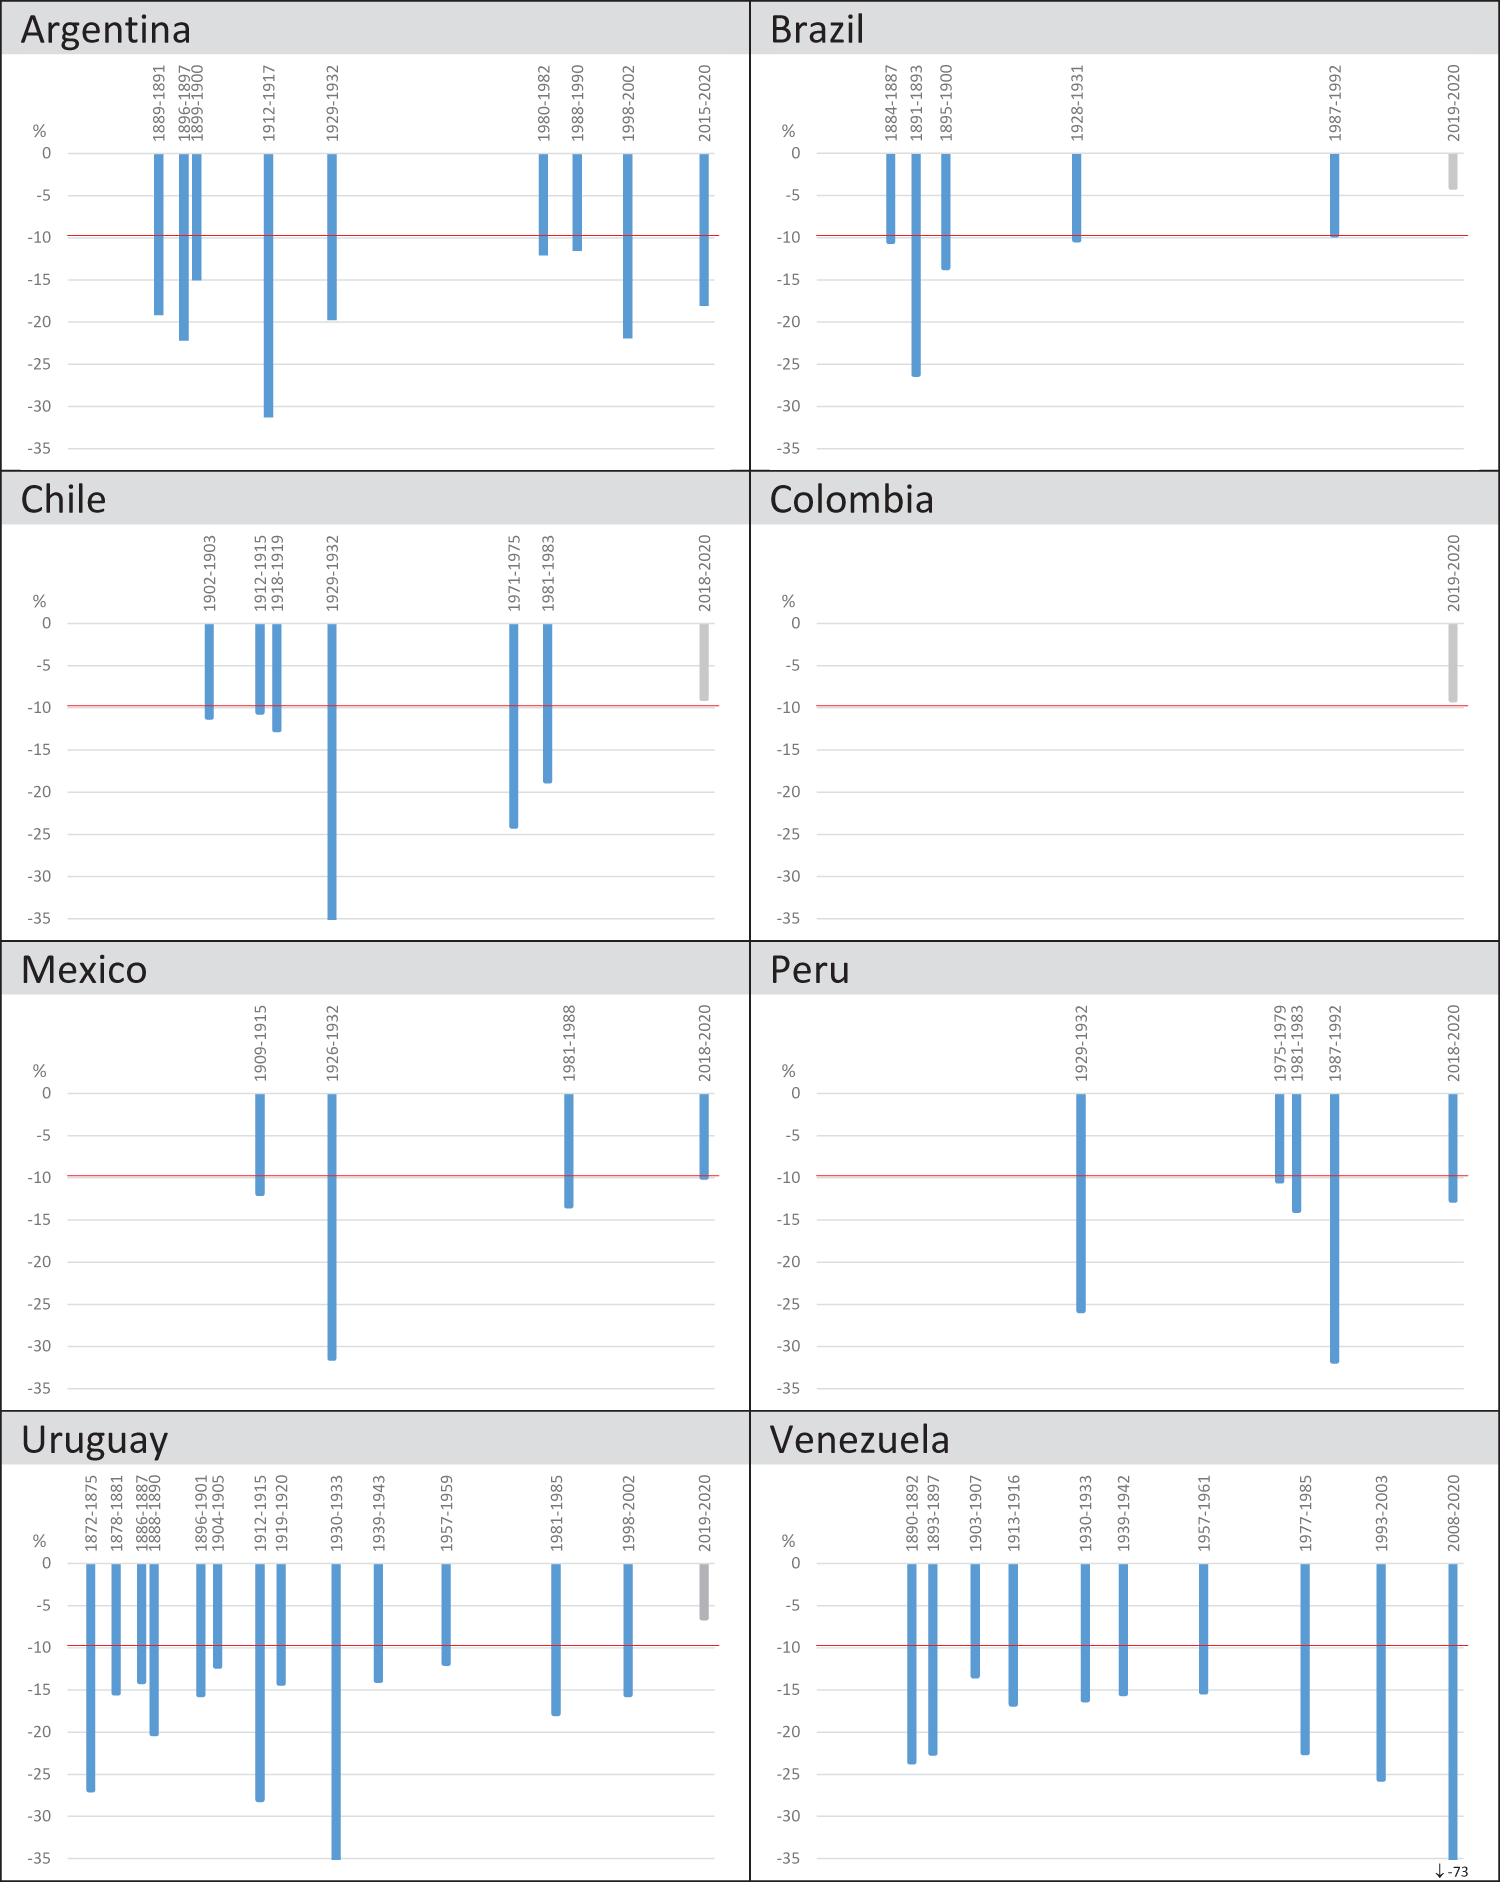
Figure 5 shows COVID-19 crises in the eight Latin American countries for which there are historical data, in the context of their previous “rare disasters.” We follow the literature in defining these as peak-to-trough contractions in GDP per capita by 10% or more. While these can be the result of a single year’s collapse, they more often span multiple years associated with one or more historical events. Altogether, we identify 52 GDP per capita disasters in Latin America: Argentina (9), Brazil (5), Chile (6), Colombia (none), Mexico (4), Peru (5), Uruguay (13), and Venezuela (10).
COVID-19 crises compared to rare disasters of GDP per capita in Latin American countries with available historical data.

Figure 5 Long description
Eight bar graphs, each representing a different Latin American country: Argentina, Brazil, Chile, Colombia, Mexico, Peru, Uruguay and Venezuela. The vertical axis for all graphs is labeled percent, ranging from 0 to minus 35, with a horizontal reference line at minus 10 percent. The horizontal axis represents disaster periods in year ranges, indicating percent contraction in GDP per capita. Argentina shows nine periods, with the largest contraction around minus 30 percent during 1988 to 1990. Brazil has six periods, with the deepest contraction near minus 15 percent in 1890 to 1891. Chile displays seven periods, with a significant contraction of about minus 30 percent in 1971 to 1975. Colombia has only one period, 2019 to 2020, slightly below minus 10 percent. Mexico shows four periods, with a notable contraction around minus 25 percent in 1929 to 1932. Peru has five periods, with the largest contraction near minus 25 percent in 1987 to 1992. Uruguay displays 13 periods, with the deepest contraction around minus 30 percent in 1981 to 1985. Venezuela shows 10 periods, including an extreme outlier at minus 73 percent in 2013 to 2020, which is below the plotted scale. All graphs use blue bars to represent contraction periods, with a red reference line at minus 10 percent. The 2019 to 2020 period is marked in gray where applicable.
In the case of COVID-19, four contractions in 2020 combined with previous years of negative growth to properly classify as macroeconomic rare disasters. These are:
1. Argentina 2015–20 (−17.8%; its 6th largest disaster since at least 1875): Including the transition from the last year of Kirchnerism to the Macri Administration and its financial crisis, and subsequent confidence crises ahead of the start of the Fernandez administration.
2. Mexico 2018–20 (−9.9%; its 4th largest disaster since at least 1895): Spanning the first 2 years of unfavorable policy decisions under the López administration, experiencing negative per capita growth in each year.
3. Peru 2018–20 (−12.6%; its 4th largest disaster since at least 1896): Including the tumultuous end of the Kuczynski administration and the sequence of four more presidents, three of them over the course of a week.
4. Venezuela 2008–20 (−73.0%; its worst disaster since at least 1883; −47.6% from 2018–20): Including the last two terms of Chávez’s presidency, and the succession to the ongoing Maduro administration.
Interestingly, in all four cases, political transitions and events compounded the severity of the COVID-19 shock—either by debilitating starting conditions or by implementing policies during the pandemic that aggravated the crisis. As discussed in the introduction, policy choices during the pandemic are important to explain the heterogeneous impact of COVID-19 on the economies of the region. The case of Venezuela is particularly lamentable. The extent of its macroeconomic decline since 2008 not only ranks as the country’s worst in recorded history since the 19th century, but also nearly matches the world’s largest GDP disaster. The collapse of Venezuela’s economy by 73.0% from 2008 through 2020 closely approximates Germany’s fall by 73.6% from 1943 through 1946, the worst GDP disaster recorded in modern history (Barro and Ursúa, Reference Barro and Ursúa2008).
In contrast to those four cases, Brazil, Chile, Colombia, and Uruguay did not reach the threshold of a rare disaster during the COVID-19 pandemic, at least not in terms of GDP per capita declines.Footnote 9 Contractions in Chile and Colombia were noticeably larger than in Brazil and Uruguay. In Brazil’s case, this is partly explained by the magnitude of fiscal support, which was by far the largest of the eight countries. Of course, the flipside of that support is that Brazil’s overall public indebtedness is today much larger than any of its Latin American peers as a share of GPD (with the exception of Venezuela). In Uruguay’s case, the relative efficiency of health policy responses, trust in government, and ease of border closures probably helped its macroeconomic decline avoid the disaster threshold.
At the country level, Latin America’s underperformance during COVID-19 is noteworthy. In the historical sample of countries listed in Table 1, only three other countries saw rare disasters associated with the pandemic: the Philippines (−10.7%), Spain (−11.8%), and the U.K. (−11.4%), all between 2019–20. The broader IMF database for additional countries not included in our comparisons because they lack historical data corroborates our observation about the region’s relative weakness. Of the 56 disasters related to COVID-19 that we find in that sample, five are in Latin America (Belize, Bolivia, Ecuador, Honduras, and Panama) and 12 more correspond to Caribbean nations (see full table in the Appendix). The rest are mostly low-income, commodity or tourism-dependent countries in the Middle East and Africa. Accordingly, countries in Latin America and the Caribbean bore a disproportionate impact from the pandemic compared to the rest of the world. In fact, almost two-thirds of countries in the IMF’s regional aggregate suffered rare disasters associated with COVID-19.
A full taxonomy of rare disasters—in terms of whether and how they are related to banking, external, inflation, debt, conflicts, or other types of crisis—is outside the scope of this paper. But we can use the ranking of Latin America’s rare disasters since the 19th century shown in Table 2 to make a few observations. The table presents the largest peak-to-trough GDP per capita declines found in our historical sample of countries, together with indicators characterizing these events along seven non-exclusive dimensions depending on whether the disaster can be associated with:
▪ Significant domestic or external conflicts (e.g. Mexico’s Cristero War of 1926–29).
▪ Natural phenomena (e.g. Great Influenza Pandemic of 1918–20).
▪ Major worldwide events (e.g. Great Depression of 1929–33).
▪ Significant commodity price declines (e.g. Unwinding of the boom post-2010).
▪ Significant benchmark yield increases (e.g. Fed rate hikes during 1976–81).
▪ Other causes, the majority of which would be localized economic or financial crises (e.g. Uruguay’s 2002 banking crisis).
▪ Post-World War II era, which we define simply as beginning after 1950 (excluding prior tumultuous global events and the immediate aftermath of WWII).
As mentioned before, Latin America’s top macroeconomic disaster—Venezuela’s 2008–20 experience, with a cumulative decline of 73%—matches the world’s largest disaster ever recorded. The smallest for Latin America would be Mexico’s from 2018–20 and Brazil’s from 1987–92, both only a touch below 10%. In the first case, it relates to unfavorable policy choices by the López Administration before and during the COVID-19 shock; while the second involved a turbulent transition from dictatorship to democracy. Of course, there are many other bad experiences, but they are farther from the 10% threshold. Altogether, the 52 GDP per capita disasters have a mean peak-to-trough contraction of 19.2% and a mean duration of 3.5 years. These numbers are similar to global averages—at 20.8% and 3.6 years, respectively, as computed for a much larger number of countries in Barro and Ursúa (Reference Barro and Ursúa2012) but before COVID-19 disasters materialized. Accordingly, Latin America’s GDP per capita rare disasters are not special compared to those of the rest of the world in terms of average magnitude and duration.
Ranking of GDP per capita disasters in Latin America since the 19th century, and selected key characteristics

Table 2 Long description
Ranked episodes of peak-to-trough declines in GDP per capita across Latin American countries from the late 1800s to 2020 are listed with indicative contributing factors. Venezuela 2008–2020 is the largest decline at 73.0 and is tagged as linked to global conditions, commodity shocks, and rising yields, and marked as post–World War II. The next biggest declines are Uruguay 1930–1933 at 36.7 and Chile 1929–1932 at 36.1, both associated with global and commodity-related shocks. Many high-ranking events cluster around the early 1930s and are frequently tagged as global and commodity episodes, consistent with worldwide downturn spillovers. Several post–World War II crises appear in the 1980s to early 2000s, including Peru 1987–1992 at 31.7, Venezuela 1993–2003 at 25.6, and Argentina 1998–2002 at 21.6, often tagged as commodity-related and sometimes yields-related. Conflict is rarely flagged, appearing notably for Mexico 1926–1932 and Chile 1971–1975, while nature-related tags appear for some periods including Uruguay 1919–1920 and multiple 2018–2020 entries. The smallest listed declines are COVID-era dislocations such as Brazil 2019–2020 at 4.0, which are included even when below the rare-disaster threshold and are marked as post–World War II. Factor tags are non-exclusive and indicative rather than definitive causes, so comparisons should focus on relative size, timing, and recurring co-movements with global, commodity, and yields conditions.
Note: “Size” corresponds to the absolute value of the peak-to-trough decline in GDP per capita, for the country and periods indicated. “Conflicts” refers to significant domestic or external conflicts for each country. “Nature” refers to natural phenomena, like pandemics or major earthquakes. “Global” refers to episodes coinciding or related to major worldwide events, like the world wars or the Great Depression. “Commodity” refers to large declines in global commodity prices. “Yields” refers to instances when global yields (using the U.S. 10-year yield as a proxy) increased significantly, as described in the text. “Other” refers to causes not primarily related to the previous five, including the majority of localized economic or financial crises. These categories are non-exclusive and merely indicative; they do not attempt to present a thorough taxonomy of rare disasters in the region. Cells in grey represent COVID-related dislocations that did not satisfy the 10% threshold to classify as rare disasters.
Source: Barro and Ursúa (Reference Barro and Ursúa2008), Sarkees et al. (Reference Sarkees and Wayman2010).
Latin American rare disasters are special, however, in happening relatively more frequently. Following previous work, we compute the probability of an economy moving from a state of normalcy to a state of disaster as the number of disasters divided by the number of normalcy years (in turn, given by subtracting the number of years spent in disaster from the overall number of annual observations). This calculation yields a probability of 5.6% per year (applied as a constant over time and across Latin American countries). This is higher than the 3.7% probability obtained for a global sample in Barro and Ursúa (Reference Barro and Ursúa2008), again computed before COVID-19 disasters materialized. In turn, the probability of moving from a state of disaster to a state of normalcy turns out to be 28% for Latin America, which roughly coincides with the global figure. In sum, Latin American economies are somewhat more likely than the average country to fall into a state of disaster, but their probability of recovery per year is the same as for other countries.
Latin American rare disasters are also special in being less likely to be associated with conflicts than they have been for other regions. Of the four disasters that can be directly connected to conflicts, three of them stemmed from domestic strife (Mexico’s Revolution in the 1910s and Cristero War in the 1920s, and Chile’s 1973 coup d’état) and one related to a bilateral confrontation (the Falklands War between Argentina and the U.K. in the early 1980s).
Instead, most Latin American rare disasters have tended to occur in the context of financial turmoil during peacetime—usually involving banking, debt, external, or inflation crises. Many of these happened in the post-WWII era. Effectively, nearly 40% of rare disasters in Latin America have occurred after 1950. This shows some improvement relative to the region’s history, at least in the sense that the bulk of its rare disasters happened in earlier decades. However, it is discouraging compared to the global average, which shows that only about a fifth of GDP rare disasters have occurred after WWII (Barro and Ursua, 2012). Accordingly, the rest of the world has done significantly better at avoiding disasters in recent decades compared to Latin America.
At the country level, the two contrasting experiences of Uruguay and Colombia are illustrative of intra-regional heterogeneity. On the one hand, Uruguay has suffered more disasters than any other country in the region (with a total of 13 experiences, heavily skewed to the beginning of the sample period), perhaps related to its relative vulnerability to recurring crises in Argentina and Brazil. On the other hand, Colombia has managed to avoid GDP per capita disasters altogether, although it came close during COVID-19. This is no small feat, considering that all developed markets in the global sample have actually suffered GDP per capita disasters, including multiple events in the United States, for example.
The COVID-19 crisis appears to be the most severe occasion when economies in the region suffered rare disasters linked to natural phenomena. In a more localized fashion, Chile, Mexico, and Uruguay all saw GDP per capita disasters around the time of the Great Influenza Pandemic of 1918–20. None of the three countries was a combatant in World War I, which is a likely confounding factor of crises found around that time in other countries (Barro et al., Reference Barro, Ursúa and Weng2022). Mexico did endure a long Revolutionary War period that officially ended in 1920, so the 1909–15 disaster may be related to it. In any case, outside of these three countries, the region had been mostly spared the GDP growth impact from pandemics until COVID-19 happened.Footnote 10
The ranking also shows that Latin America’s rare disasters have often happened independently of global events. The Great Depression is related to many disasters in the region, but not the two world wars (especially not World War II, which at a global level is related to some of the largest disasters on record). A crude estimate is that about a third of Latin America’s disasters can be directly related to global events. In contrast, excluding conflicts, natural and global events still leaves about 60% unrelated to those major categories. Accordingly, most of Latin America’s macroeconomic disasters have been the consequence of economic mismanagement and domestic dynamics.
Idiosyncratic disasters in Latin America have generally involved political, economic, or financial debacles. These often happen in the midst of challenging contexts for either external accounts or financial conditions. To quantify the share of disasters associated with each of those contexts, we applied the methodology of rare disasters in two specific areas:
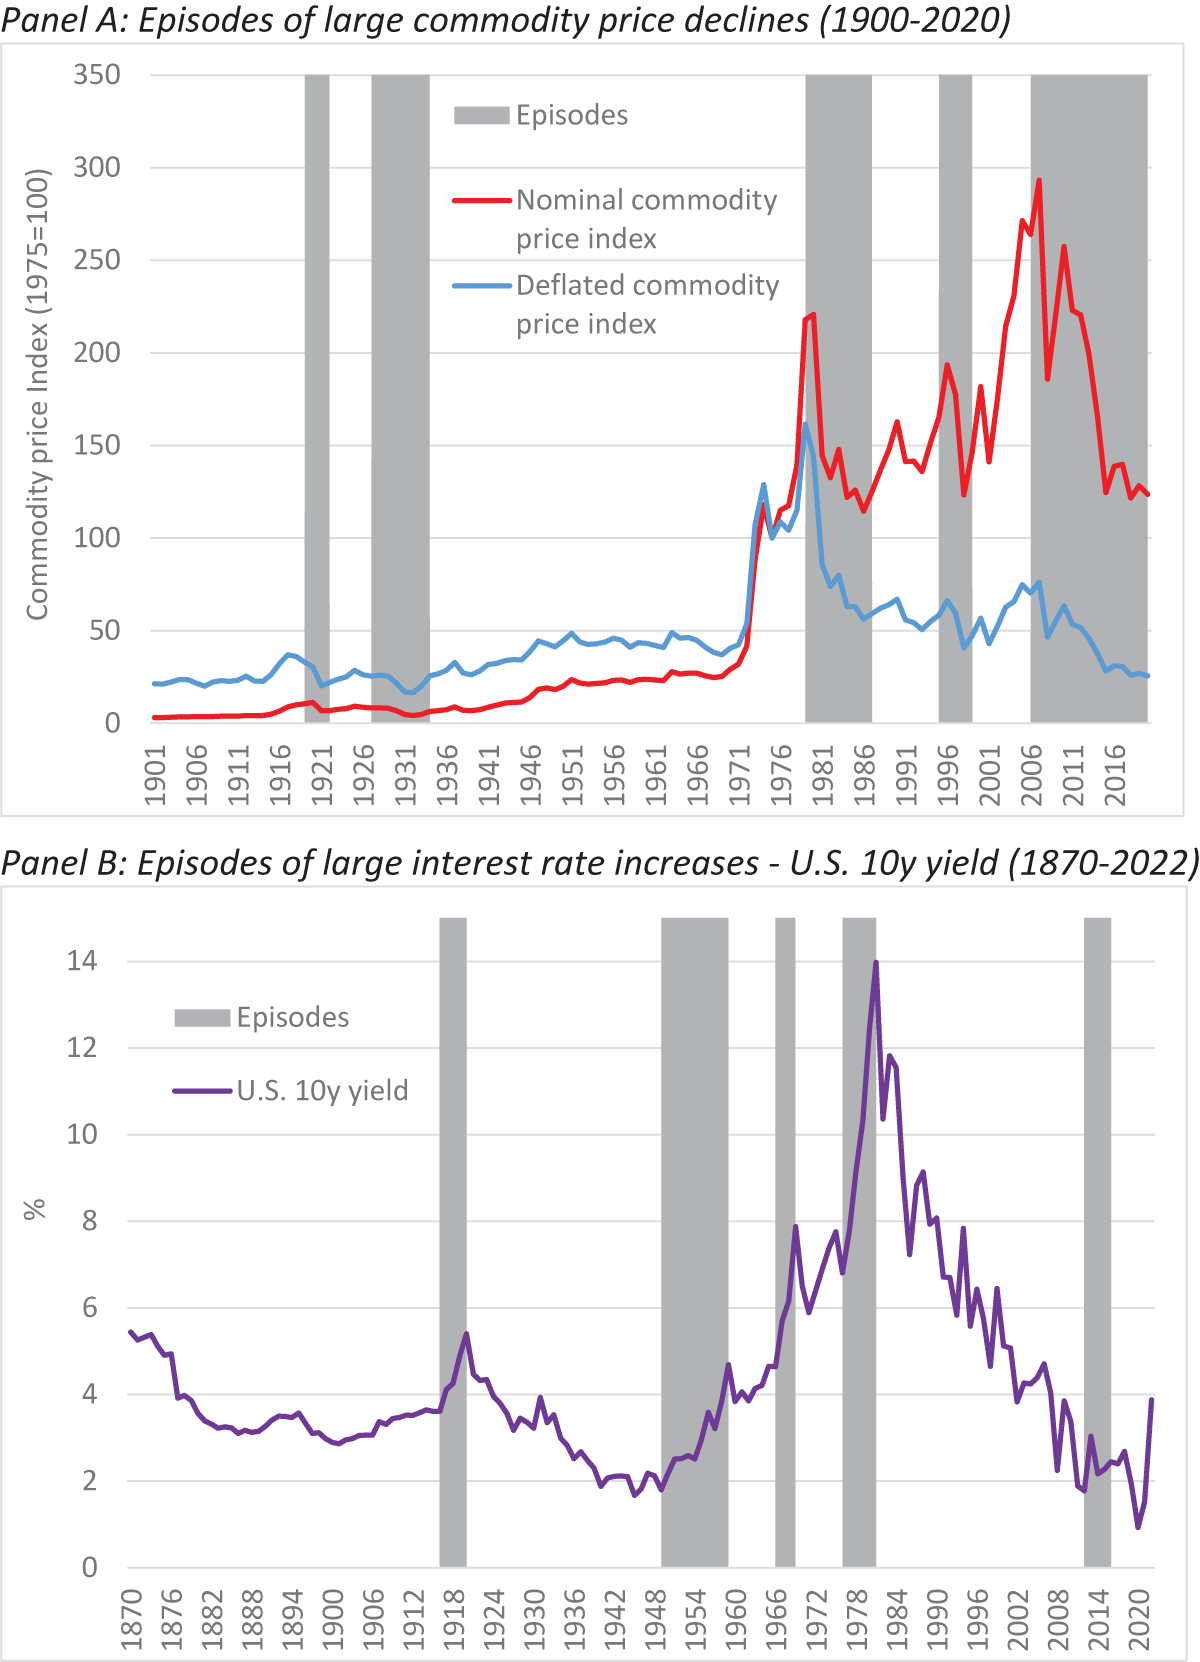
▪ First, we looked for instances of significant commodity price declines since 1900, using a threshold of at least 30% for the peak-to-trough contraction, and allowing for multi-year durations that did not recover to the original level for at least 3 years.Footnote 11 Figure 6 (Panel A) shows the resulting five episodes spanning the periods 1920–21, 1928–32, 1980–86, 1996–98, and 2007–20, with an average decline of 47% and an average duration of 5.2 years. All in all, we find that about 50% of Latin America’s rare GDP disasters in our sample have happened in the midst of these large commodity price declines. In addition, the average disaster associated with large commodity price declines has been relatively larger than the general average (at 22.2% vs. 19.2%). Therefore, sizeable falls in terms of trade appear to have either led or at least contributed (surely in combination with other factors) to many of the largest of Latin America’s GDP disasters.
Figure 6.Challenging episodes for external accounts or financial conditions.
 Note: See text and Appendix for details on the construction of the commodity price index. The deflated index is based on the U.S. CPI index.Source: Bloomberg, Federico and Tena Junguito (2018), Geronimi et al. (2018), Grilli and Yang (1988), Ocampo and Parra-Lancourt (2010), U.S. Federal Reserve, World Bank (2023).
Figure 6 Long description
Panel A shows episodes of large commodity price declines from 1900 to 2020. The x-axis represents years and the y-axis represents the commodity price index with a base of 1975 equals 100, ranging from 0 to 350. The red line indicates the nominal commodity price index, while the blue line shows the deflated commodity price index. Notable trends include a divergence after the early 1970s, with the nominal index peaking around the 2000s near 300 and the deflated index peaking around the 1970s near 150. Gray vertical bands mark episodes of significant declines. Panel B displays episodes of large interest rate increases in the U. S. 10-year yield from 1870 to 2022. The x-axis shows years and the y-axis shows percentage, ranging from 0 to 14. The purple line represents the U. S. 10-year yield, peaking around 1981 near 14 percent and reaching lows around the 1940s and 2010s near 2 percent. Gray bands highlight periods of significant interest rate increases. The graphs illustrate how these episodes align with major movements in commodity prices and interest rates.

At the country level, there seems to be no significant correlation between GDP per capita changes during large commodity price declines and a country’s openness to trade.Footnote 12 Conditioning on the change being an actual disaster (i.e. GDP per capita falling by at least 10%) yields a positive correlation of about 35%. This may signal that higher openness to trade has been associated with worse outcomes in the face of terms of trade shocks, but the sample is limited (less than 10 country-specific episodes) and warrants more careful analysis in future work.
▪ Second, we identified periods of significant tightening of financial conditions, proxied by trough-to-peak increases in the U.S. 10-year yield by at least 35% without reversion to its original level in at least 3 years. Figure 6 (Panel B) shows the resulting five episodes spanning the periods 1916–20, 1949–59, 1966–69, 1976–81, and 2012–16, with an average increase of 85% (or 315bp on average across episodes) and an average duration of 5.2 years. All in all, we find that about 30% of Latin America’s rare GDP disasters in our sample have happened in the midst of large global interest rate increases. A bit less than half of the associated disasters emerged during or after the late 1970s episode culminating in the Volcker shock. This illustrates how vulnerable Latin American economies have been to financial conditions abroad, especially in contexts of rigid exchange rate regimes, non-independent central banks, and high shares of external or hard-currency debt.
The ongoing increase in global interest rates will eventually classify as an episode of the type considered here. Over the course of 2022 alone, the Federal Reserve hiked the Federal Funds Rate by 425bp, but most Latin American central banks started their own hiking cycles considerably earlier. Whether this tightening of financial conditions is ultimately associated with the materialization of any rare disasters remains to be seen. But it certainly increases the region’s vulnerability.
5. Compounded economic underperformance
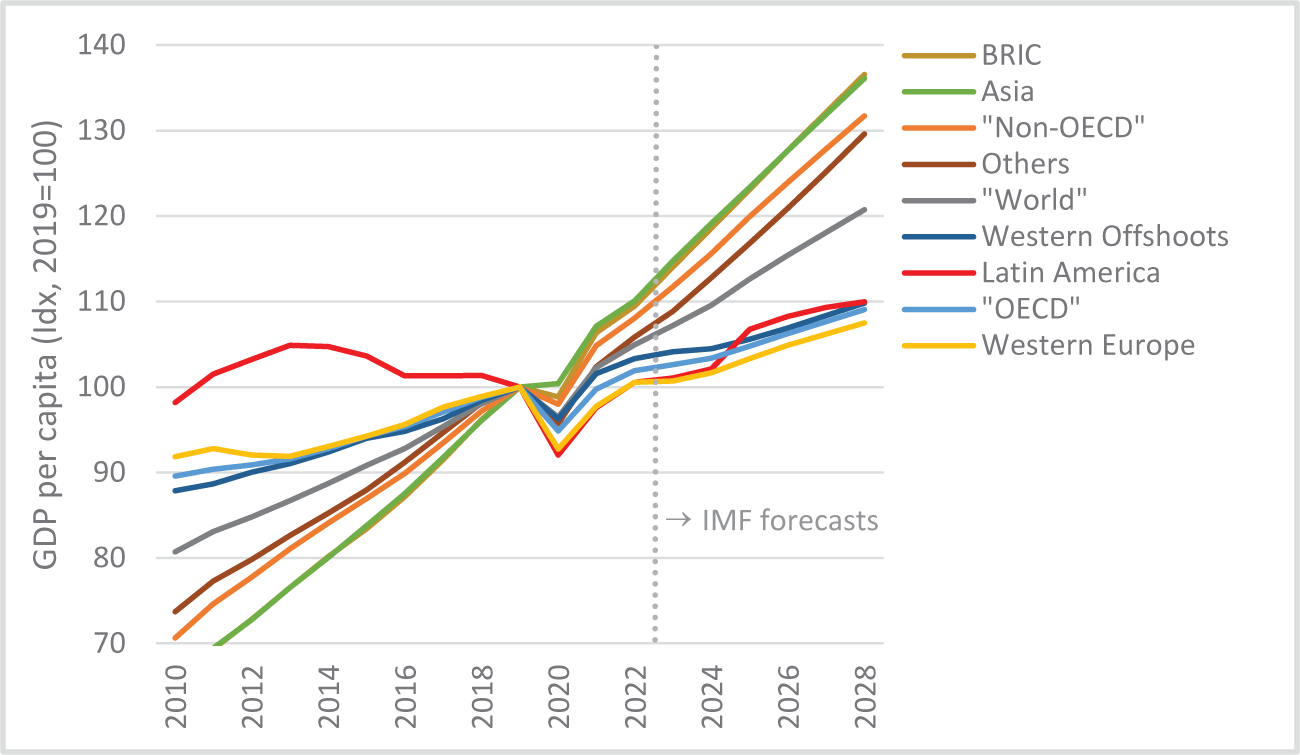
The COVID-19 shock hit Latin America in an already precarious position. Figure 7 shows that for nearly a decade, the region had been underperforming in terms of GDP per capita growth compared to other regions. In fact, Latin America’s GDP per capita in 2019 was nearly 5% lower than it was in 2013. This contrasts with the rest of global aggregates, all of which saw robust expansions during the 2010s. For example, the Asian aggregate’s GDP per capita increased by nearly 30% over the same period that Latin America’s was shrinking.
GDP per capita evolution since 2015 with IMF forecasts.

Figure 7 Long description
Gross domestic product per capita (idx, 2019 equals 100) Legend: BRIC; Asia; Non dash OECD; Others; World; Western Offshoots; Latin America; OECD; Western Europe. Horizontal axis: 2010 to 2028. Vertical axis: gross domestic product per capita (idx, 2019 equals 100), 70 to 140. Text near a vertical dotted line: IMF forecasts. BRIC: (2010, 72), (2011, 76), (2012, 79), (2013, 82), (2014, 85), (2015, 88), (2016, 92), (2017, 95), (2018, 98), (2019, 100), (2020, 95), (2021, 100), (2022, 104), (2023, 106), (2024, 108), (2025, 110), (2026, 112), (2027, 114), (2028, 116) Asia: (2010, 68), (2011, 71), (2012, 75), (2013, 79), (2014, 83), (2015, 87), (2016, 91), (2017, 95), (2018, 98), (2019, 100), (2020, 98), (2021, 107), (2022, 110), (2023, 114), (2024, 120), (2025, 125), (2026, 130), (2027, 134), (2028, 137) Non dash OECD: (2010, 70), (2011, 74), (2012, 78), (2013, 81), (2014, 84), (2015, 87), (2016, 90), (2017, 94), (2018, 97), (2019, 100), (2020, 96), (2021, 105), (2022, 109), (2023, 112), (2024, 118), (2025, 123), (2026, 127), (2027, 131), (2028, 134) Others: (2010, 74), (2011, 77), (2012, 80), (2013, 83), (2014, 86), (2015, 89), (2016, 92), (2017, 95), (2018, 98), (2019, 100), (2020, 97), (2021, 103), (2022, 106), (2023, 109), (2024, 113), (2025, 118), (2026, 122), (2027, 127), (2028, 130) World: (2010, 80), (2011, 82), (2012, 84), (2013, 86), (2014, 88), (2015, 90), (2016, 92), (2017, 94), (2018, 96), (2019, 100), (2020, 97), (2021, 101), (2022, 104), (2023, 106), (2024, 109), (2025, 112), (2026, 115), (2027, 118), (2028, 121) Western Offshoots: (2010, 88), (2011, 89), (2012, 90), (2013, 91), (2014, 92), (2015, 93), (2016, 94), (2017, 95), (2018, 97), (2019, 100), (2020, 96), (2021, 100), (2022, 102), (2023, 103), (2024, 104), (2025, 105), (2026, 106), (2027, 108), (2028, 109) Latin America: (2010, 98), (2011, 101), (2012, 103), (2013, 105), (2014, 105), (2015, 104), (2016, 102), (2017, 102), (2018, 102), (2019, 100), (2020, 92), (2021, 98), (2022, 100), (2023, 101), (2024, 102), (2025, 106), (2026, 108), (2027, 109), (2028, 110) OECD: (2010, 87), (2011, 88), (2012, 89), (2013, 90), (2014, 92), (2015, 93), (2016, 94), (2017, 96), (2018, 98), (2019, 100), (2020, 94), (2021, 99), (2022, 101), (2023, 102), (2024, 103), (2025, 105), (2026, 107), (2027, 109), (2028, 110) Western Europe: (2010, 92), (2011, 93), (2012, 92), (2013, 92), (2014, 92), (2015, 93), (2016, 94), (2017, 95), (2018, 97), (2019, 100), (2020, 95), (2021, 99), (2022, 100), (2023, 101), (2024, 102), (2025, 103), (2026, 105), (2027, 106), (2028, 108).
The causes behind Latin America’s underperformance since the Global Financial Crisis are related, but not fully explained, by fluctuations in commodity prices. Aggregate indices of commodity prices rose by nearly 70% from their trough in 2009 through 2011, and then fell by more than 50% through late 2019 (see Figure 6A). But average commodity prices during 2010–19 were in a similar nominal level to those during 1980–2009, when Latin America managed to grow at higher rates. Also, other emerging markets have been exposed to the same commodity price volatility, but have managed to grow faster than Latin America. It is also not true that Latin America has grown more slowly because it started at more advanced stages of development, as theories of growth convergence predict.Footnote 14 In fact, Latin America has underperformed compared to richer nations (even the aggregate for “Western Europe” managed to grow faster than Latin America from 2011–19).
Therefore, the explanation for Latin America’s recent underperformance must be broader, likely encompassing lower-quality institutions, lack of investment, and poor human capital. Our goal is not to discuss this complicated set of factors, but simply to highlight how COVID-19 compounded Latin America’s underperformance compared to other regions since the Global Financial Crisis. This leaves the region further behind and with uncertain prospects of ever “catching up” to peers, let alone developed markets.
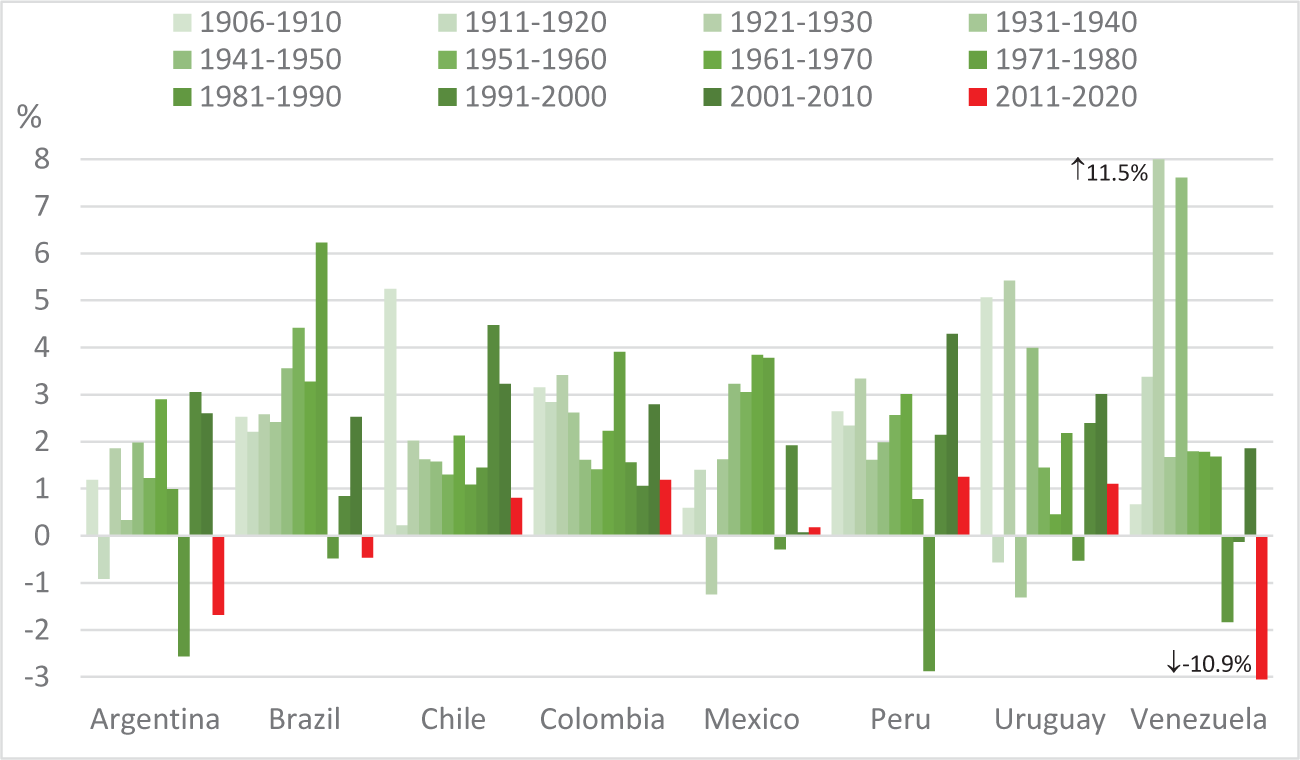
Latin America not only has underperformed compared to other regions, but also relative to its own history. This can be better appreciated at the country level. Figure 8 shows average GDP per capita growth rates by decade for the historical set of countries since their common time series begins in 1905. No country did better in 2011–20 than it did in the previous two decades combined. For Argentina and Venezuela, the last 10 years turned out to be a decade horribilis. Brazil comes next, with negative growth matching the turmoil of its experience in the 1980s. Mexico follows with nearly nil growth for 20 years. And in much better shape—not entirely offsetting the drag from the previous four countries, but at least with positive average growth rates—we find Chile, Uruguay, Peru, and Colombia. Note, however, that even in the latter two “best” cases, their average growth rate over the past decade was only somewhat above 1.2%.
Average GDP per capita growth rates by decade (%).

Figure 8 Long description
Grouped bar graph with country names on the horizontal axis: Argentina, Brazil, Chile, Colombia, Mexico, Peru, Uruguay, Venezuela. The vertical axis label is percent, with tick labels from minus 3 to 8. Legend across the top lists decades: 1906 dash 1910, 1911 dash 1920, 1921 dash 1930, 1931 dash 1940, 1941 dash 1950, 1951 dash 1960, 1961 dash 1970, 1971 dash 1980, 1981 dash 1990, 1991 dash 2000, 2001 dash 2010, 2011 dash 2020. Argentina bars include values around 1, 2, 3 and a negative bar near minus 3, plus a 2011 dash 2020 bar near minus 2. Brazil bars include values around 2 to 4, with one bar above 6 and a small negative bar slightly below 0. Chile bars include values around 1 to 2, one bar above 5 and a 2011 dash 2020 bar near 1. Colombia bars include values around 1 to 4 and a 2011 dash 2020 bar a little above 1. Mexico bars include values around 2 to 4, one negative bar near minus 1 and a 2011 dash 2020 bar slightly above 0. Peru bars include values around 1 to 4, one negative bar near minus 3 and a 2011 dash 2020 bar a little above 1. Uruguay bars include values around 1 to 5 and a 2011 dash 2020 bar near 1. Venezuela bars include several positive values around 1 to 3, two tall bars near 8 and a 2011 dash 2020 bar extending below the axis with a nearby label down arrow 10.9 percent. Near the top of the plot area there is a label up arrow 11.5 percent.
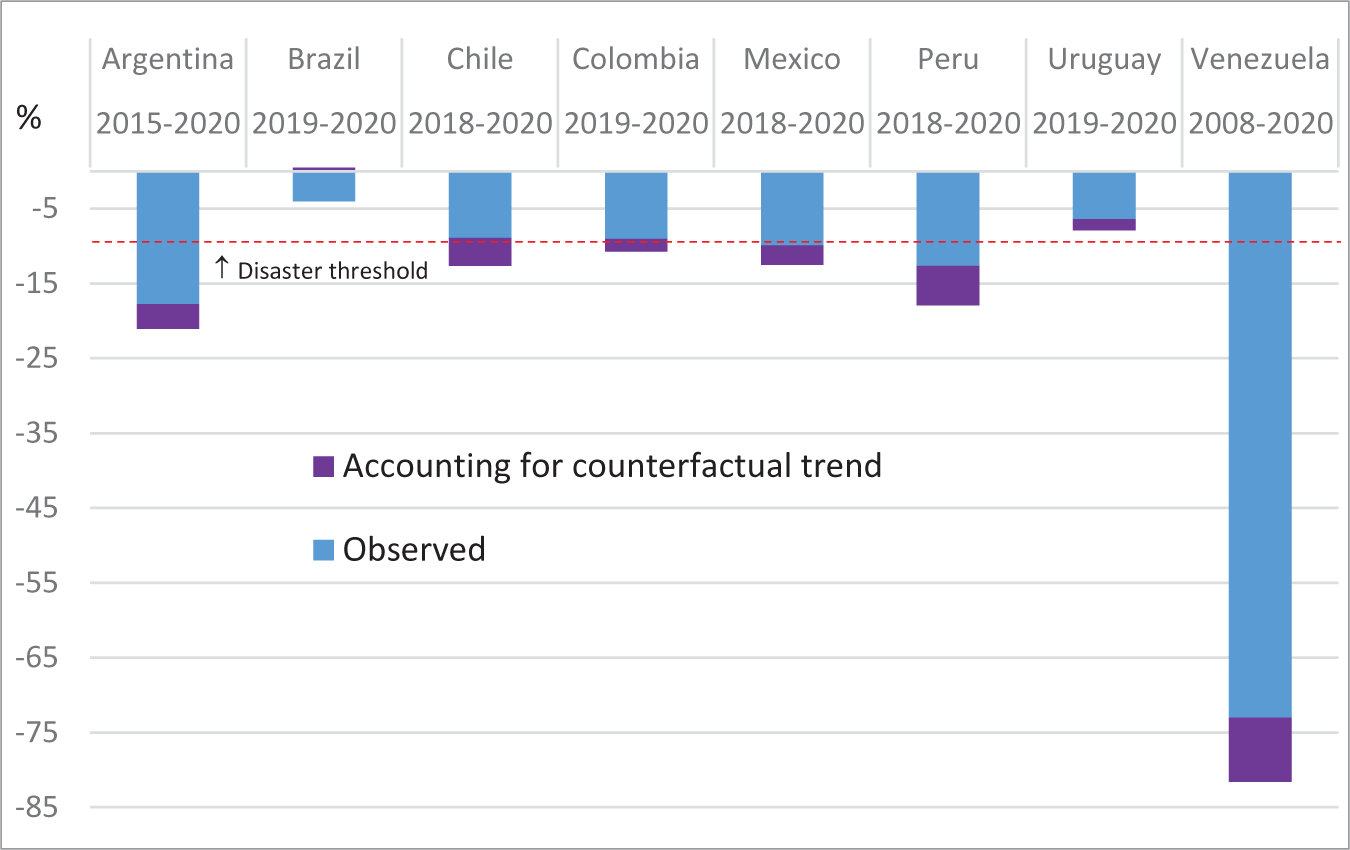
Relative to trends, the hit from COVID-19 was even worse, except for Brazil, than observed across the eight countries in our historical sample. It is always more art than science to draw useful counterfactuals; but a simple approach suffices to make the point.Footnote 15 Figure 9 shows the additional decline in GDP per capita that obtains when comparing 2020 observed levels with hypothetical levels based on pre-peak trends (defined as average growth in the previous 8 years, roughly the duration of a full business cycle). For example, as discussed before, Mexico’s recent macro disaster reflects a nearly 10% decline in GDP per capita from 2018 through 2020. That decline is what was actually observed. However, if growth in 2019 and 2020 had been equal to the average over the 2011–18 period (what we call the pre-peak trend), then the “true” disaster is larger by 2.6pp for a total decline of 12.6%. Outside of Brazil, where the pre-peak trend was actually negative, “true” disasters are larger than what was actually observed for all countries by an average of 3.8pp. In fact, by this metric, both Chile and Colombia would have also crossed the disaster threshold due to COVID-19 in 2020.
2020 GDP per capita declines as observed vs. accounting for the counterfactual trend before peak date.

6. “Lost decades” as a long-run risk
A key concern regarding the COVID-19 shock is that it has likely plunged Latin America into another “lost decade.” The experience this concept describes has been observed in Latin America, particularly in the 1980s. Generally speaking, lost decades are understood as relatively long periods of time when economies or regions make no progress in growing GDP or improving standards of living. As discussed in the previous section, Latin America has been underperforming since the aftermath of the Global Financial Crisis, both compared to other regions and its own history. This underperformance already represents a lost decade according to our extended long-run data.
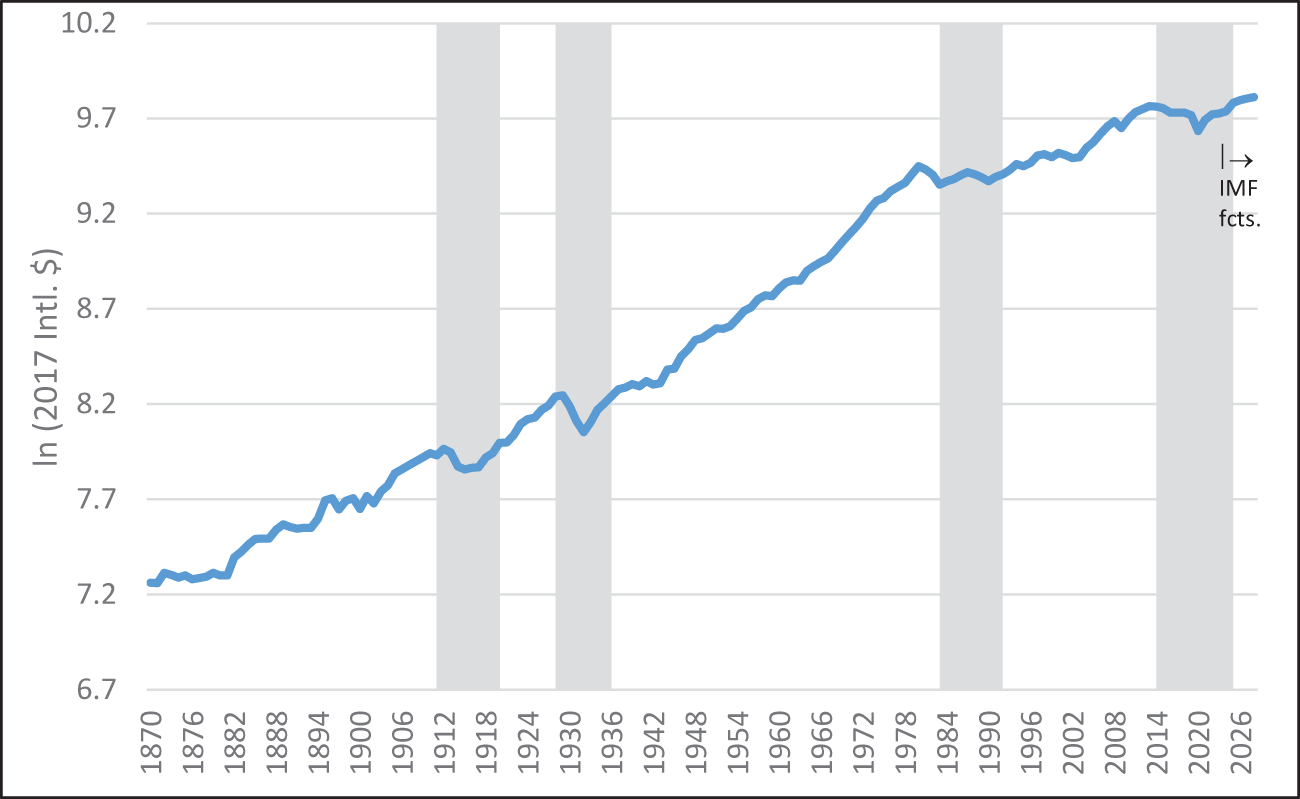
To formalize that statement, we define “lost decades” as periods lasting at least 8 years when smoothed GDP per capita was lower at the end of the episode than at the start. Smoothing the GDP series is desirable to filter out crises (a short-lived crisis, no matter how deep, does not accord with the more medium-run idea of a lost decade). For our purposes, we used the 5-year moving average of the GDP per capita series. Figure 10 shows the long-run series of Latin America’s GDP per capita in natural logarithms (so that movements of 0.1 in the scale are roughly equivalent to 10% moves in the underlying series). As explained before, we extended the series through 2028 using IMF (2023) forecasts. In turn, earlier years of the series have different numbers of constituents (with all countries present starting in 1905). The chart also shows periods satisfying our “lost decade” criterion. For Latin America as a whole, we find four lost decade episodes: 1911–20, 1928–36, 1983–92, and 2014–25f.Footnote 16 The last episode has already lasted long enough to classify as a lost decade. Accordingly, COVID-19 coming immediately after the adjustment the region went through as a consequence of lower terms of trade effectively plunged Latin America into what has already become the fourth lost decade episode in a century.
GDP per capita for the historical Latin American aggregate (levels in 2017 international $; logs), with “lost decades” indicators.

Figure 11 reproduces the exercise for the eight Latin American countries forming the historical aggregate. All in all, we find 26 episodes of lost decades, listed as follows (bold for episodes involving a rare disaster as discussed in Section 2):Footnote 17
▪ Argentina (5 episodes): 1909–23, 1927–39, 1976–93, 1997–2006, 2012–27f.
▪ Brazil (3 episodes): 1870–1903, 1989–97, 2013–24f.
▪ Chile (3 episodes): 1915–22, 1927–37, 1969–80.
▪ Colombia (zero episodes): ⊘
▪ Mexico (4 episodes): 1908–19, 1924–38, 1982–93, 2017–27f.
▪ Peru (1 episode): 1976–98.
▪ Uruguay (7 episodes): 1871–85, 1887–1906, 1911–22, 1928–40, 1956–70, 1980–91, 1998–2006.
▪ Venezuela (3 episodes): 1891–1910, 1977–2007, 2010–24f.
GDP per capita in historical sample of Latin American countries (levels in 2017 international $; logs), with “lost decades” indicator.

Figure 11 Long description
The multi-line graph compares GDP per capita in 2017 international dollars for Argentina, Brazil, Chile, Colombia, Mexico, Peru, Uruguay and Venezuela from 1870 to 2026. The horizontal axis represents years, while the vertical axis shows ln (2017 Intl. dollar) ranging from 6.7 to 10.2. Each country has its own graph panel. Shaded vertical bands indicate periods of ′lost decades.′ ′IMF fcts.′ suggests forecasted data. Argentina: Shows fluctuations with periods of growth and decline, peaking around 9.2 in recent years. Brazil: Displays strong growth, especially in the late 20th century, reaching approximately 10.2. Chile: Consistent growth with a peak near 9.2. Colombia: Steady rise throughout the timeline, peaking around 9.7. Mexico: Growth with fluctuations, peaking near 10.2. Peru: Strong rise in the late 20th century, peaking around 9.7. Uruguay: Fluctuations with growth, peaking near 9.7. Venezuela: Sharp decline post-2010s, dropping from a peak near 10.2 to below 9.2. Overall, Brazil, Chile and Peru show strong late-20th-century growth, while Venezuela experiences a significant drop after the mid-2010s.
There is a clear connection between macroeconomic rare disasters and lost decades in Latin America. All but one of the lost decade episodes involve at some point in their time span a rare disaster. The opposite happens less often, as only about 70% of disasters coincide with lost decade episodes. While the overall number of lost decade episodes is smaller than the overall number of disasters, this says nothing about their relative time frequency. In fact, our data show that Latin American countries spend about 16% of their time in a state of disaster (that is, going from a peak to a trough decline by at least 10%) and about 34% of their time in the midst of a lost decade episode. In other words, the unconditional probability that a Latin American country will be undergoing a lost decade episode—in any random year—is more than twice as high as the unconditional probability that it will be undergoing a rare disaster.
A particularly harmful effect of lost decade episodes is that they can erode a country’s wealth in stealth but might not trigger the sense of urgency needed to generate the political consensus to undergo a deep process of economic, political and institutional transformation. Disasters are often devastating, but a flipside is that it sometimes shakes the foundations of the political equilibrium to unleash a process of adjustment that can lead to significant corrections in institutions or policy. Over time, these can be beneficial for growth, like many of the liberalization policies that Latin American countries adopted in the 1990s following crises in the 1980s. Independent central banks, flexible exchange rate regimes, and openness to global trade are some of the trademarks of that creative destruction era. In contrast, lost decade episodes can go unnoticed, taking a long time to reach a breaking point that will set a country’s course in a better direction.
Of course, lost decades and rare disasters are tightly linked and have been pervasive in Latin America. In the next paragraphs, we put everything together and analyze what we consider to be the most salient episodes of the last century’s economic performance in the region.
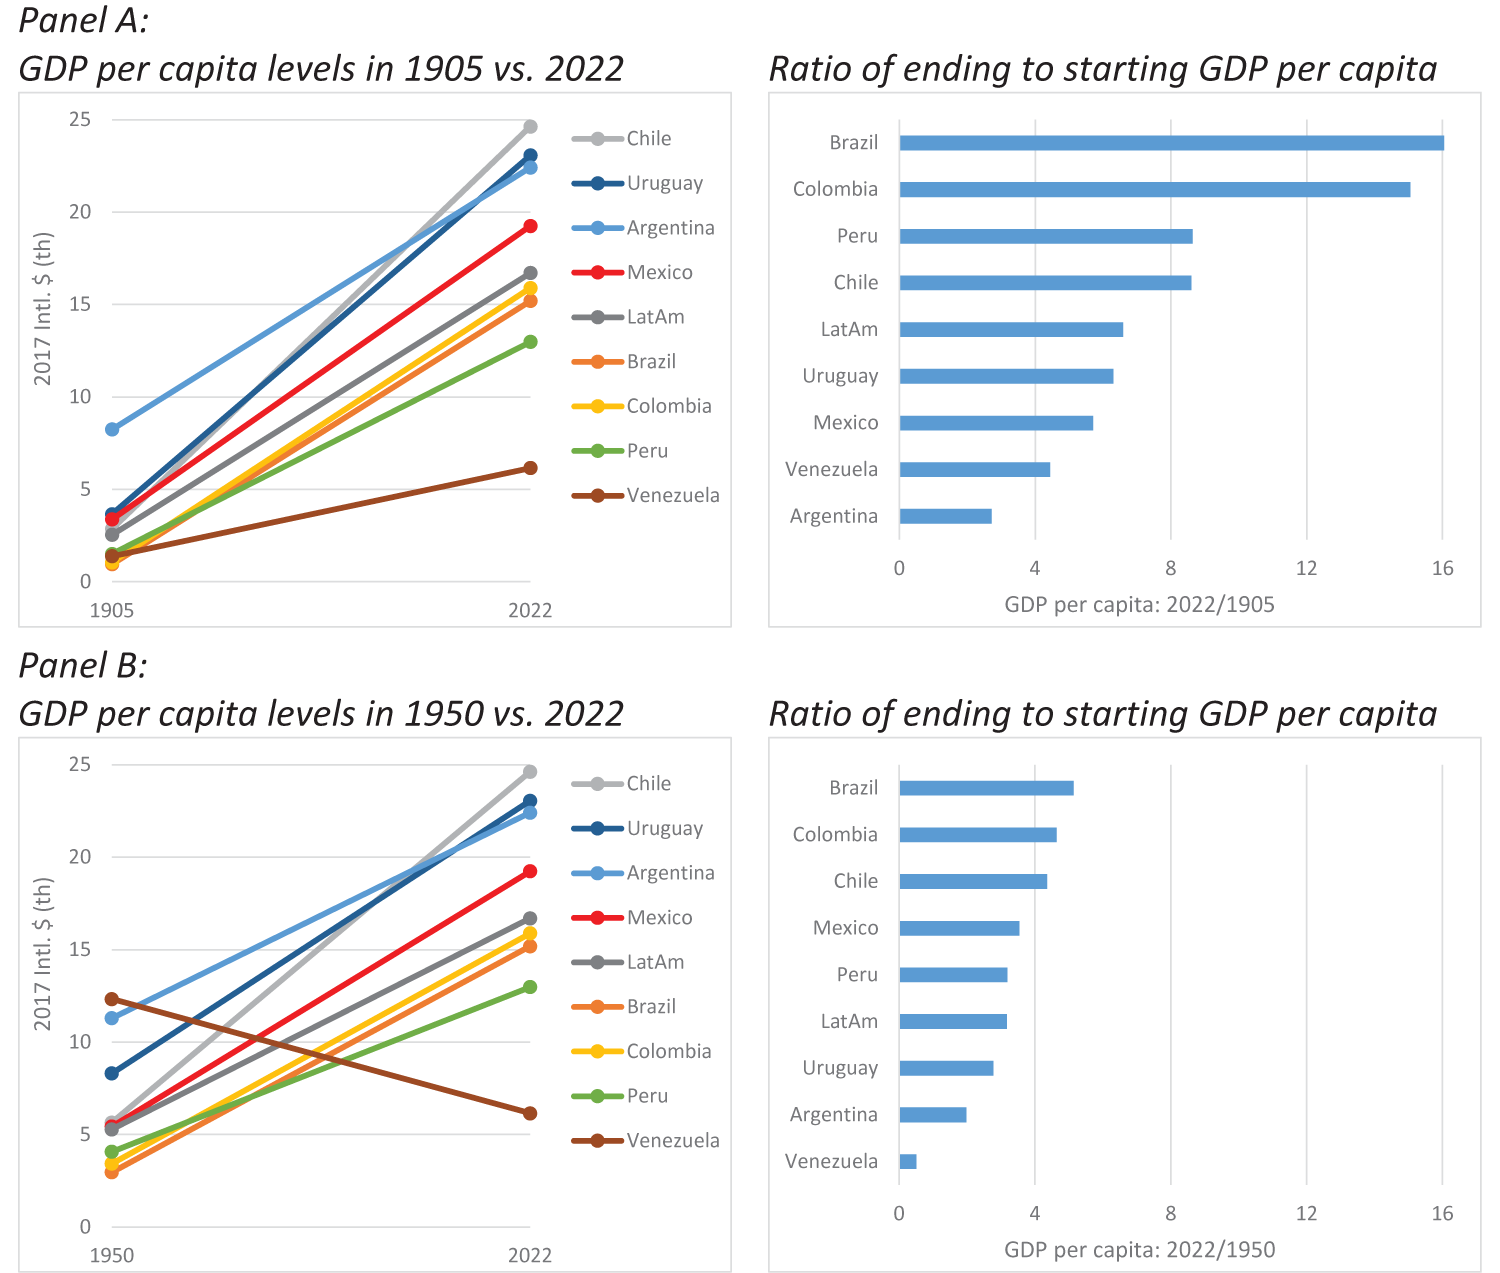
▪ Venezuela is a class of its own. After a remarkable period of expansion in the first half of the 20th century, its economy began to fall apart in the 1960s. Recurrent lost decade episodes since then, plus a significant number of disaster shocks, have left the Venezuelan economy in a state of collapse. In 1905, Venezuela had 55% of the average GDP per capita of the Latin America aggregate; but today it has 37%. Even worse, Venezuela today has roughly the same level of GDP per capita it had in the 1930s. Incredibly, the destruction of nearly a century’s worth of income has occurred in only 7 years. To paraphrase Lenin, Venezuela’s collapse demonstrates that “there are centuries when nothing happens; and there are decades when centuries happen.”
▪ Argentina and Uruguay exemplify the harmful long-run effects of recurring lost decade episodes intertwined with disasters, of which they both have many. Their growth trajectories have been continuously battered by bouts of instability and underperformance. Fortunately for Uruguay, that underperformance was relatively more front-loaded over the past century, whereas for Argentina it has been a continuous story. As a result, Argentina lost its place as the richest among the eight nations, while Uruguay remained in second place (see Figure 12: Panel A). In addition, Argentina today has nearly the same GDP per capita it had 15 years ago, but Uruguay’s has risen by more than 40% over the same period.
▪ Peru and Chile are similar in having spent relatively few years in lost decade episodes, and in having avoided them altogether since the 2000s. As a reflection of that, they have grown the fastest among the eight nations over the past 30 years. For Chile, this has meant moving from fourth to first place in the GDP per capita ranking over the past century; and for Peru, to have grown its income level by a factor of around 9 (see Figure 12: Panel A).
▪ Brazil and Colombia are remarkable stories in different ways. Brazil has had three lost decade episodes, “wasted” nearly 50 years before World War I where GDP per capita remained flat, and is undergoing a lost decade episode since 2013 (exceptional in not being directly related to a disaster). However, it still has managed to grow its level of GDP per capita by a factor of 16 since 1905. This impressive feat is closely followed by Colombia, which managed to grow its GDP per capita by a factor of nearly 15 over the same period. Importantly, Colombia is the only Latin American country that has not had a single rare disaster, nor a single lost decade episode, since at least 1905. In both cases, economic performance weakened since 1950 relative to prior decades, with relatively flatter growth trajectories (see Figure 12: Panel B). Still, together with Chile, they remain the top three Latin American economic performers, both since 1905 and since 1950.
▪ Mexico shares elements with most of the previous stories, and it is not surprising that its experience follows closely the Latin American average. With four disasters and four lost decade episodes, it is in the middle of the number of peer experiences. However, it has underperformed significantly in terms of its ability to increase GDP per capita—only by a factor of less than 6 since 1905, the third worst after Argentina and Venezuela. In recent decades, Mexico’s growth trajectory ranks fourth compared to Latin American peers, but it has not taken off despite significant macroeconomic improvements. Policies since 2018 have eroded microeconomic and institutional foundations for long-run growth—especially those related to capital accumulation, productivity growth, and improvements in human capital. Investment/GDP fell to 19% in 2020, a 40-year low, and is expected to only moderately recover. With COVID-19 and ensuing shocks in 2022, this potential growth erosion makes it unlikely that Mexico will escape the fourth lost decade in its history any time soon.
Summary of Latin America’s economic progress since the early 1900s and 1950s.

Figure 12 Long description
GDP per capita levels in 1905 vs. 2022. The horizontal axis shows 1905 and 2022. The vertical axis label is 2017 Intl. dollar (th), with tick labels 0, 5, 10, 15, 20, 25. Legend labels: Chile, Uruguay, Argentina, Mexico, LatAm, Brazil, Colombia, Peru, Venezuela. Plotted values at 1905 and 2022: Chile: 1905 about 3; 2022 about 25. Uruguay: 1905 about 4; 2022 about 23. Argentina: 1905 about 8; 2022 about 22. Mexico: 1905 about 3; 2022 about 19. LatAm: 1905 about 2; 2022 about 17. Brazil: 1905 about 1; 2022 about 15. Colombia: 1905 about 1; 2022 about 16. Peru: 1905 about 1; 2022 about 13. Venezuela: 1905 about 1; 2022 about 6. Ratio of ending to starting GDP per capita. The vertical axis lists Brazil, Colombia, Peru, Chile, LatAm, Uruguay, Mexico, Venezuela, Argentina. The horizontal axis label is GDP per capita: 2022 over 1905, with tick labels 0, 4, 8, 12, 16. Bar values: Brazil about 16. Colombia about 15. Peru about 9. Chile about 9. LatAm about 7. Uruguay about 7. Mexico about 6. Venezuela about 4. Argentina about 3. GDP per capita levels in 1950 vs. 2022. The horizontal axis shows 1950 and 2022. The vertical axis label is 2017 Intl. dollar (th), with tick labels 0, 5, 10, 15, 20, 25. Legend labels: Chile, Uruguay, Argentina, Mexico, LatAm, Brazil, Colombia, Peru, Venezuela. Plotted values at 1950 and 2022: Chile: 1950 about 5; 2022 about 25. Uruguay: 1950 about 8; 2022 about 23. Argentina: 1950 about 11; 2022 about 22. Mexico: 1950 about 4; 2022 about 19. LatAm: 1950 about 5; 2022 about 17. Brazil: 1950 about 3; 2022 about 15. Colombia: 1950 about 3; 2022 about 16. Peru: 1950 about 4; 2022 about 13. Venezuela: 1950 about 12; 2022 about 6. Ratio of ending to starting GDP per capita. The vertical axis lists Brazil, Colombia, Chile, Mexico, Peru, LatAm, Uruguay, Argentina, Venezuela. The horizontal axis label is GDP per capita: 2022 over 1950, with tick labels 0, 4, 8, 12, 16. Bar values: Brazil about 5. Colombia about 5. Chile about 4. Mexico about 3. Peru about 3. LatAm about 3. Uruguay about 3. Argentina about 2. Venezuela about 0.5.
7. Conclusion
Latin America’s growth path has been a struggle for more than a century, characterized by an inability to translate advantages into sustained growth. In this paper, we have used a century-long historical lens to document how the COVID-19 pandemic did not merely cause a temporary downturn but acted as a rare disaster that solidified a period of prolonged stagnation. At the same time, and to illustrate the long-run challenges, its underperformance relative to other regions, especially Asia, is a challenge given its much stronger starting point in the early 1900s. In this paper, we documented two key ways in which the COVID-19 pandemic aggravated this picture:
Our analysis offers three primary contributions to the literature on growth collapses. First, we quantify the unique synchronicity of the pandemic. While Latin America is familiar with crises, we demonstrate that COVID-19 was the region’s first major macroeconomic hit from a natural phenomenon, surpassing the Great Influenza Pandemic of 1918–20. By documenting the simultaneity and severity of the shock, we show how the lack of regional buffers deepened the 2020 contraction into the largest annual decline on record. First, the pandemic pushed some of the region’s largest economies—Argentina, Mexico, and Peru—into painful macroeconomic rare disasters, Venezuela was already in one and the pandemic deepened it. Tragically, Venezuela’s decline matches the world’s largest macroeconomic GDP disaster in modern history.
Second, we identify and categorize 52 macroeconomic disasters since the late 1800s. By applying the rare disaster framework, we find that while the frequency of these events dropped globally after 1950, Latin America remained uniquely susceptible. Our findings suggest that two-thirds of these disasters are rooted in domestic policy and political debacles rather than external shocks alone. The pandemic compounded years of underperformance by pushing the region into a “lost decade” for many countries. Other countries may be avoiding stagnation, but none did better in the 2010s than in the previous two decades. This proves the confluence of the large shock of the pandemic and its scarring effects with the underlying vulnerabilities of countries that in many cases were built over several decades.
Third, we formalize the aforementioned lost decade as a consequence of historic complementarities. We find that the 2010s episodes in Argentina, Brazil, Mexico, and Venezuela are the result of a confluence: a massive external shock (COVID-19) merging with structural vulnerabilities built over several decades, reflecting the region’s historical tendency to turn deep shocks into enduring stagnation.
Tragically, the scarring effects of this period mean that none of the major economies in the region have returned to their pre-2020 growth trends. While the region faces new global headwinds—including rising interest rates and geopolitical conflict—the historical record suggests that the path to resilience lies in addressing the domestic institutional weaknesses that have made Latin America uniquely prone to these rare disasters. In the end, however, our analyses show that—while affected by outside events—most of Latin America’s rare disasters are attributable to its own making, as they relate to domestic political, economic, or financial debacles.
Acknowledgements
The views expressed herein are those of the authors and do not necessarily reflect the views of their institutions of affiliation. We thank Pedro Aspe, Robert Barro, Alberto Cavallo, Martina Copelman, Egor Gornostay, Jorge Roldos, and seminar participants at PIIE for comments or suggestions; and Ignacio Albe and Sylvia Cesar for superb research assistance.
Appendix
Regions: GDP per capita (2017 Intl$; logs)
Note: Chart uses IMF forecasts for the 2023–28 period. Source:Barro and Ursua macro database, International Monetary Fund (2023).

LATIN AMERICAN COUNTRIES: GDP per capita (2017 Intl$ logs)
Note: Chart uses IMF forecasts for the 2023–28 period (except for Venezuela, which ends in 2023). Source: Barro and Ursua macro database, International Monetary Fund (2023).

Details on the construction of the commodity price index are discussed in Section 3.
We created a weighted index of 31 commodities covering 1900–2020 by merging a historic index through 1960 and the Bloomberg Commodity Index thereafter. For the historic index, price data for the original 24 commodities in Grilli and Yang (Reference Grilli and Yang1988) come from Geronimi et al. (Reference Geronimi, Anani and Taranco2018), supplemented with data from the World Bank’s Pink Sheet, the OECD, UNCTAD, and the St. Louis Federal Reserve for some commodities after 1987. While the merged composite index does not rely on the historic series after 1960, we used observations during overlapping years with the Bloomberg Commodity Index to assess overall compatibility. In the historic index, the weights for each commodity correspond to shares in world exports in 1974–75. All commodity weights are obtained from Ocampo and Parra-Lancourt (Reference Ocampo and Parra-Lancourt2010), with the exception of crude oil, whose share we calculate using data mainly from Comtrade and the U.S. Energy Information Administration. We rebalanced weights to sum to 100 as shown in the tables below in descending order. Figure 6, Panel A, in the main text shows the resulting commodity price index for the whole time period in nominal and real terms (deflated using U.S. CPI).

Full list of COVID-related disasters for all countries available in the WEO IMF database.





 Open access

