1. Introduction
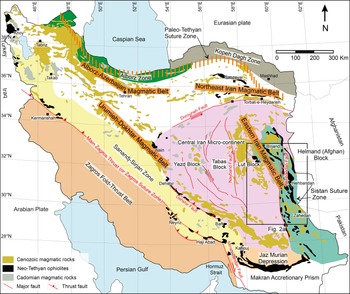
Mesozoic and Cenozoic magmatic rocks are abundant in an elongated region from the west of Tauride–Anatolide to the Iranian Plateau and then to Afghanistan, Pakistan and Tibet in the east. The Iranian Plateau includes several continental fragments within the convergence zone of two rigid plates, the Arabian plate in the SW and the Eurasian plate in the NE (e.g. Hempton, Reference Hempton1978; Berberian Reference Berberian2014; Khodaverdian et al. Reference Khodaverdian, Zafarani and Rahimian2015; see Fig. 1). The Iranian Plateau represents the second largest collisional system in elevation and size after the Tibetan Plateau (Paknia et al. Reference Paknia, Ballato, Heidarzadeh, Cifelli, Hassanzadeh, Vezzoli, Mirzaie Ataabadi, Ghassemi and Mattei2021). During the Cenozoic, extensive magmatism occurred throughout the Iranian Plateau. This tremendous volume of magmatism is attributed to the NE-dipping subduction of the Neo-Tethyan oceanic lithosphere beneath the Iranian Plateau (e.g. Verdel et al. Reference Verdel, Wernicke, Hassanzadeh and Guest2011; Chiu et al. Reference Chiu, Chung, Zarrinkoub, Mohammadi, Khatib and Iizuka2013; Zhang et al. Reference Zhang, Xiao, Ji, Majidifard, Rezaeian, Talebian, Xiang, Chen, Wan, Ao and Esmaeili2018). Cenozoic magmatism is mainly preserved in four different magmatic belts (Fig. 1): (a) the Urumieh–Dokhtar Magmatic Belt (UDMB), (b) the Alborz–Azerbaijan Magmatic Belt (AAMB), (c) the Northeast Iran Magmatic Belt (NEIMB) and (d) the Eastern Iran Magmatic Belt (EIMB). The UDMB is proposed to represent an Andean-type magmatic belt formed due to the subduction of Neo-Tethyan oceanic lithosphere beneath the Iranian Plateau (e.g. Omrani et al. Reference Omrani, Agard, Whitechurch, Benoit, Prouteau and Jolivet2008; Hassanzadeh & Wernicke Reference Hassanzadeh and Wernicke2016). However, rear-arc extensional magmatism was recently suggested to have formed the AAMB and NEIMB, caused by the slab roll-back of the Neo-Tethyan oceanic lithosphere (e.g. Sepidbar et al. Reference Sepidbar, Shafaii Moghadam, Zhang, Li, Ma, Stern and Lin2019; Shafaii Moghadam et al. Reference Shafaii Moghadam, Li, Li, Stern, Levresse, Santos, Lopez Martinez, Ducea, Ghorbani and Hassannezhad2020).
A simplified geological map of Iran illustrates the distribution of four main magmatic belts: the Urumieh–Dokhtar, Alborz–Azerbaijan, Northeast Iran and Eastern Iran magmatic belts. Cadomian and Cenozoic magmatic rocks and Cretaceous Neo-Tethyan ophiolites are also shown (modified after Shafaii Moghadam et al. Reference Shafaii Moghadam, Li, Li, Stern, Levresse, Santos, Lopez Martinez, Ducea, Ghorbani and Hassannezhad2020). The Palaeo-Tethyan suture zone is from Rossetti et al. (Reference Rossetti, Monié, Nasrabady, Theye, Lucci and Saadat2017). In this map, the term Iranian Plateau refers to an area between the Kopeh Dagh and Alborz Mountains in the north, the Zagros Fold-Thrust Belt in the west, the Persian Gulf and Hormuz Strait in the south and the Eastern Iranian Mountains in the east (Khodaverdian et al. Reference Khodaverdian, Zafarani and Rahimian2015).

The Cenozoic EIMB was built by various magmatic pulses, mainly during the Eocene to Oligocene, which are widespread in a roughly NW–SE-trending elongated belt (Fig. 1). It consists of a Palaeocene to Quaternary volcanic sequence (up to 2000 m thickness), which is intruded by numerous intermediate to felsic intrusions. Although the Eocene–Oligocene EIMB magmatism has been previously studied, there is still ongoing debate about source and formation mechanisms. For example, Verdel et al. (Reference Verdel, Wernicke, Hassanzadeh and Guest2011) suggested a subducting slab roll-back mechanism and an extensional tectonic setting to form the Eocene–Oligocene EIMB magmatic rocks. On the other hand, after the collision between the Lut and Afghan blocks, a post-collisional tectonic setting has been proposed to generate the EIMB igneous rocks (e.g. Pang et al. Reference Pang, Chung, Zarrinkoub, Khatib, Mohammadi, Chiu, Chu, Lee and Lo2013; Sepidbar et al. Reference Sepidbar, Mirnejad, Ma and Moghadam2018; Omidianfar et al. Reference Omidianfar, Monsef, Rahgoshay, Zheng and Cousens2020). Alternatively, some studies attribute the EIMB magmatic rocks to an Andean-type active continental margin due to subduction of the Sistan Ocean underneath the Lut block (e.g. Arjmandzadeh et al. Reference Arjmandzadeh, Karimpour, Mazaheri, Santos, Medina and Homam2011; Beydokhti et al. Reference Beydokhti, Karimpour, Mazaheri, Santos and Klötzli2015; Samiee et al. Reference Samiee, Karimpour, Ghaderi, Haidarian Shahri, Klöetzli and Santos2016; Nadermezerji et al. Reference Nadermezerji, Karimpour, Malekzadeh Shafaroudi, Francisco Santos, Mathur and Ribeiro2018).
We think there are ongoing challenges concerning mantle source compositions and magmatic evolution involved in forming the voluminous Eocene–Oligocene magmatism in eastern Iran. A further question is which geodynamic triggers could best explain the occurrence of this magmatic sequence. Herein, we report new field observations, zircon U–Pb ages and whole-rock major, trace and Sr–Nd isotope data for the intrusive rocks (Hanar intrusion) and volcanic sequences from the region south of Birjand. These data were compiled with previous geochemical data from the EIMB magmatic rocks to resolve ambiguities related to Eocene–Oligocene magmatism in eastern Iran.
2. Regional geology
The Cadomian crust of Iran (Ediacaran–Cambrian; see Fig. 1) is interpreted to have been produced by arc magmatism due to south-dipping subduction of proto-Tethys oceanic lithosphere beneath the northern margin of Gondwana (e.g. Rossetti et al. Reference Rossetti, Nozaem, Lucci, Vignaroli, Gerdes, Nasrabadi and Theye2015; Shafaii Moghadam et al. Reference Shafaii Moghadam, Khademi, Hu, Stern, Santos and Wu2015 a). During the Permian to the Late Triassic, Cimmerian terranes, including the Iranian Plateau, drifted from Gondwana by rifting the Neo-Tethys Ocean behind it (e.g. Agard et al. Reference Agard, Omrani, Jolivet, Whitechurch, Vrielynck, Spakman, Monié, Meyer and Wortel2011; Vergés et al. Reference Vergés, Saura, Casciello, Fernàndez, Villaseñor, Jiménez-Munt and García-Castellanos2011). TheIranian Plateau was accreted to Eurasia during the Late Triassic to Early Jurassic, leading to the formation of the Palaeo-Tethyan suture zone (e.g. Stampfli et al. Reference Stampfli, Marcoux and Baud1991; Zanchetta et al. Reference Zanchetta, Berra, Zanchi, Bergomi, Caridroit, Nicora and Heidarzadeh2013; Rossetti et al. Reference Rossetti, Monié, Nasrabady, Theye, Lucci and Saadat2017; see Fig. 1). Subsequently, northeastward subduction of the Neo-Tethys oceanic lithosphere beneath the Iranian Plateau was initiated in the Cretaceous and continued to the Eocene–Oligocene, leading to mantle metasomatism beneath the overriding plate (e.g. Shafaii Moghadam & Stern, Reference Shafaii Moghadam and Stern2021; Monsef et al. Reference Monsef, Zhang, Shabanian, Le Roux and Rahgoshay2022). Neo-Tethyan ophiolites of Iran determine the location of ancient suture zones of the Iran–Cimmerian continental blocks (e.g. Khoy, Neyriz, Haji Abad, Birjand, Nain–Baft and Sabzevar ophiolites) (Shafaii Moghadam et al. Reference Shafaii Moghadam, Whitechurch, Rahgoshay and Monsef2009, Reference Shafaii Moghadam, Khedr, Arai, Stern, Gorbani, Tamura and Ottley2015 b; Monsef et al. Reference Monsef, Rahgoshay, Mohajel and Moghadam2010, Reference Monsef, Monsef and Rahgoshay2014, Reference Monsef, Monsef, Mata, Zhang, Pirouz, Rezaeian, Esmaeili and Xiao2018; Saccani et al. Reference Saccani, Delavari, Beccaluva and Amini2010; Zarrinkoub et al. Reference Zarrinkoub, Pang, Chung, Khatib, Mohammadi, Chiu and Lee2012; see Fig. 1).
Eastern Iran is a geologically complex region and includes the Lut block and Sistan suture zone (Fig. 1). In the eastern part of the Central Iran micro-continent, the N–S-trending Lut block is bounded to the east by the Nehbandan Fault and Sistan suture zone, to the north by the Dorouneh Fault, to the west by the Nayband Fault, and to the south by the Jaz Murian depression. The Lut block consists of Cadomian, Mesozoic and Cenozoic magmatic rocks. The Sistan suture zone comprises Cretaceous flysch deposits (e.g. Babazadeh & De Wever, Reference Babazadeh and De Wever2004; Bayet-Gol et al. Reference Bayet-Gol, Monaco, Jalili and Mahmuudy-Gharaie2016), high-pressure metamorphic rocks (e.g. Fotoohi Rad et al. Reference Fotoohi Rad, Droop, Amini and Moazzen2005; Bröcker et al. Reference Bröcker, Fotoohi Rad, Burgess, Theunissen, Paderin, Rodionov and Salimi2013, Reference Bröcker, Hövelkröger, Fotoohi Rad, Berndt, Scherer, Kurzawa and Moslempour2022) and ophiolites (e.g. Nehbandan and Birjand ophiolites; Saccani et al. Reference Saccani, Delavari, Beccaluva and Amini2010; Zarrinkoub et al. Reference Zarrinkoub, Pang, Chung, Khatib, Mohammadi, Chiu and Lee2012). The Sistan ophiolites represent the oceanic lithosphere, which existed between the Lut and Afghan blocks during the Late Mesozoic (Camp & Griffis, Reference Camp and Griffis1982; Tirrul et al. Reference Tirrul, Bell, Griffis and Camp1983). The age of the Sistan ocean is still debated, although radiolarites associated with ophiolitic lavas have Aptian–Albian ages (Babazadeh & De Wever, Reference Babazadeh and De Wever2004). Furthermore, gabbroic rocks from the Birjand ophiolites yielded zircon U–Pb ages of 113 Ma to 104 Ma (Zarrinkoub et al. Reference Zarrinkoub, Pang, Chung, Khatib, Mohammadi, Chiu and Lee2012; Bröcker et al. Reference Bröcker, Hövelkröger, Fotoohi Rad, Berndt, Scherer, Kurzawa and Moslempour2022). The closure time of the Sistan Ocean and the Lut–Afghan continental collision is controversial and considered to be Late Cretaceous (Babazadeh & De Wever, Reference Babazadeh and De Wever2004; Saccani et al. Reference Saccani, Delavari, Beccaluva and Amini2010; Zarrinkoub et al. Reference Zarrinkoub, Pang, Chung, Khatib, Mohammadi, Chiu and Lee2012; Angiboust et al. Reference Angiboust, Agard, De Hoog, Omrani and Plunder2013), Middle Eocene (Camp & Griffis, Reference Camp and Griffis1982; Tirrul et al. Reference Tirrul, Bell, Griffis and Camp1983) or Oligocene – Middle Miocene (Şengör & Natal’in, Reference Şengör and Natal’in1996). In addition, based on the Rb–Sr dating of high-pressure metamorphic rocks (eclogites and blueschists) and zircon U–Pb ages of metafelsic rocks from the Birjand–Nehbandan ophiolites, Bröcker et al. (Reference Bröcker, Fotoohi Rad, Burgess, Theunissen, Paderin, Rodionov and Salimi2013) suggested a Late Cretaceous age for the closing of the Sistan Ocean (89−83 Ma).
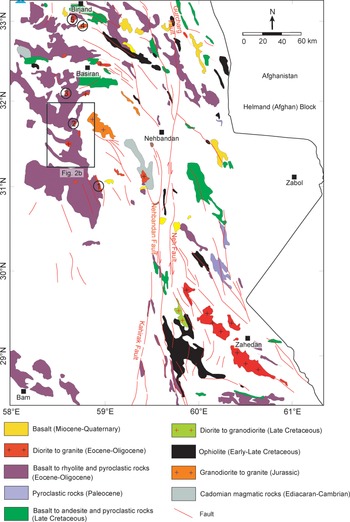
The EIMB comprises a large area, including the Lut block and Sistan suture zone (Figs 1, 2). Magmatic rocks within the EIMB include rare Cadomian felsic lavas and intrusions, Middle Jurassic felsic intrusive rocks, Late Cretaceous intermediate to felsic intrusive rocks and Late Cretaceous mafic to intermediate lavas and pyroclastic rocks. Palaeocene pyroclastic units cover the Late Cretaceous rocks. The Eocene–Oligocene magmatic rocks include mafic to felsic lava flows, pyroclastic rocks and intermediate to felsic intrusions. These rocks form a widespread and thick magmatic sequence in the EIMB. Miocene to Quaternary mafic lavas are the latest magmatic rocks within the EIMB (Fig. 2).
Simplified magmatic map of eastern Iran (modified after Emami et al. Reference Emami, Mir Mohammad Sadeghi and Omrani1993). Circles with numbers indicate the Eocene–Oligocene intrusions of the EIMB used for comparison. Numbers correspond to (1) Mahoor intrusion (31.9 ± 0.2 Ma; Beydokhti et al. Reference Beydokhti, Karimpour, Mazaheri, Santos and Klötzli2015); (2) Chah-Shaljami intrusion (33.5 ± 1 Ma; Arjmandzadeh et al. Reference Arjmandzadeh, Karimpour, Mazaheri, Santos, Medina and Homam2011); (3) Koudakan intrusion (37.9 ± 0.8 to 41.7 ± 3.4 Ma; Omidianfar et al. Reference Omidianfar, Monsef, Rahgoshay, Zheng and Cousens2020); (4) Khunik intrusion (38 ± 1 Ma; Samiee et al. Reference Samiee, Karimpour, Ghaderi, Haidarian Shahri, Klöetzli and Santos2016); and (5) Shah-Soltan Ali intrusion (38.3 ± 0.5 Ma; Nadermezerji et al. Reference Nadermezerji, Karimpour, Malekzadeh Shafaroudi, Francisco Santos, Mathur and Ribeiro2018).

3. Geology of the study area
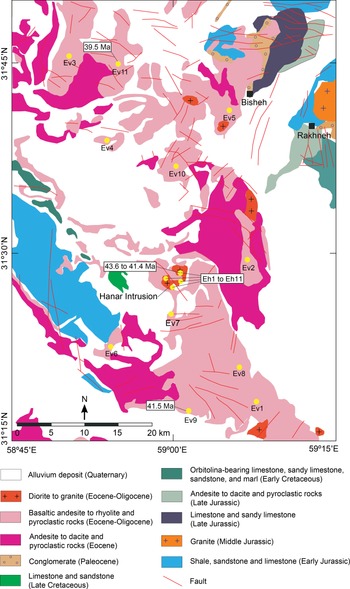
Our samples came from the region south of Birjand, covering an area of ∼3000 km2 (Fig. 3). The oldest rocks are Lower Jurassic shales, sandstones and limestones (Shemshak Fm.), intruded by Middle Jurassic granites. Upper Jurassic andesitic to dacitic lavas and pyroclastic rocks rest atop the Upper Jurassic limestones and sandy limestones. The Lower Palaeocene conglomerates stratigraphically cover the Lower to Upper Cretaceous flysch and turbidites. The Eocene to Oligocene extrusive and intrusive rocks are abundant, consisting of basaltic andesite to rhyolitic lava flows and pyroclastic rocks intruded by dioritic to granitic intrusions (Fig. 3).
Geological map of the region south of Birjand, showing the distribution of extrusive rocks and Hanar intrusive rocks (modified after Sahandi, Reference Sahandi1992). Yellow circles indicate the geographical locations of the newly analysed samples.

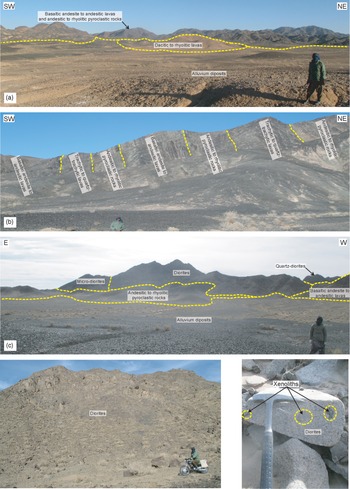
Field observations indicate that the basaltic andesitic to rhyolitic lava flows have aphanitic to porphyritic textures and locally exhibit hydrothermal alteration, especially along fractures. Moreover, lava flows are associated with andesitic to rhyolitic tuffs and ignimbrites. The rhythmic association of lava flows and pyroclastic rocks suggests that the magmatic activities and eruptions are related to stratovolcanoes (Fig. 4a, b). In addition, several stock-like intrusive bodies (e.g. the Hanar pluton) are invaded into the Eocene–Oligocene volcanic rocks. The Hanar intrusive rocks are predominantly composed of diorites, quartz–diorites and granodiorites, although granites, monzodiorites and quartz–monzodiorites are rarely present (Fig. 4c, d). At contact with volcanic host rocks, the intrusive rocks are fine-grained (micro-diorite; Fig. 4c). Basaltic andesite to andesitic xenoliths (up to a few centimetres diameter) are locally found within the intrusive rocks (Fig. 4e).
Field photographs from the magmatic rocks of the region south of Birjand. (a) An outcrop of basaltic andesite to rhyolitic lava flows and pyroclastic rocks. (b) A sequence of basaltic andesite to rhyolitic lavas and pyroclastic rocks. (c) An overview of dioritic and quartz–dioritic intrusive rocks injected within the lavas and pyroclastic rocks. (d) A close-up view of the Hanar dioritic intrusive rocks. (e) Xenoliths within dioritic rocks. Yellow dashed lines show lithological boundaries.

4. Analytical techniques
We collected 180 samples of both intrusive (the Hanar pluton) and extrusive rocks from the region south of Birjand. The locations of representative magmatic rocks for geochronological and geochemical analyses are shown in Figure 2b. Sample locations, rock type and analytical methods are listed in the online Supplementary Material Table S1. Two samples from the Hanar pluton and two from the volcanic lavas were analysed for zircon U–Pb ages and trace elements by laser ablation – inductively coupled plasma – mass spectrometry (LA-ICP-MS; see online Supplementary Material Tables S2, S3). Based on petrographic characteristics, 22 of the freshest samples were analysed for whole-rock major and trace elements by X-ray fluorescence (XRF) and inductively coupled plasma – mass spectrometry (ICP-MS; see online Supplementary Material Table S4). In addition, five samples from the Hanar pluton and two from the volcanic lavas were selected for whole-rock Sr and Nd isotope analyses by thermal ionization mass spectrometry (TIMS; see online Supplementary Material Table S5). Analytical details are presented in the online Supplementary Material.
5. Results
5.a. Sample description
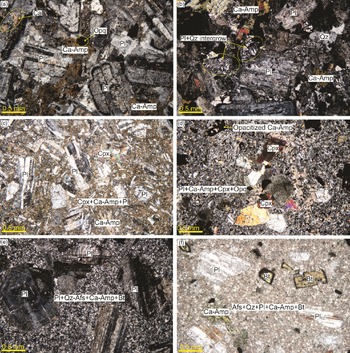
Intrusive rocks are mainly diorites, micro-diorites, quartz–diorites and granodiorites, although monzodiorites, quartz–monzodiorites and granites are also present. Diorites show granular texture and consist of subhedral to anhedral plagioclase and anhedral calcic-amphibole as significant phases. Fe–Ti oxides occur as an accessory phase (Fig. 5a). Optically (under the cross-polarized light), plagioclases have oligoclase to andesine composition. This has been inferred based on the extinction angles of the ‘albite twins’ of plagioclases and using the Michel–Levy technique (see Kerr, Reference Kerr1959, pp. 294–5). The presence of Oligoclase–andesine plagioclase, calcic-amphibole (instead of clinopyroxene) and the higher amounts of SiO2 (54.97 to 59.97 wt. %) than gabbroic rocks confirm these rocks have an intermediate dioritic composition (see Figs 5a and (further below) 8). Micro-diorites are porphyritic and contain subhedral plagioclase, anhedral calcic-amphibole and subhedral to anhedral clinopyroxene phenocrysts in a fine-grained groundmass of plagioclase, calcic-amphibole, quartz and Fe–Ti oxides (online Supplementary Material Fig. S1a, b). Quartz–diorites have granular and myrmekitic textures (Fig. 5b), with moderately altered plagioclase and quartz as significant phases and calcic-amphibole as a minor constituent. Monzodiorites and quartz–monzodiorites have a granular texture. They are composed mainly of plagioclase and alkali feldspar and a variable amount of quartz (<5 % in monzodiorites, to >5 but <10 % in quartz–monzodiorites). The minor phases are calcic-amphibole, biotite and Fe–Ti oxides (online Supplementary Material Fig. S1c). Granodiorites and granites have a granular texture with anhedral quartz, subhedral to anhedral plagioclase and anhedral alkali feldspar as major components (alkali feldspar > plagioclase in granites) associated with calcic-amphibole and biotite as minor constituents (online Supplementary Material Fig. S1d).
Photomicrographs from the magmatic rocks of the region south of Birjand. (a) Diorites with a granular texture, consisting of plagioclase and calcic-amphibole. (b) Quartz–diorites with granular and myrmekite texture (Pl–Qz intergrowth), including plagioclase, quartz and calcic-amphibole. (c) Basaltic andesite with porphyritic texture, consisting of plagioclase and clinopyroxene as phenocrysts in a fine-grained groundmass of clinopyroxene, calcic-amphibole and plagioclase. (d) Basaltic andesites with glomeroporphyritic texture, containing clinopyroxene and opacitized calcic-amphibole phenocrysts within a groundmass of plagioclase laths, calcic-amphibole, clinopyroxene and Fe–Ti oxides. (e) Dacites with porphyritic texture, outlining plagioclase phenocrysts in a fine-grained groundmass of alkali feldspar, plagioclase, quartz, calcic-amphibole and biotite. (f) Rhyodacites with porphyritic texture, highlighting plagioclase, calcic-amphibole and opacitized biotite phenocrysts within a groundmass of alkali feldspar, plagioclase, quartz, calcic-amphibole and biotite. Abbreviations; Pl: plagioclase; Afs: alkali feldspar; Qz: quartz; Cpx: clinopyroxene; Ca-Amp: calcic-amphibole; Bi: biotite; Cal: calcite; Opq: opaque minerals (Whitney & Evans, Reference Whitney and Evans2010). Scale bars are 0.5 mm across. Photos were taken using crossed-polarized light (XPL).

Volcanic rocks include basaltic andesites, andesites, trachyandesites, quartz–trachyandesites, trachytes, quartz–trachytes, dacites, rhyodacites and rhyolites. They mostly show porphyritic and glomeroporphyritic textures with micro- to crypto-crystalline and rarely glassy groundmass. Basaltic andesites have subhedral plagioclase (up to 20 %) and subhedral to anhedral clinopyroxene (up to 5 %) phenocrysts. The groundmass of these rocks contains clinopyroxene, calcic-amphibole, plagioclase laths and Fe–Ti oxides (Fig. 5c, d). Andesites include euhedral to subhedral plagioclase (up to 20 %), euhedral to anhedral calcic-amphibole (up to 20 %) phenocrysts and microphenocrysts, and a groundmass consisting of plagioclase laths, calcic-amphibole and Fe–Ti oxides (online Supplementary Material Fig. S2a, b). Some plagioclase phenocrysts show sieve texture, indicating rapid decompression during magma ascent or magma mixing. Trachyandesites and quartz–trachyandesites contain calcic-amphibole (up to 10 %) and plagioclase (up to 3 %) phenocrysts in a groundmass of plagioclase, alkali feldspar, calcic-amphibole, quartz and Fe–Ti oxides (online Supplementary Material Fig. S2c). Trachytes and quartz–trachytes include alkali feldspar (up to 10 %), plagioclase (up to 5 %) and biotite (up to 5 %) phenocrysts in a groundmass of plagioclase and alkali feldspar microlites, biotite, quartz and Fe–Ti oxides. Dacites, rhyodacites and rhyolites consist of variable amounts of plagioclase (up to 20 %), alkali feldspar (up to 10 %), quartz (up to 10 %), calcic-amphibole (up to 5 %) and biotite (up to 3 %) phenocrysts in a cryptocrystalline groundmass. Fe–Ti oxides are accessory minerals (Fig. 5e, f and online Supplementary Material Fig. S2d).
5.b. Zircon U–Pb geochronology and trace element geochemistry
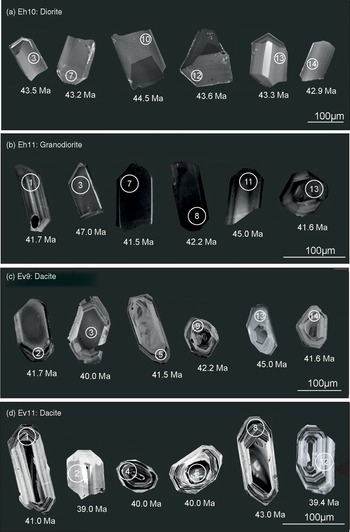
Four samples were selected for zircon U–Pb dating (online Supplementary Material Table S2), including one diorite (sample Eh10), one granodiorite (sample Eh11) and two dacites (samples Ev9 and Ev11). Also, zircon grains from these samples were further analysed for trace elements (online Supplementary Material Table S3). In cathodoluminescence (CL) images (Fig. 6), zircon grains are euhedral to subhedral and prismatic, with lengths ranging from 50 to 250 μm. While most of the investigated zircon crystals in Fig. 6 exhibit oscillatory zoning, some zircon grains have complex internal textures of convoluted zoning and unzoned rims/domains. In chondrite-normalized rare earth element (REE) patterns, zircon grains display depletion in the light rare earth elements (LREEs) relative to the heavy rare earth elements (HREEs), negative Eu and positive Ce anomalies (online Supplementary Material Fig. S3). Moreover, the Th/U ratio of the analysed zircon grains ranges from 0.6 to 2.3, which is higher than those commonly found in metamorphic rocks (<0.1) (e.g. Rubatto et al. Reference Rubatto, Williams and Buick2001). Finally, all trace element features support the interpretation that the zircons crystallized from magmatic liquids (Hoskin, Reference Hoskin1998; Wu & Zheng, Reference Wu and Zheng2004; Corfu et al. Reference Corfu, Hanchar, Hoskin and Kinny2003).
Cathodoluminescence (CL) images for zircons from the magmatic rocks of the region south of Birjand. Circles indicate the position of laser spots for zircon U–Pb analyses. Analytical numbers and 206Pb/238U ages are also shown. Scale bars are 100 μm across.

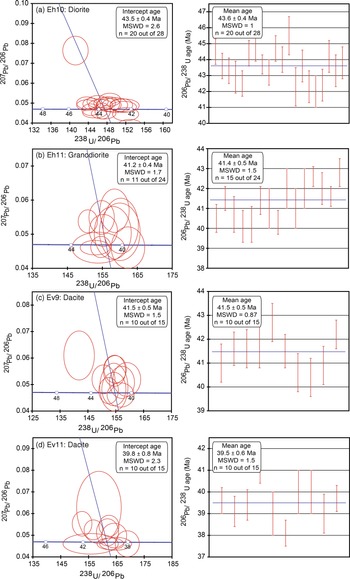
A total of 28 U–Pb analyses were performed on diorite sample Eh10. On a Tera–Wasserburg plot (207Pb/206Pb vs 238U/206Pb; see Fig. 7a), 20 analyses define an intercept age of 43.5 ± 0.4 Ma (MSWD = 2.6). The weighted mean age of zircons is 43.6 ± 0.4 Ma (MSWD = 1; n = 20). This weighted mean age is interpreted as the crystallization age of the diorite. Two zircon grains yielded older 206Pb/238U ages 114 Ma and 61 Ma, representing xenocrysts inherited from older country rocks.
U–Pb Tera–Wasserburg diagrams of 238U/206Pb vs 207Pb/206Pb and weighted mean ages of 206Pb/238U for zircons from the magmatic rocks of the region south of Birjand. Data-point error ellipses display 1σ uncertainties. Intercept ages are based on a mixing trend with a common Pb composition (Stacey & Kramers, Reference Stacey and Kramers1975) anchored at 207Pb/206Pb values of 0.838, representing t = 40 Ma. The number of analysed zircons and those used for making the Tera–Wasserburg diagrams are reported in all plots. All red circles and bars are data used for calculating the intercept and weighted mean ages.

A total of 24 zircon grains were analysed from a granodiorite sample Eh11. In a Tera–Wasserburg diagram (Fig. 7b), 11 grains have an intercept age of 41.2 ± 0.4 Ma (MSWD = 1.7). Zircon grains yielded a weighted mean age of 41.4 ± 0.5 Ma (MSWD = 1.5; n = 15), indicating the granodiorite’s crystallization age. Five zircons show older 206Pb/238U ages of 164 Ma, 108 Ma, 78 Ma, 70 Ma and 56 Ma, which are inherited.
A total of 15 analyses were carried out on a dacite sample Ev9. On a Tera–Wasserburg plot (Fig. 7c), ten zircon grains display an intercept age of 41.5 ± 0.5 Ma (MSWD = 1.5) with an identical weighted mean age of 41.5 ± 0.5 Ma (MSWD = 0.87; n = 10). This age is interpreted as the age of dacite crystallization.
Finally, 15 zircon grains were analysed from a dacite sample Ev11. In a Tera–Wasserburg diagram (Fig. 7d), ten analysed zircons gave an intercept age of 39.8 ± 0.8 Ma (MSWD = 2.3) with a weighted mean age of 39.5 ± 0.6 Ma (MSWD = 1.5; n = 10). This weighted mean age is interpreted as the crystallization age of the dacite. The data point with the oldest 206Pb/238U age of 439 Ma represents a xenocryst.
5.c. Whole-rock major and trace element geochemistry
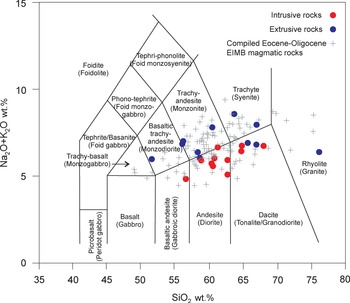
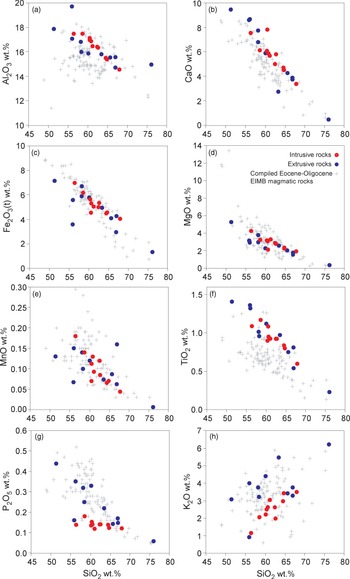
Whole-rock major and trace element analyses of the intrusive and extrusive rocks are reported in the online Supplementary Material Table S4. In the analysed samples, loss on ignition (LOI) values are low and range from 1.11 to 2.98 %. Because the LOI abundances are low, major elements have not been recalculated to 100 % volatile-free. In the total alkalis (Na2O + K2O) vs silica (SiO2) classification diagram (TAS), the extrusive rocks fall in the basaltic trachyandesite, trachyandesite, andesite, trachyte, dacite and rhyolite domains (Fig. 8). In addition, the intrusive samples mainly plot in the fields of diorite and granodiorite (Fig. 7). In the Harker variation diagrams (Fig. 8), the intrusive samples reveal trends expected for magmatic fractionation of Ca-rich plagioclase, clinopyroxene, calcic-amphibole (hornblende), Fe–Ti oxide and apatite. The similarity in trends between the extrusive and intrusive rocks reveals their co-genetic nature and probable crystallization from the same parental magmas (Fig. 9). In the K2O vs SiO2 diagram (Fig. 10a), the intrusive and extrusive samples mostly trend to the high-K calc-alkaline and shoshonitic series. Furthermore, in the Na2O + K2O – CaO vs SiO2 diagram, the samples predominantly indicate calcic to calcic-alkalic affinities (Fig. 10b). The A/CNK (molar Al2O3/(CaO + Na2O + K2O) vs A/NK (molar Al2O3/(Na2O + K2O) diagram shows that the magmatic rocks belong to metaluminous and I-type granitoids (Fig. 10c). The presence of biotites, hornblendes and Fe–Ti oxides in these samples further attests to the I-type geochemical signature (Chappell & White, Reference Chappell and White2001). The FeOtotal/(FeOtotal + MgO) vs SiO2 diagram (Fig. 10d) displays a magnesian characteristic for these rocks similar to Cordilleran I-type granitoids.
Classification diagram of Na2O + K2O (wt %) vs SiO2 (wt %) (Middlemost, Reference Middlemost1994) for the EIMB magmatic rocks. All oxides are calculated as anhydrous. Data sources for the compiled Eocene–Oligocene EIMB magmatic rocks are: Mahoor intrusion, Beydokhti et al. (Reference Beydokhti, Karimpour, Mazaheri, Santos and Klötzli2015); Chah-Shaljami intrusion, Arjmandzadeh et al. (Reference Arjmandzadeh, Karimpour, Mazaheri, Santos, Medina and Homam2011); Koudakan intrusion, Omidianfar et al. (Reference Omidianfar, Monsef, Rahgoshay, Zheng and Cousens2020); Khunik intrusion, Samiee et al. (Reference Samiee, Karimpour, Ghaderi, Haidarian Shahri, Klöetzli and Santos2016); Shah-Soltan Ali intrusion, Nadermezerji et al. (Reference Nadermezerji, Karimpour, Malekzadeh Shafaroudi, Francisco Santos, Mathur and Ribeiro2018); and extrusive rocks, Pang et al. (Reference Pang, Chung, Zarrinkoub, Khatib, Mohammadi, Chiu, Chu, Lee and Lo2013).

Harker variation diagrams of major element oxides (wt %) against SiO2 (wt %) for the EIMB magmatic rocks. All oxides are calculated as anhydrous. Data sources for the compiled Eocene–Oligocene EIMB igneous rocks are listed in Figure 8.

Geochemical discrimination diagrams for the EIMB magmatic rocks. (a) A plot of K2O (wt %) vs SiO2 (wt %) (Peccerillo & Taylor, Reference Peccerillo and Taylor1976). (b) A plot of Na2O + K2O – CaO vs SiO2 (wt %) (Frost et al. Reference Frost, Barnes, Collins, Arculus, Ellis and Frost2001). (c) A plot of A/CNK (molar Al2O3/(CaO + Na2O + K2O)) vs A/NK (molar Al2O3/(Na2O + K2O)) (Shand, Reference Shand1948). (d) A plot of FeOtotal/(FeOtotal + MgO) vs SiO2 (wt %) (Frost et al. Reference Frost, Barnes, Collins, Arculus, Ellis and Frost2001). All oxides are calculated as anhydrous. Data sources for the compiled Eocene–Oligocene EIMB igneous rocks are listed in Figure 8.

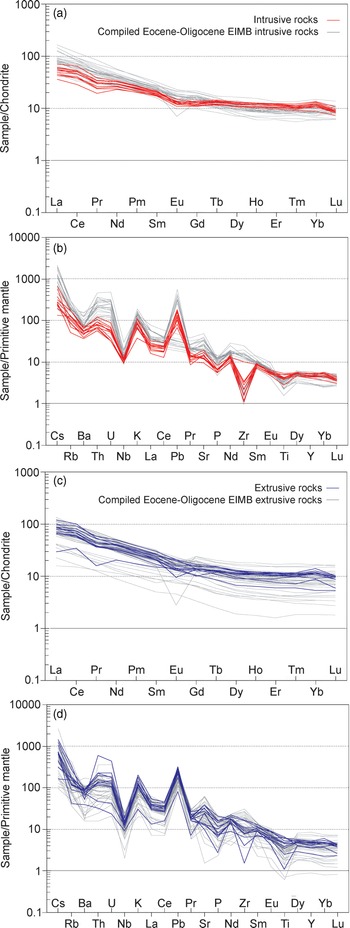
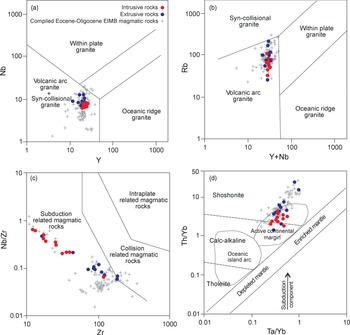
In chondrite-normalized REEs diagrams (Fig. 11a, c), the magmatic rocks exhibit slight to moderate LREE enrichment relative to HREE. LaN/YbN varies from 2.75 to 6.45 in the intrusive rocks and 2.53 to 16.55 in the extrusive rocks. Most REE patterns show negative anomalies in Eu (Eu/Eu* = 0.56–0.98), indicating moderate plagioclase removal (Henderson, Reference Henderson1983). In primitive-mantle-normalized multi-element diagrams (Fig. 11b, d), the intrusive and extrusive rocks are characterized by enrichment in large-ion lithophile elements (LILEs) such as Cs, Rb, Ba, K, Sr and Pb as well as Th and U, and depletion in high-field-strength elements (HFSEs) such as Nb, Zr and Ti. In the magmatic rocks, the NbN/LaN ratios range from 0.31 to 0.71, and the ThN/LaN ratios vary from 1.41 to 11.19. In the Nb vs Y diagram (Fig. 12a), the intrusive and extrusive samples plot within the volcanic arc granite plus syn-collisional granite domain. The Rb vs Y + Nb diagram further attests to these being volcanic arc granite (Fig. 12b). Likewise, in the Nb/Zr vs Zr diagram (Fig. 12c), the intrusive and extrusive rocks indicate subduction-related rather than collisional or intraplate settings. Moreover, in the Th/Yb vs Ta/Yb diagram (Fig. 12d), the magmatic rocks have high Th/Yb ratios, similar to those that erupted in active continental margins.
Chondrite-normalized REE and primitive-mantle-normalized multi-element diagrams for the EIMB magmatic rocks. Normalizing values for chondrite and primitive mantle are taken from Boynton (Reference Boynton1984) and Sun and McDonough (Reference Sun and McDonough1989). Data sources for the compiled Eocene–Oligocene EIMB igneous rocks are listed in Figure 8.

Tectonomagmatic discrimination diagrams for the EIMB magmatic rocks. (a) Correlation of Nb vs Y (Pearce et al. Reference Pearce, Harris and Tindle1984). (b) Correlation of Rb vs Y + Nb (Pearce et al. Reference Pearce, Harris and Tindle1984). (c) Correlation of Nb/Zr vs Zr (Thieblemont & Tegyey, Reference Thieblemont and Tegyey1994). (d) Correlation of Th/Yb vs Ta/Yb (Pearce, Reference Pearce1982). Data sources for the compiled Eocene–Oligocene EIMB igneous rocks are listed in Figure 8.

5.d. Whole-rock Sr–Nd isotope geochemistry
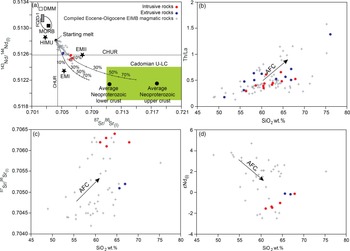
The age-corrected, initial (i) Sr–Nd isotopic compositions of the igneous rocks from the target area in the EIMB are listed in the online Supplementary Material Table S5. The 87Sr/86Sr(i) ratios range from 0.7061 to 0.7064, and ϵNd(i) values vary from −1.6 to −0.1 in the intrusive rocks. In the extrusive rocks, the 87Sr/86Sr(i) ratios range from 0.7051 to 0.7052 and ϵNd(i) values vary from −0.1 to +0.2. The Nd model ages (TDM) for the intrusive rocks range from 0.80 to 1.6 Ga, while the Nd model ages vary from 0.87 to 0.88 Ga in the extrusive rocks. In the 143Nd/144Nd(i) vs 87Sr/86Sr(i) plot (Fig. 13a), the Eocene–Oligocene EIMB igneous rocks are isotopically different from magmatic rocks formed from melting of a depleted MORB-type mantle (DMM) and plot between the end-members of DMM and enriched mantle components (EMI and EMII).
Isotopic and compositional diagrams for the EIMB magmatic rocks. (a) Relationship of 143Nd/144Nd(i) vs 87Sr/86Sr(i). (b) Relationship of Th/La vs SiO2 (wt %). (c) Relationship of 87Sr/86Sr(i) vs SiO2 (wt %). (d) Relationship of ϵNd(i) vs SiO2 (wt %). The SiO2 is calculated as anhydrous. Data sources for the compiled Eocene–Oligocene EIMB igneous rocks are listed in Figure 8. Compositional domains for mantle components (HIMU, EMI, EMII and DMM) are taken from Zindler and Hart (Reference Zindler and Hart1986). The data source for FOZO-1 is taken from Hart et al. (Reference Hart, Hauri, Oschmann and Whitehead1992). CHUR: chondritic uniform reservoir. The composition of the starting melt, a near-primitive basalt sample 07-50 (SiO2 = 48.97 (wt %); MgO = 11.77 (wt %); Mg# = 72.6; Cr = 520 ppm; Ni = 299 ppm; 87Sr/86Sr(i) = 0.7044; and 143Nd/144Nd(i) = 0.5128), is adopted from Pang et al. (Reference Pang, Chung, Zarrinkoub, Khatib, Mohammadi, Chiu, Chu, Lee and Lo2013). The assimilation-fractional crystallization (AFC) trends are simulated based on the algorithm proposed by Ersoy (Reference Ersoy2013). Iran’s Neoproterozoic upper and lower continental crust (Cadomian U-LC) is taken from Shafaii Moghadam et al. (Reference Shafaii Moghadam, Khademi, Hu, Stern, Santos and Wu2015a).

6. Discussion
6.a. Age, origin and magmatic evolution of the Eocene–Oligocene EIMB igneous rocks
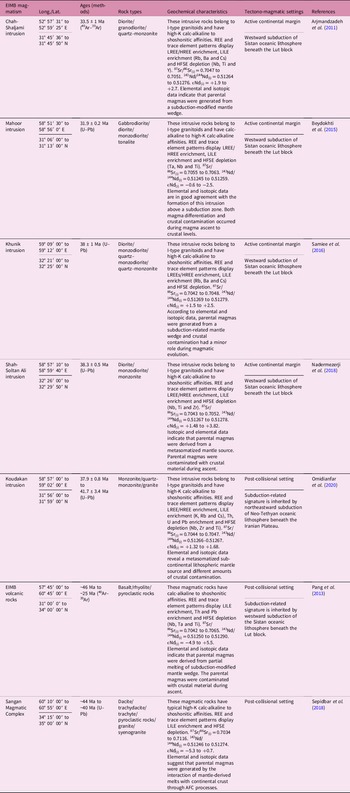
Several studies looked at the geochronology and geochemistry of the Eocene–Oligocene EIMB igneous rocks. Available ages, geochemical characteristics and tectono-magmatic settings for different magmatic rocks within the EIMB are presented in Table 1. The new zircon U–Pb ages from the extrusive (41.5 ± 0.5 Ma to 39.8 ± 0.8 Ma) and intrusive (43.5 ± 0.4 Ma to 41.2 ± 0.4 Ma) rocks are consistent with ages reported by Pang et al. (Reference Pang, Chung, Zarrinkoub, Khatib, Mohammadi, Chiu, Chu, Lee and Lo2013) for other EIMB magmatic rocks (∼46 Ma to ∼25 Ma). Notably, our zircon U–Pb ages for the intrusive rocks are slightly older than those of the extrusive rocks. Our dated extrusive rocks appear to represent only a small fraction of the lengthy volcanic activity in eastern Iran, and they are not in direct contact with the older intrusive rocks (the Hanar intrusion; see Fig. 3). This thick volcanic sequence was intruded by numerous intrusive bodies (Fig. 2) with different ages such as the Hanar (43.5 ± 0.4 Ma to 41.2 ± 0.4 Ma), Mahoor (31.9 ± 0.2 Ma; Beydokhti et al. Reference Beydokhti, Karimpour, Mazaheri, Santos and Klötzli2015), Chah-Shaljami (33.5 ± 1 Ma; Arjmandzadeh et al. Reference Arjmandzadeh, Karimpour, Mazaheri, Santos, Medina and Homam2011), Koudakan (37.9 ± 0.8 to 41.7 ± 3.4 Ma; Omidianfar et al. Reference Omidianfar, Monsef, Rahgoshay, Zheng and Cousens2020), Khunik (38 ± 1 Ma; Samiee et al. Reference Samiee, Karimpour, Ghaderi, Haidarian Shahri, Klöetzli and Santos2016) and Shah-Soltan Ali (38.3 ± 0.5 Ma; Nadermezerji et al. Reference Nadermezerji, Karimpour, Malekzadeh Shafaroudi, Francisco Santos, Mathur and Ribeiro2018) intrusions.
Available geochronological and geochemical data for the Eocene–Oligocene EIMB magmatic rocks

According to new and compiled geochemical data, enrichment in the LREEs and LILEs relative to the HREEs and HFSEs and high-K calc-alkaline to shoshonitic affinities of the Eocene–Oligocene EIMB igneous rocks (Figs. 10, 11) suggest that these rocks were derived from a LILE-metasomatized mantle source. The normalized REE and trace element patterns are mainly controlled by fluids/melts released from the subducting slab into the mantle wedge (Pearce et al. Reference Pearce, Stern, Bloomer and Fryer2005; Tatsumi, Reference Tatsumi2005). Furthermore, the Eocene–Oligocene EIMB igneous rocks mainly indicate similarities to subduction-related settings (Fig. 12a–c) and have high Th/Yb and Ta/Yb ratios (Fig. 12d), indicating they likely originated from an enriched mantle source modified by slab-derived components. Notably, subduction-related metasomatism in the source rocks of the Eocene–Oligocene EIMB magmatic rocks is supported by their Sr–Nd isotopic values in that they have high 87Sr/86Sr(i) at a given ϵNd(i) due to the addition of seawater-derived Sr (Willbold & Stracke, Reference Willbold and Stracke2010) (Fig. 13).
The high-K subduction-related magmas could have been derived from several potential sources, including: (i) by partial melting of a peridotite driven by the addition of fluids/melts released from a deeply subducted slab into the mantle wedge (Avanzinelli et al. Reference Avanzinelli, Lustrino, Mattei, Melluso and Conticelli2009); (ii) partial melting (remelting) of calc-alkaline and subduction-related mafic rocks from the lower continental crust (Hou et al. Reference Hou, Gao, Qu, Rui and Mo2004); (iii) magma mixing and crustal contamination (Mamani et al. Reference Mamani, Wörner and Thouret2008); and (iv) lower crustal assimilation in MASH (Melting Assimilation Storage Homogenization) or Hot Zones (Annen et al. Reference Annen, Blundy and Sparks2006).
The Mg# (40.4–62.1), Cr (22–166 ppm) and Ni (10–62 ppm) concentrations in the magmatic rocks of this study (online Supplementary Material Table S4) are much lower than values for mantle (peridotite)-derived primitive melts (Mg# = 73–81, Cr > 1000 ppm and Ni > 400 ppm; Wilson, Reference Wilson1989). The Y/Nb, Nb/Ta and Zr/Nb ratios are unaffected by fractionation, so they can help identify the EIMB magma source (Eby, Reference Eby1992; Thieblemont & Tegyey, Reference Thieblemont and Tegyey1994; Green, Reference Green1995; Morata et al. Reference Morata, Oliva, de la Cruz and Suárez2005). For example, the Y/Nb ratio in mantle-derived melts is <1.2, whereas this ratio is >1.2 in crustal-derived melts (Eby, Reference Eby1992). The Y/Nb ratio in our EIMB magmatic rocks varies from 1.2 to 3.66 (online Supplementary Material Table S4). Green (Reference Green1995) noted that the average Nb/Ta ratio is ∼17.5 in mantle-derived melts and ∼11.5 in crustal-derived melts. This ratio ranges from 5.37 to 11.67 in the igneous rocks of this study (online Supplementary Material Table S4). The Zr/Nb ratio could also be representative, ranging from 6.3 to 7.6 in mantle-derived melts and 22 to 25 in crustal-derived melts (Morata et al. Reference Morata, Oliva, de la Cruz and Suárez2005). This ratio ranges from 1.6 to 16.9 in the EIMB magmatic rocks (online Supplementary Material Table S4). Comparing the elemental ratios in rocks of this study with mantle- or crustal-derived melts emphasizes that these magmatic rocks have elemental ratios that fall between these two end-members, and the evolved magmas could be generated during mantle–crust assimilation. Additionally, significant positive anomalies in Pb and K can be related to the assimilation of crustal materials during magma ascent (see Fig. 11b, d; Taylor & McLennan, Reference Taylor and McLennan1985).
We emphasize that the assimilation of continental crust during magma ascent to the surface can affect the isotopic signatures of the magma (e.g. high Sr and low Nd isotopic ratios). On the isotopic 87Sr/86Sr(i) and 143Nd/144Nd(i) diagram (Fig. 13a), we consider a near-primitive basaltic lava of the Eocene–Oligocene EIMB as representative of juvenile mantle-derived melt (starting melt). In this plot, the Eocene–Oligocene EIMB magmatic rocks have a mixed origin. The mantle-derived melt is a significant component, and the continental crust (Cadomian upper crust) is a minor one. The isotopic mixing model suggests that the EIMB magmas formed by more than ∼90 % juvenile mantle-derived melt and less than ∼10 % Cadomian continental crust by assimilation-fractional crystallization (AFC) processes during magma ascent. In this respect, the Eocene–Oligocene EIMB magmatic rocks show increasing Th/La and 87Sr/86Sr(i) and decreasing ϵNd(i) values along with increasing SiO2, attesting to AFC processes during EIMB magmatic evolution (Fig. 13b–d). Our EIMB magmatic samples also record evidence of AFC during ascent and stagnation in the continental crust by the presence of some inherited zircons with 238U/206Pb ages of 440 Ma to 60 Ma. Therefore, the wide isotopic variations of the Eocene–Oligocene EIMB magmatic rocks can be explained by different amounts of crustal contamination during magma ascent.
Based on the presented geochemical data, mantle wedge had a significant role in forming the EIMB parental melts. In the following, we will discuss that the parental magmas were generated from a sub-continental lithospheric mantle (SCLM) or asthenospheric mantle. Although there are no primitive or near-primitive magmatic rocks in our analysed samples (online Supplementary Material Table S4), in our compiled dataset (n = 108) three basaltic rocks (samples 07-50, 08-Z-11 and 10-09; Pang et al. Reference Pang, Chung, Zarrinkoub, Khatib, Mohammadi, Chiu, Chu, Lee and Lo2013) show near-primitive magmatic characteristics (e.g. SiO2 = 48.97–50.57 (wt %), MgO = 11.64–13.45 (wt %), Mg# = 72.2–76, Cr = 438–1067 ppm and Ni = 299–556 ppm). The Nb/La ratio could help discriminate lithospheric from asthenospheric mantle sources (Abdel-Rahman & Nassar, Reference Abdel-Rahman and Nassar2004; Morata et al. Reference Morata, Oliva, de la Cruz and Suárez2005). The low Nb/La ratios of 0.33 to 0.42 from the near-primitive EIMB magmatic rocks indicate a SCLM source consistent with radiogenic Nd isotopic values (ϵNd(i) = 3–3.6) for these rocks. Moreover, deep asthenospheric mantle-derived melts are characterized by strong enrichment in LREEs relative to HREEs similar to OIB-like melts. In contrast, the REEs and trace element patterns of the Eocene–Oligocene EIMB magmatic rocks are not consistent with a deep asthenospheric mantle source (see Fig. 11).
Consequently, based on all elemental and isotopic ratios, we consider that the near-primary basaltic lavas from the Eocene–Oligocene EIMB could have originated from a subduction-modified SCLM. A metasomatized SCLM source has previously been proposed for the genesis of Eocene–Oligocene magmatic rocks from NW, N and NE Iran (e.g. Verdel et al. Reference Verdel, Wernicke, Hassanzadeh and Guest2011; Sepidbar et al. Reference Sepidbar, Shafaii Moghadam, Zhang, Li, Ma, Stern and Lin2019; Shafaii Moghadam et al. Reference Shafaii Moghadam, Li, Li, Stern, Levresse, Santos, Lopez Martinez, Ducea, Ghorbani and Hassannezhad2020). The parental melts are further fractionated and contaminated with an upper continental crust of eastern Iran during ascent and stagnation at a shallow depth to produce the Eocene–Oligocene EIMB evolved melts. The La(N)/Yb(N) ratios of the Eocene–Oligocene EIMB igneous rocks range from 2.53 to 16.55 (online Supplementary Material Table S4 and compiled data), which are lower than those for a garnet-bearing mantle source (La(N)/Yb(N) > 20; Martin, Reference Martin1987). Also, the Sm/Yb ratios of the EIMB magmatic samples range from 1.2 to 3.8 (online Supplementary Material Table S4 and compiled data), highlighting that the magmatic rocks probably formed within spinel–lherzolite stability fields (Kay, Reference Kay2001), suggesting their formation at depths less than 75 km.
6.b. Tectono-magmatic implication for the Eocene–Oligocene EIMB magmatic rocks
Three scenarios have been proposed to explain the origin of the voluminous Eocene–Oligocene igneous rocks within the EIMB. In the first scenario, Verdel et al. (Reference Verdel, Wernicke, Hassanzadeh and Guest2011) suggested that the Eocene–Oligocene magmatism of the EIMB, as in the UDMB and AAMB, was related to an extensional tectonic environment that prevailed in the Iranian Plateau, overlying the subducting Neo-Tethyan oceanic lithosphere. In this model, roll-back of the subducting slab caused lithospheric thinning and extension of the overriding plate (the Iranian Plateau), leading to the decompression melting of metasomatized lithospheric mantle and the formation of elongated rift basins. In the second scenario, Pang et al. (Reference Pang, Chung, Zarrinkoub, Khatib, Mohammadi, Chiu, Chu, Lee and Lo2013) suggested that westward subduction of the Sistan oceanic lithosphere followed by the collision between the Lut and Afghan blocks formed a thickened continental lithosphere in the Late Cretaceous – Palaeocene; this thickened lithospheric root subsequently collapsed, triggering asthenospheric upwelling and magmatism in an extensional post-collisional setting during the Eocene to Oligocene. In the third scenario, the Eocene–Oligocene EIMB magmatic rocks were attributed to an Andean-type active continental margin setting. In this model, igneous rocks of the Lut block resulted from westward subduction of the Sistan oceanic lithosphere beneath the Lut block during the Cretaceous to Palaeogene (e.g. Arjmandzadeh et al. Reference Arjmandzadeh, Karimpour, Mazaheri, Santos, Medina and Homam2011; Beydokhti et al. Reference Beydokhti, Karimpour, Mazaheri, Santos and Klötzli2015; Samiee et al. Reference Samiee, Karimpour, Ghaderi, Haidarian Shahri, Klöetzli and Santos2016; Nadermezerji et al. Reference Nadermezerji, Karimpour, Malekzadeh Shafaroudi, Francisco Santos, Mathur and Ribeiro2018).
Generally, the geochemical and isotopic results (including our new and compiled data) indicate that metasomatized SCLM is the primary mantle source for the Eocene–Oligocene EIMB magmatic rocks. One of the outstanding questions is, did the subduction-related components come from the westward subduction of the Sistan oceanic lithosphere beneath the Lut block or the northeastward subduction of the Neo-Tethyan oceanic lithosphere underneath the Iranian Plateau (including EIMB region)? Based on geochemical investigations, some studies proposed that the subduction-related characteristics of the EIMB magmatic rocks could be inherited by the westward subduction of the Sistan oceanic lithosphere beneath the Lut block during the pre-Late Cretaceous along the so-called Sistan suture zone (e.g. Arjmandzadeh et al. Reference Arjmandzadeh, Karimpour, Mazaheri, Santos, Medina and Homam2011; Pang et al. Reference Pang, Chung, Zarrinkoub, Khatib, Mohammadi, Chiu, Chu, Lee and Lo2013; Beydokhti et al. Reference Beydokhti, Karimpour, Mazaheri, Santos and Klötzli2015; Samiee et al. Reference Samiee, Karimpour, Ghaderi, Haidarian Shahri, Klöetzli and Santos2016; Nadermezerji et al. Reference Nadermezerji, Karimpour, Malekzadeh Shafaroudi, Francisco Santos, Mathur and Ribeiro2018; Sepidbar et al. Reference Sepidbar, Mirnejad, Ma and Moghadam2018). On the other hand, structural evidence revealed that the accretionary wedge of the Sistan suture zone is generated due to the eastward subduction of the Sistan Ocean beneath the Afghan block (Fotoohi Rad et al. Reference Fotoohi Rad, Droop, Amini and Moazzen2005; Angiboust et al. Reference Angiboust, Agard, De Hoog, Omrani and Plunder2013; Bonnet et al. Reference Bonnet, Agard, Angiboust, Monié, Jentzer, Omrani, Whitechurch and Fournier2018). Jentzer et al. (Reference Jentzer, Whitechurch, Agard, Ulrich, Caron, Zarrinkoub, Kohansal, Miguet, Omrani and Fournier2020) believed that the Late Cretaceous subduction-related magmatism in the west of the Afghan block was formed due to the NE-dipping subduction of the Sistan oceanic lithosphere beneath the stretched margin of the Afghan block. In any case, the subduction of the Sistan oceanic lithosphere beneath the Afghan block could not supply the subduction components into the mantle beneath the EIMB. We believe that the subduction-related characteristic of the EIMB magmatic rocks is more likely controlled by subduction processes along the Zagros suture zone. A unique NE-dipping subducting oceanic crust beneath the Iranian Plateau is also supported by seismic survey and mantle tomography (e.g. Al-Lazki et al. Reference Al-Lazki, Sandvol, Seber, Barazangi, Turkelli and Mohamad2004; Molinaro et al. Reference Molinaro, Zeyen and Laurencin2005; Authemayou et al. Reference Authemayou, Chardon, Bellier, Malekzadeh, Shabanian and Abbassi2006; Shomali et al. Reference Shomali, Keshvari, Hassanzadeh and Mirzaei2011; Entezar-Saadat et al. Reference Entezar-Saadat, Motavally-Anbaran and Zeyen2017). A similar mechanism has also been suggested for the Eocene–Oligocene magmatism in the UDMB, AAMB and NEIMB (e.g. Verdel et al. Reference Verdel, Wernicke, Hassanzadeh and Guest2011; Sepidbar et al. Reference Sepidbar, Shafaii Moghadam, Zhang, Li, Ma, Stern and Lin2019; Shafaii Moghadam et al. Reference Shafaii Moghadam, Li, Li, Stern, Levresse, Santos, Lopez Martinez, Ducea, Ghorbani and Hassannezhad2020).
A geodynamic model for Eocene–Oligocene EIMB magmatism should be able to explain how: (i) subduction-related metasomatism underneath the EIMB was formed by northeastward subduction of the Neo-Tethyan oceanic lithosphere beneath the Iranian Plateau; (ii) near-primitive mafic rocks of the EIMB were derived from a metasomatized SCLM and not necessarily from a depleted MORB mantle (DMM) or a deep asthenospheric mantle source (e.g. HIMU-, FOZO- and OIB-like); and (iii) the evolved intermediate to felsic igneous rocks show contamination with continental crust.
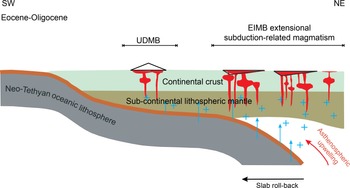
We propose that the voluminous Eocene–Oligocene EIMB subduction-related magmatic rocks were generated in an extensional tectonic context accompanied by lithospheric thinning in an overlying plate (Fig. 14). These rocks are similar to the other extensional subduction-related magmatic flare-ups (e.g. UDMB, AAMB and NEIMB), which were simultaneously formed within the Iranian Plateau. The extensional tectonic regime within the Iranian Plateau during the Palaeogene time (especially Eocene–Oligocene) is supported by the abundant metamorphic core complex formation and the presence of shallow to deep marine sediments interbedded with high-volume volcanic rocks (Berberian & King. Reference Berberian and King1981; Brunet et al. Reference Brunet, Korotaev, Ershow and Nikishin2003; Vincent et al. Reference Vincent, Allen, Ismail-Zadeh, Flecker, Foland and Simmonds2005; Ballato et al. Reference Ballato, Uba, Landgrfa, Strecker, Sudo, Stockli, Friedrih and Tabatabaei2011; Verdel et al. Reference Verdel, Wernicke, Hassanzadeh and Guest2011). Numerous Eocene–Oligocene volcano-sedimentary strata indicate a shallow submarine extensional basin within the EIMB. Moreover, the presence of pillow lava structure in some lithological units within the EIMB (∼100 km west of the Zahedan; Camp & Griffis, Reference Camp and Griffis1982) could be attributed to the eruption in a water-filled extensional basin. The extensional environment and its associated high-volume magmatic rocks within the Iranian Plateau are likely related to the steepening of old Neo-Tethyan oceanic slab beneath the Iranian Plateau, leading to trench roll-back (for more details, see Verdel et al. Reference Verdel, Wernicke, Hassanzadeh and Guest2011; Shafaii Moghadam et al. Reference Shafaii Moghadam, Griffin, Kirchenbaur, Gare-Schnoberg, Khedr and Kimura2018, Reference Shafaii Moghadam, Li, Li, Stern, Levresse, Santos, Lopez Martinez, Ducea, Ghorbani and Hassannezhad2020; Sepidbar et al. Reference Sepidbar, Shafaii Moghadam, Zhang, Li, Ma, Stern and Lin2019).
A geodynamic model proposes the formation of the EIMB magmatic rocks. The EIMB magmatism is assumed to be formed during the Eocene–Oligocene due to the Neo-Tethys slab roll-back, asthenospheric upwelling and lithospheric extension.

In our scenario for the formation of EIMB magmatic rocks, similar to what has been proposed for the UDMB, AAMB and NEIMB magmatic flare-ups (Verdel et al. Reference Verdel, Wernicke, Hassanzadeh and Guest2011; Sepidbar et al. Reference Sepidbar, Shafaii Moghadam, Zhang, Li, Ma, Stern and Lin2019; Shafaii Moghadam et al. Reference Shafaii Moghadam, Li, Li, Stern, Levresse, Santos, Lopez Martinez, Ducea, Ghorbani and Hassannezhad2020), relatively steep-angle subduction of the Neo-Tethyan oceanic lithosphere beneath the Iranian Plateau occurred during the Cretaceous. It was followed by flat-slab subduction, leading to the addition of slab-derived fluids/melts into the SCLM under the EIMB. At a later stage, during the Eocene to Oligocene, slab roll-back of the Neo-Tethyan oceanic lithosphere and subsequent asthenospheric upwelling into the mantle wedge led to lithospheric thinning, partial melting of metasomatized SCLM and the generation of EIMB extensional subduction-related magmatism (Fig. 14). The SCLM-derived melts then interacted with the continental crust during magma ascent (AFC process).
7. Conclusions
Our new zircon U–Pb data from igneous rocks of the region south of Birjand yielded ages of 43.6 ± 0.4 Ma to 39.5 ± 0.6 Ma, consistent with those reported from other EIMB magmatic rocks (∼46 Ma to ∼25 Ma). The Eocene–Oligocene EIMB igneous rocks are represented by slight to moderate LREE/HREE enrichment (e.g. LaN/YbN = 2.5 to 16.6), positive Cs, Rb, Ba, K, Th and U anomalies, and negative Nb, Zr and Ti anomalies, which attest to their derivation in a subduction-related environment. The geochemical and isotopic data show that the magmatic rocks are co-genetic and that their parental magmas were derived from a metasomatized SCLM source. Furthermore, the Sr–Nd isotopic ratios reveal an interaction of parental melts with small amounts (<10 %) of Iran’s Cadomian upper continental crust during ascent. We propose that Eocene–Oligocene magmatism in eastern Iran was formed in an extensional subduction-related tectonic environment. In this formwork, slab roll-back accompanied by asthenospheric upwelling triggered lithospheric thinning, partially melting metasomatized SCLM and generation of EIMB primary magmas.
Supplementary material
To view supplementary material for this article, please visit https://doi.org/10.1017/S0016756822001066
Acknowledgements
This research received no specific grant from any commercial or not-for-profit funding agency. The authors are greatly indebted to Dr Sarah Sherlock, editor of the Geological Magazine, Dr Scott A. Whattam, Dr Michael Bröcker and two anonymous reviewers for constructive discussions, thorough revisions and valuable comments concerning the manuscript.
Conflict of interest
None.