I. INTRODUCTION
In the past, precipitation hardening was considered to play a minor role in strengthening the material, since most alloying elements were added to enhance the grain refinement. Recently, Funakawa et al. Reference Funakawa, Shiozaki, Tomita, Yamamoto and Maeda1 reported a great potential to improve the strength through nanometer-sized (Ti, Mo)C carbide precipitates that formed during austenite to ferrite transformation. The precipitation hardening contribution to yield strength (YS) due to the nanometer-sized (Ti, Mo)C carbides was estimated to be approximately 200∼300 MPa, which is 2∼3 times higher than that from conventional precipitation hardening (90∼150 MPa). Reference Gladman2 Such an considerable strengthening effect was attributed to the superior coarsening resistance of the (Ti, Mo)C carbide as compared to other carbides such as TiC and (Ti, Nb)C. Reference Chen, Yen, Kao, Li, Huang, Yang and Wang3
Since then, the precipitation behaviors of (Ti, Mo)C carbides, Reference Duan, Cai and Wu4–Reference Yen, Chen, Huang and Yang7 the processing condition effects such as coiling temperatures (CTs), Reference Funakawa and Seto8,Reference Kim, Song, Seo, Hong and Lee9 rolling processing, Reference Sun, Cai, W, Mao and Chen10–Reference Kim, Kim, Hong and Lee12 and cooling rate during austenite (γ) to ferrite (α) transformation Reference Duan, Cai, Wu and Tang13 have been extensively investigated on the precipitation hardening of Ti–Mo bearing steel. (Ti, Mo)C carbide was reported to form either at the γ/α interface during transformation i.e., interphase precipitation, or in the supersaturated ferrite after transformation, and there existed a transition in the precipitation mode from interphase precipitation to supersaturated precipitation when the cooling rate increases or the isothermal temperature decreases. Reference Kamikawa, Abe, Miyamoto, Funakawa and Furuhara6,Reference Yen, Chen, Huang and Yang7,Reference Jha, Das, Lodh and Haldar14,Reference Jha, Das, Sinha, Lodh and Haldar15,Reference Wang, Sun, Yong, Li, Zhang and Jiang17 The tensile strength grade was improved from 780 MPa to 890 MPa by increasing the contents of C, Ti and Mo to 0.075%, 0.17% and 0.275% respectively Reference Kim, Kim, Hong and Lee12 based on the JFE's work, in which they are 0.04%, 0.10% and 0.20% for C, Ti and Mo. Conducting the rolling in the regions through austenite recrystallization region to austenite nonrecrystallization region, can provide desirable microstructural features for impact properties as well as for strength by inducing a homogenous and fine grain structure, well developed dislocation structures inside grain, relatively high number density of fine carbides, and hardening effect were somewhat reduced by strain-induced precipitation. Reference Kim, Song, Seo, Hong and Lee9 Also, the optimal combination of mechanical property was obtained after coiling at 600∼630 °C, and a larger number of finer and more uniform precipitates can be obtained through inter-phase precipitation under the condition of a higher cooling rate during γ/α transformation. However, it is not known whether the limit of the strength grade of Ti–Mo-bearing microalloyed hot-rolled ferrite sheet steel is realized, and, the potential of nanometer sized (Ti, Mo)C carbides in terms of strengthening and toughening hot-rolled ferrite sheet steel still needs to be further explored.
Therefore, the aim of this study is to, through chemical composition design and thermo-mechanical controlled processing (TMCP) (reheating temperature, rolling and coiling schedules) optimization, develop a new ultrahigh strength hot rolled Ti–Mo bearing ferritic sheet steel to fully utilize the great potential of nanometer-sized (Ti, Mo)C carbide. Furthermore, the strength mechanism, precipitation behavior in the ultrahigh strength hot-rolled ferritic steel during TMCP and their roles in the microstructure evolution are addressed in details.
II. EXPERIMENTAL
A. Chemical composition design
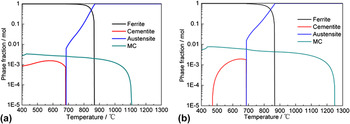
According to the design philosophy of Funakawa et al., Reference Funakawa, Shiozaki, Tomita, Yamamoto and Maeda1 the composition of Ti–Mo-bearing steel was designed as 0.05 × nC–0.1 × nTi–0.2 × nMo (wt%) (here n is a variant coefficient) where C, Ti, and Mo proportionally precipitate as (Ti, Mo)C carbide to fully make the carbide formers precipitate. Figure 1 shows the equilibrium phase fraction as functions of temperature calculated by Thermo-calc software with the database of TCFE7 of 0.05 × nC–0.1 × nTi–0.2 × nMo (wt%) (n = 1, 2) steel. The equilibrium solubility temperature of (Ti, Mo)C carbide increases from 1100 °C to 1250 °C as n varies from 1 to 2. Considering the increasingly possibility of the excess growth of austenite grain size usually occurring at the reheating temperature above 1300 °C, Reference Gladman2 the composition of 0.1C–0.2Ti–0.4Mo (wt%) is determined as the highest composition system among this type Ti–Mo-bearing steel. That is because excess Ti and Mo can not go into solution during reheating process, and form larger particles which have little effect on the microstructure evolution during TMCP, and thus on the resultant mechanical property. Furthermore, the redundant C will form cementite with Fe, which is detrimental to the uniform plasticity. Reference Jha, Das, Sinha, Lodh and Haldar15 Therefore, the chemical composition of the steel studied in the present paper was determined as 0.1C–0.2Ti–0.4Mo (wt%). Considering the dissolution kinetics of MC carbide during reheating process, the reheating temperature of 1280 °C that is 30 °C higher than the Tes of MC carbide was set to sufficiently dissolve the forming elements (C, Ti and Mo) of (Ti, Mo)C carbide during the reheating process. In addition, it is seen (Fig. 1) that the equilibrium microstructure in the temperature range of 500–650 °C of the steel studied consisted of ferrite matrix (approaching 100 mol%), MC carbide (almost saturated ∼1.0 mol%), and cementite (very little ∼0.1 mol%). This indicates that the equilibrium microstructure of the studied steel is full ferritic structure strengthened by MC carbide.
Equilibrium phase fractions plotted as functions of temperature in (a) 0.1Ti–0.2Mo steel and (b) 0.2Ti–0.4Mo steel calculated by the Thermo-calc software with the database of TCFE7.

In addition, the content of Mn in the steel studied was designed as 1.3 wt%, and that of Si was designed as a regular amount with the value of 0.2 wt%. S and N are controlled as low as possible to decrease the formation of Ti4S2C2 and TiN which have larger sizes of >100 nm, and thus leave more Ti that can be precipitated during rolling process and coiling process.
B. Thermo-mechanical control process (TMCP)
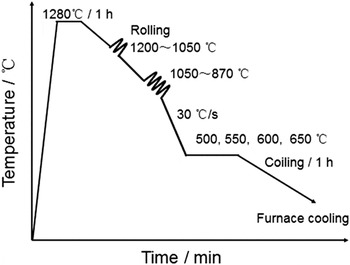
The actual chemical composition of the steel studied was 0.079C, 0.17Si, 1.22Mn, 0.19Ti, 0.43Mo, 0.03Al, 0.0052S, 0.0038P and 0.0048N (wt%). The steel was prepared by vacuum induction melting and hot-forged to 30 mm thick bars. Figure 2 shows the schematic illustration of TMCP schedule. Hot-forged bars were solution-treated at 1280 °C for 1 h and air-cooled to the starting rolling temperature 1200 °C. The rolling process was composed of 7 passes with the total reduction of 93% at temperature ranging from 1200 °C to 870 °C which goes through from the austenite recrystallization region to austenite non-recrystallization region. According to Kim et al., Reference Kim, Hong, Huh and Lee11 the best combination of mechanical properties can be achieved when finishing rolling temperature (FRT) is around 880 °C. Thus, the FRT was designed as 870 °C. After rolling, to simulate the temperature history of the hot-coiling process, the specimens were water-cooled to 500, 550, 600 and 650 °C (approximately 30 °C/s) and held at that temperature for 1 h followed by furnace cooling to room temperature. For convenience, the samples prepared at various CTs were designated as 500, 550, 600 and 650 °C by reflecting the CT in the remainder of the paper.
Schematic illustration describing the TMCP schedule employed.

Tensile tests were conducted using an WE-300 machine (Tianshui City, China) at room temperature. The samples with their longitudinal axis aligned parallel to the rolling direction were machined in the gauge section of the test sample 140 mm × 10 mm × 2 mm (length × width × thickness). The samples for optical microscopy and scanning electron microscope analysis were prepared in an etchant of 4% nital after the standard mechanical polishing. Electron backscatter diffraction (EBSD) was used to identify the size and size distribution of ferrite grain, and volume fraction of low angle boundary. A step size of 0.2 μm was used. The surface of tested sample was first ground on conventional grinding papers and then electro-polished using 92% acetic acid + 8% perchloric acid at 60 V at room temperature for 10 s. The data measured was interpreted by orientation imaging microscopy analysis software.
The mass fraction of MC and M3C phase was measured using physical–chemical phase analysis. Reference Li, Fang, Liu, Lu and Zhang16 The size distribution of MC precipitates was tested by small angle X-ray scattering. Meanwhile, the phase structures of precipitates were identified by X-ray diffraction. The thin foils for transmission electron microscopy (TEM) were prepared by twin jet polishing in the electrolyte made of 94% acetic acid + 6% perchloric acid. Also, carbon extraction replica technique was used for the observation of the precipitates by means of high resolution transmission electron microscopy (HRTEM). In addition, the energy dispersive X-ray spectroscopy (EDS) was used to identify the composition of the precipitates during the HRTEM analysis. Reference Funakawa, Shiozaki, Tomita, Yamamoto and Maeda1
III. RESULT
A. Mechanical properties
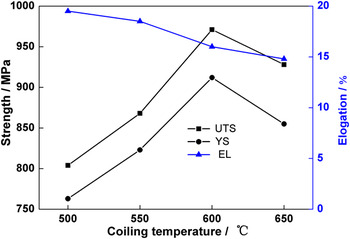
The tensile mechanical properties of the experimental steels are presented in Fig. 3. As the CT increases from 500 °C to 650 °C, the ultimate tensile strength (UTS) and yield strength (YS) first increase and then decrease, while the total elongation (EL) slightly decreases. At 600 °C, both UTS and YS have the maximum values, 971 and 912 MPa, respectively, and the EL is 16%.These values of strength are greater than those steels reported in the previous studies. Reference Funakawa, Shiozaki, Tomita, Yamamoto and Maeda1,Reference Kim, Song, Seo, Hong and Lee9,Reference Kim, Hong, Huh and Lee11
Effects of coiling temperature on the tensile mechanical properties of the experimental steel.

B. Microstructure
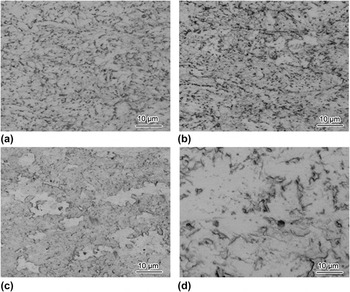
Optical observation was carried out for samples coiled at different CTs, as shown in Fig. 4. It reveals that bainitic ferrites were obtained at the lower CTs of 500 and 550 °C [Figs. 4(a) and 4(b)] and full ferrites were formed at the higher CTs of 600 and 650 °C [Figs. 4(c) and 4(d)]. Unetched ferrite grain boundary indicates that the most of interstitial C atoms are consumed to form MC carbide. Reference Kim, Song, Seo, Hong and Lee9
Optical images of the microstructure of the experiment steel at different CTs of (a) 500 °C, (b) 550 °C, (c) 600 °C and (d) 650 °C.

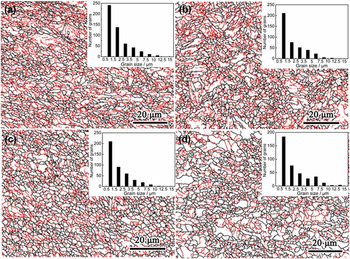
The EBSD images showing the grain structure of samples with different CTs are presented in Fig. 5, where the ferrite grain boundary (θ ≥ 15°) and low grain boundary (LAB) (2° ≤ θ < 15°), composing of dislocations, are indicated as black and red lines, respectively. All the samples had a polygonal or quasi-polygonal shaped ferrite grain structures where dislocation structures (LAB) exists. The distribution of ferrite grain size was inset in Fig. 5. It is seen that the most homogenous ferrite grain distribution was obtained at the CT of 600 °C. The average ferrite grain sizes were measured to be 2.19, 2.28, 2.31 and 2.42 μm for sample 500, 550, 600 and 650 °C, respectively.
EBSD images of the microstructure of the steel coiled at (a) 500 °C, (b) 550 °C, (c) 600 °C and (d) 650 °C. The black and red lines indicate the high misorientation angle boundaries (θ ≥ 15°) and low misorientation angle boundaries (2° < θ ≤ 15°), respectively. The histogram locating at the top right corner of each figure is the grain size distribution of ferrite determined by analysis software in EBSD testing system.

C. Precipitates
Table I shows the results of quantitative analysis by physical chemical phase analysis. It is seen that the amount of MC increased with the increase in CT from 0.056% at 500 °C to 0.358% at 650 °C. However, the amount of M3C decreased with the increase in CT from 0.613% at 500 °C to 0.198% at 650 °C.
Quantitative analysis results of precipitates obtained at different CTs (wt%) a .

a C* represents the calculated carbon content and MC and M3C represent (Ti, Mo)C and (Fe, Mn, Mo)3C, respectively. ∑—the mass fraction of the sum of MC or M3C. In addition, Ti* represents the amount of contributing for MC by subtracting the amount of Ti combined with sulfur and nitrogen from the total Ti content provided by physical–chemical phase analysis.
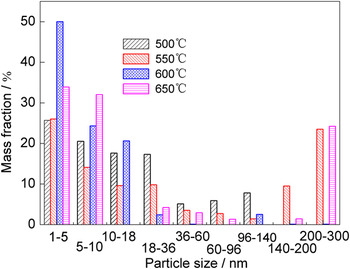
Figure 6 presents the size distribution of MC at different CTs. The mass fractions of MC precipitates with a size of <10 nm are comparable, 46.2% and 40.1% for samples 500 and 550 °C, respectively. At CT of 600 °C, the precipitates with a size of <10 nm occupy the highest mass fraction about 74.3%, which shows a slightly larger mass fraction than that for sample 650 °C. The results revealed that the tiniest precipitates were obtained at CT of 600 °C, and thus precipitation hardening is expected to be most significant for sample 600 °C.
Size distribution of (Ti, Mo)C particles at different CTs determined by physical chemical phase analysis.

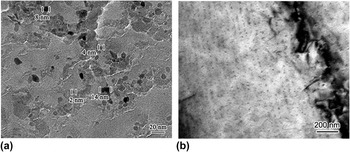
Figure 7(a) is the TEM images showing the nano-sized (Ti, Mo)C precipitates in the specimen coiled at 600 °C. It is seen that (Ti, Mo)C can be divided into 2 categories: <10 nm size and 10∼20 nm size. Particles smaller than 10 nm were disk or spherical (Ti, Mo)C, and they occupy the large proportion. While a small amount of particles in the 10∼20 nm size exhibit irregular shape. Figure 7(b) shows the distribution of (Ti, Mo)C precipitates in ferritic matrix. The planar interphase precipitation with regular sheet spacing of ∼50 nm was observed.
TEM images of steel simulated coiling at 600 °C: (a) nano-sized precipitates on carbon replica film and (b) interphase precipitation sheets.

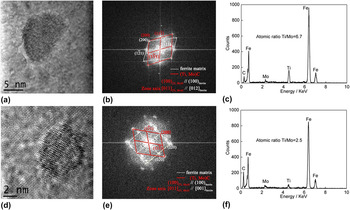
Figure 8 shows the HRTEM images of the two types of nano-sized (Ti, Mo)C and the corresponding fast Fourier transformed diffraction and EDS spectra of the particle in the steel simulated coiling at 600 °C. One is the irregular (Ti, Mo)C particle with the size of 13 nm [Fig. 8(a)], and the carbide obeyed an orientation relationship with the respect to the matrix: (100)(Ti, Mo)C//(100)α-Fe, [011](Ti, Mo)C//[012]α-Fe [Fig. 8(b)]. Moreover, the EDS analysis revealed that they contained both Ti and Mo, and the atomic ratio of Ti to Mo was measured to be 6.7 [Fig. 8(c)]. The other is the spherical (Ti, Mo)C particle with a size of 4 nm [Fig. 8(d)], and the carbide obeyed the Baker–Nutting (BN) orientation relationship with the respect to the matrix: (100)(Ti, Mo)C//(100)α-Fe, [011](Ti, Mo)C//[010]α-Fe [Fig. 8(e)]. The atomic ratio of Ti to Mo was determined as 2.5 [Fig. 8(f)], which is much smaller than that of the irregular counterpart.
HRTEM images of (Ti, Mo)C particles and the corresponding fast Fourier transformed diffraction and EDS spectra of the steel simulated coiling at 600 °C. (a) HRTEM image of a nano-sized (Ti, Mo)C carbide formed in austenite region, (b) the corresponding fast Fourier transformed diffraction of particle (a), (c) the EDS analysis of particle (a), (d) HRTEM image of a nano-sized (Ti, Mo)C carbide in ferrite region, (e) the corresponding fast Fourier transformed diffraction of particle (d), and (f) the EDS analysis of particle in (d).

IV. DISCUSSION
A. Strengthening mechanisms
To understand the correlation between microstructures and strength, the structure-based strength calculation model is used to estimate the theoretical strength. It is assumed that yield stress (σy) of the steel can be given by a simple sum of strengthening contributions from individual crystal defects that act as obstacles for dislocation slip in the following equation Reference Gladman2,Reference Picking18 :
 $${{\rm{\sigma }}_{\rm{y}}} = {{\rm{\sigma }}_0} + {{\rm{\sigma }}_{\rm{s}}} + {{\rm{\sigma }}_{\rm{g}}} + {{\rm{\sigma }}_{\rm{p}}} + {{\rm{\sigma }}_{\rm{d}}}\quad ,$$
where σ0 is the lattice friction stress of pure iron (48 MPa), Reference Funakawa, Shiozaki, Tomita, Yamamoto and Maeda1,Reference Mao, Huo, Sun and Cai19 σs is the solid solution hardening stress due to solute elements, σg is the grain refinement hardening in a poly-crystalline steel, σp is the precipitation hardening stress, and σd is the dislocation hardening stress, caused by the interaction of dislocations.
According to Yong, Reference Yong, Ma and Wu20 solid solution hardening stress σs can be evaluated by the following equation:
 $${{\rm{\sigma }}_{\rm{s}}} = 4570\left[ {\rm{C}} \right] + 37\left[ {{\rm{Mn}}} \right] + 83\left[ {{\rm{Si}}} \right] + 470\left[ {\rm{P}} \right] + 11\left[ {{\rm{Mo}}} \right] + 80.5\left[ {{\rm{Ti}}} \right]\quad .$$
[Xi] represents the mass percent of the element Xi in ferrite. For a micro-alloyed steel, it can be seen that Si and P are all in solution. In this work, [N] is zero since all the nitrogen was fixed by the formation of the large TiN. Meanwhile, the mass fractions of other elements formed in MC and M3C particles were shown in Table I. It is noted that a small amount of M/A islands existed in the ferrite matrix of sample 500 °C, and they take up some C atoms. Thus, it is assumed that the C content in solid solution is 0.0218%. The C content of other samples can be calculated according to Table I. The calculated values for different CTs were shown in Table II.
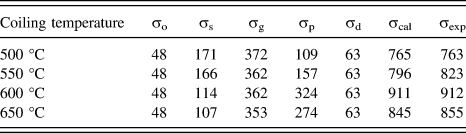
Comparison of YS between experimental results and the predictions with Eq. (1) and various hardening strengthening increments of different coiling temperatures (units: MPa) a .

a Note: σo, σs, σg, σp, σd, σcal, and σexp represent the lattice fraction stress of pure iron, solid solution hardening, grain refinement hardening, precipitation hardening, dislocation hardening, calculated YS with Eq. (1) and experimentally measured YS, respectively.
Grain refinement hardening stress σg can be expressed using the Hall–Petch relation Reference Petch21,Reference Petch22 :
 $${{\rm{\sigma }}_{\rm{g}}} = {K_{\rm{y}}}{d^{ - 0.5}}\quad {\rm{,}}$$
where K y is the constant (0.55 MPa m0.5 for HSLA steel Reference Funakawa, Shiozaki, Tomita, Yamamoto and Maeda1,Reference Mao, Huo, Sun and Cai19 ) and d is the average ferrite grain size (m) (Table I). σg was calculated to be 372, 362, 362 and 353 MPa for sample 500, 550, 600 and 650 °C (Table II).
Precipitation hardening stress σp can be given by the Ashby–Orowan relation Reference Yong23 :
 $${{\rm{\sigma }}_{\rm{p}}} = 8.995 \times {10^3}{{{f^{{1 \mathord{\left/ {\vphantom {1 2}} \right. \kern-\nulldelimiterspace} 2}}}} \over d}{\rm{ln}}\left( {2.417d} \right)\quad {\rm{,}}$$
where f is the volume fraction of precipitation (%), d is the average diameter of precipitates, (nm). Based on the mass fraction and size distribution of MC at different CTs (Table I and Fig. 6), the contribution of each size of precipitates was calculated using the size distribution data and σp was the square root of the sum of strengthening contributions of different size interval particles. The calculated results are listed in Table II. It should be noted that the calculated results of σp is mainly from each size range of precipitate, but only fine precipitates (<10 nm) play a key role in the precipitation hardening (316 MPa) and the contribution (only 8 MPa) of large precipitates (>10 nm) is almost negligible. Reference Shen, Wang and Sun24
For dislocation strengthening, the Bailey–Hirsch relationship is used Reference Bailey and Hirsch25 :
 $${{\rm{\sigma }}_{\rm{d}}} = M{\rm{\alpha }}Gb{{\rm{\rho }}^{1/2}}\quad {\rm{,}}$$
where M is Taylor factor (=2.75 for random textured bcc metals Reference Chin and Mammel26 ), α is a constant (=0.38 in bcc iron Reference Keh27 ), G is the shear modulus of Fe (8.065 × 10⁴ MPa), b is the Burgers vector (0.246 nm for body-centered cubic [bcc] Reference Funakawa, Shiozaki, Tomita, Yamamoto and Maeda1,Reference Mao, Huo, Sun and Cai19 ), and ρ is the dislocation density per unit area (m−2). The dislocation density was not measured in this work. However, an analysis of the literature for similar steel composition and processing parameters suggested a dislocation density of about 1 × 10¹³ m−2 in the studied steel. Reference Yong23 Based on this value, the calculated σd is 63 MPa, as given in Table II.
The calculated strengthening increments according to Eqs. (1)–(5) are given in Table II. The results show that the difference of σcal and σexp of YS at different CTs was smaller than 20 MPa, indicating that the estimation of the individual strengthening factors, were reasonable. In addition, it is noted that the steels developed were strengthened mostly by a combined effect of ferrite grain refinement hardening and precipitation hardening. The difference of σg for different samples is small, while the variation in σp at different CTs is relatively larger. Therefore, σp is the main factor resulting in the variation in YS for different CTs. This difference in YS can be attributed to the changes in the amount of precipitation and the proportion of the nano-sized carbides with a size less than 10 nm (Table I and Fig. 6). Previous studies indicated that nano-sized carbides with a size of <10 nm played a vital role in precipitation hardening when the volume fraction of carbides is constant. Reference Wang, Sun, Yong, Li, Zhang and Jiang17,Reference Zhang, Yong, Sun, Li, Zhao and Chen28 Thus, for sample 600 °C, the largest hardening precipitation increment of 324 MPa was obtained. Moreover, the sum contribution of grain refinement and precipitation hardening increments reaches 686 MPa, which is ∼100 MPa higher than that reported by other researchers. Reference Kim, Song, Seo, Hong and Lee9,Reference Kim, Kim, Hong and Lee12 This indicates that the TMCP used in the developed steel is relatively reasonable. It is the reason why developed steel coiled at 600 °C has the greatest YS (Fig. 3). In addition, considering the theoretical design system [0.1C–0.2Ti–0.4Mo (wt%)] which is slightly higher than the actual chemical composition [0.079–0.19Ti–0.43Mo (wt%)]. The yield and tensile strength for the theoretical design system are predicted to be ∼950 and 1000 MPa, respectively. This is the possible toplimit of strength grade of the Ti–Mo-bearing microalloyed hot rolled sheet steel because the combination of the ferrite grain refinement hardening (362 MPa) and precipitation hardening (324 MPa) almost reach the limit.
B. The precipitation behavior of (Ti, Mo)C during TMCP and their effects on the microstructure
1. The precipitation behavior of (Ti, Mo)C
For the rolling in austenite nonrecrystallization region, rolling deformation makes austenite grain flat (i.e., pancaked shape) and causes the accumulation of dislocations inside austenite grain, evidenced by dislocation structures (Fig. 5). It is well recognized that austenite grain boundary and deformation bands (i.e., accumulation of dislocations) can act as the nucleation sites for the formation of strain induced (Ti, Mo)C precipitates during the rolling process from 1000 °C to 870 °C. The precipitation of a certain amount of 10∼20 nm (Ti, Mo)C precipitates can be attributed to the well-developed dislocation structure inside austenite grain which promotes the precipitation kinetics through the pipe diffusion along the dislocation core. Reference Dutta, Valdes and Sellars29,Reference Dutta, Palmiere and Sellars30 Such strain induced (Ti, Mo)C precipitates will grow during the remaining process with a help of pipe diffusion and bulk diffusion, and consequently become relative coarse precipitates (>10 nm). The selected (Ti, Mo)C particle [Fig. 8(b)] obeys an orientation relationship with the respect to the matrix: (100)(Ti, Mo)C//(100)α-Fe, [011](Ti, Mo)C//[012]α-Fe, which does not meet the B–N orientation relationship with respect to the matrix in ferrite. It indicates that the (Ti, Mo)C particle formed in austenitic phase region. On the one hand, strain induced precipitates usually have a size of several ten nanometers, while finer precipitates in ferrite have a size of <10 nm. Reference Yong23,Reference Kang31,Reference Lagneborg and Zajac32 On the other hand, the particles that contained more Ti atom and less Mo atoms indicating that they formed in the γ nonrecrystallization phase where Ti has a smaller solid solubility while Mo has a larger solid solubility. Based on these, it appears most likely that these larger precipitates were strain-induced precipitates in the austenite nonrecrystallization zone, corresponding well with the previous reports. Reference Pereloma, Crawford and Hodgson33,Reference Wang34
It is well known that interphase precipitation forms at γ/α interface during the γ to α transformation. The TEM images [Fig. 7(b)] and crystallographic information [Fig. 8(e)] indicate the rows of (Ti, Mo)C nucleate at γ/α interface and grow in ferrite, and that the carbides adopt the B–N orientation relationship ((100)(Ti, Mo)C//(100)α-Fe, [011](Ti, Mo)C//[010]α-Fe) with respect to the ferrite matrix. The result is consistent with that of the investigation for the interphase precipitation of V(C, N), Nb(C, N) and (Ti, Mo)C. Reference Yen, Chen, Huang and Yang7,Reference Wang, Sun, Yong, Li, Zhang and Jiang17,Reference Honeycombe and Mehl35,Reference Smith and Dunne36 In addition, a previous work Reference Duan, Cai, Wu and Tang13 showed that the average size of (Ti, Mo)C precipitated from the ferrite matrix was measured as 4.4 nm. This is consistent with the present result [Fig. 7(a)]. On the other hand, the atomic ratio of Ti to Mo for <10 nm precipitates is only 2.2 that is much lower than that of 10∼20 nm particles precipitated from the γ nonrecrystallization region. Thus, these tiny particles were formed during γ to α transformation. The formation of interphase precipitation needs several conditions as follows. First, the moving speed of γ/α interface should be slow enough such that there is enough time for MC particles nucleation at γ/α interface. Second, the interphase precipitation obtained in high strength low alloy steel is mainly attributed to a relatively high isothermal holding temperature (∼650 ± 30 °C). That is because a relatively high isothermal holding temperature can result in a slower γ/α transformation rate and increase the diffusivity of micro-alloyed elements such as Ti, V and Mo. Third, the existence of coarse carbides in matrix can enhance their surrounding diffusion characteristic through the accumulation of dislocations or lattice distortion. Reference Gladman2,Reference Dutta, Valdes and Sellars29,Reference Dutta, Palmiere and Sellars30 This can influence the precipitation feature of interphase precipitated carbides as follows: (a) interphase precipitation around coarse carbides becomes irregular; (b) the coarse carbides enables the interphase-precipitated fine carbides to gather in the vicinity of the coarse carbides. In addition, large parent austenite grains would slow the γ to α phase transformation more easily than fine grains, Reference Porter, Easterling and Sherif37 carbide particles have enough time to repeatedly heterogeneously nucleate at the γ/α interface and develop a common interface precipitation morphology. From the above aspects affecting the interphase precipitation, it is suggested that the influence factors of interphase precipitation are complicated. Finally, it should be noted that the row-like characteristic of the interphase precipitation cannot be seen unless the specimen is titled such that the incident electron beam direction is parallel to the sheet planes on which the carbides precipitated when under TEM observation.
2. The effect of (Ti, Mo)C precipitation on the microstructure evolution
The deformation condition of 1200∼1000 °C corresponds to the deformation in the γ phase recrystallization region, because the γ nonrecrystallization temperature is above 1000 °C (Fig. 1). Therefore, the recrystallization of austenite grains took place during the deformation process and effectively refined the austenite grain sizes. On the other hand, the deformation condition from 1000 °C to 870 °C corresponds to the deformation in the γ nonrecrystallization region, the accumulated strain inside the austenite grains which is in the form of heavy crystal defects (i.e., dislocations) can provide nucleation sites for the γ to α transformation and promoted the precipitation of strain induced (Ti, Mo)C carbides. These strain induced (Ti, Mo)C precipitates can retard the static recrystallization of austenite by hindering the dislocation movement and lead to higher strain hardening. Reference Wang, Sun, Yang, Yong, Zhang, Li and Weng38 Although the mass fraction of these 10∼20 nm particles precipitated from the γ nonrecrystallization is relatively small, only ∼20% (Fig. 6), these particles have an effect on refining the resultant ferrite grain by inhibiting the austenite recrystallization in the γ region. Based on the above, ferrites with a tiny grain size (∼2.3 μm) were achieved, which play a significant role in the grain refinement hardening (e.g., 360 MPa shown in Table II).
Although the formation of dislocation structures in the austenite grain during the rolling process give rise to strain induced precipitates with a relatively larger particle size of >10 nm, which weakens the interphase precipitation by consuming carbide formers, consequently impairing the precipitation hardening effect, these (Ti, Mo)C carbides precipitated from γ to α transformation or from the ferrite region still cause a relative larger precipitation hardening increment of about 324 MPa for sample 600 °C (Fig. 6). Furthermore, it should be noted that an excessive precipitation hardening may be harmful to the toughness of steel according to Kim et al. Reference Kim, Kim, Hong and Lee12 Therefore, to obtain a good combination of strength, ductility and toughness, the key point is how to balance the relationship between strain induced (Ti, Mo)C precipitates and (Ti, Mo)C precipitated from γ/α interface or the supersaturated ferrite matrix, namely to realize the maximum potential of (Ti, Mo)C precipitates during TMCP.
V. CONCLUSIONS
(1) With the coiling temperature increasing from 500 °C to 650 °C, UTS and YS first increased then decreased, but the variation in EL was minor. At coiling temperature of 600 °C, the investigated steel had the best mechanical properties: YS of 912 MPa, UTS of 971 MPa, and EL of 16%.
-
(2) The largest precipitation hardening increment was 324 MPa for sample 600 °C. This is presumably resulted from the high mass fraction 74.3% of uniform nano-sized precipitates with a size of <10 nm. In addition, grain refinement hardening was high to about 362 MPa because of fine grains with a size of 2.3 µm. The contributions of various strengthening factors were calculated at different CTs, and the calculated results of YS was in a good agreement with their experimental results. Precipitation hardening and grain refinement hardening were the main approaches to improve the strength, but the variation in YS can be attributed to the change in the contribution of precipitation hardening.
-
(3) There are two kinds of fine (Ti, Mo)C particles with different sizes in ferrite matrix at coiling temperature of 600 °C. One was the irregular particles with a size of 10∼20 nm, which obeyed orientation relationship with respect to the matrix: (100)(Ti, Mo)C//(100)α-Fe, [011](Ti, Mo)C//[012]α-Fe, and they are most likely to precipitate from γ the nonrecrystallization region; the other was spherical interphase-precipitated particles with a size of <10 nm formed from the α region, and they obeyed the Baker–Nutting (BN) orientation relationship with respect to the matrix: (100)(Ti, Mo)C//(100)α-Fe, [011](Ti, Mo)C//[010]α-Fe.
-
(4) Although strain induced (Ti, Mo)C precipitates possibly impair interphase precipitation or the (Ti, Mo)C from the supersaturated ferrite matrix, they play an vital role in refining grain size. The key is how to balance the relationship between strain induced (Ti, Mo)C precipitates and (Ti, Mo)C precipitated from γ/α interface or the supersaturated ferrite matrix, namely to realize the maximum potential of (Ti, Mo)C precipitation during TMCP.
ACKNOWLEDGMENTS
This research was financially supported by the National Basic Research Program of China (No. 2015CB654803), National Natural Science Foundation of China (No. 51201036), National Science and Technology Pillar Program (No. 2013BAE07B05), and Foundation of China Iron and Steel Research Institute Group.