I. INTRODUCTION
Mesoporous silica materials have been extensive research subjects due to their potential applications in the fields where porosity plays an important role. One such field is the development of controlled drug delivery matrixes.Reference Vallet-Regi, Balas and Acros1–Reference Rigby, Fairhead and van der Walle3 Unique combination of useful properties of mesoporous silica materials (stable pore structure and high surface area, easy surface modification by functionalized molecules and adjustable pore size, biocompatibility, biological inertness, etc.) makes them suitable carriers for different therapeutic applications. Efficient drug delivery systems allow improvement of therapeutic index and consumer properties of the drugs.
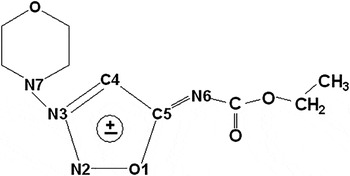
Molsidomine [N-(ethoxycarbonyl)-3-(4-morpholino)sydnonimine (Fig. 1)] is a drug possessing vasodilating and antiplatelet activity that is used clinically. We proposed that efficient silica carrier may improve its pharmacokinetic and consumer properties. The drug is a mesoionic compound containing five-member heterocycle and exhibits pseudoaromatic properties.Reference Badami4, Reference Yashunskii and Kholodov5 Therefore, π-π interaction should play an important role in adsorption of molsidomine. Phenyl-modified silica was used for liquid chromatography determination of sydnonimines in human plasma.Reference Streel, Ceccato, Peerboom, Zimmer, Sibenaler and Maes6 On the other hand, molsidomine molecules have a large dipole moment.Reference Badami4 So, their dipolar nature should favor strong hydrophilic interactions (e.g., electrostatic, ion-dipole, hydrogen bonding with participation of N and O atoms).Reference Luliński and Maciejewska7 The aim of this work was to elucidate the nature of interactions responsible for the adsorption process of molsidomine onto mesoporous silica particles to select optimal silica material for further development of the drug carrier. For this purpose, unmodified, aminopropyl-modified and phenyl-modified silica materials were synthesized and characterized. The adsorption studies were carried out from buffer solution at physiological pH. It is well known that, at this condition, unmodified silica particles are charged negativelyReference Iler8 and aminopropyl-modified ones are charged positively.Reference Kim, Seidler, Wan and Fill9 The mesoporous silica materials were synthesized by templated sol-gel synthesis. Monosaccharide D-glucose was chosen as template. Literature dataReference Wei, Xu, Dong, Dong, Qiu and Jansen-Varnum10, Reference Dong11 have showed that silica materials prepared with such biocompatible, low-cost pore-forming agents like various common sugars exhibit mesoporosity, high specific surface area, pore volume, and narrow pore distribution. In addition, the templates are readily removed from as-synthesized composites via simply washing with water at room temperature.
Molecular structure of molsidomine.

It is well known that surface modification of the materials can be achieved by two routes, grafting (post synthesis) and cocondensation (one-pot synthesis), and the modified materials synthesized through these two routes may have different surface properties, hence resulting in different adsorption properties.Reference Song, Hidajat and Kawi12, Reference Wang, Otuonye, Blair, Denton, Tao and Asefa13 Here a comparative study of adsorption of molsidomine on the silica mesoporous materials, whose surfaces were functionalized with judiciously chosen organic groups via post grafting or cocondensation, has been performed.
II. EXPERIMENTAL
A. Materials and reagents
Tetraethoxysilane (TEOS) (high purity grade, Russia), 3-aminopropyltriethoxysilane (APTES) (Aldrich, 99%, Germany), phenyltrimethoxysilane (PhTMOS) (Acros, 85%, Fair Lawn, NJ), D-glucose (ICN Biomedicals, >99% purity, Cleveland, OH), molsidomine (Sigma-Aldrich, Sofia, Bulgaria), were used without further purification. Sodium hydrogen phosphate and sodium dihydrogen phosphate (Russia, analytical grade) were used to prepare buffer solutions on the basis of doubly distilled deionized water (50 mM, pH = 7.4). Potassium bromide (Acros, 99+%, IR grade) was dried at 250 °C before use.
B. Syntheses
1. Synthesis of mesoporous materials via cocondensation
Unmodified silica was synthesized by acid-catalyzed hydrolysis and base-catalyzed polycondensation of TEOS in the presence of D-glucose as structure-forming agent as described in Ref. Reference Wei, Xu, Dong, Dong, Qiu and Jansen-Varnum10. The procedure of one-pot synthesis of phenyl-modified silica was similar to that described above. The phenyl functionality was introduced into the silica framework by the simultaneous addition of TEOS and PhTMOS in a molar ratio of 0.95:0.05.Reference Dong11 The as-synthesized samples were washed by hot water and centrifuged triply to remove D-glucose and then dried at in an oven at 120 °C overnight. The resulted samples of unmodified silica and phenyl-modified silica were denoted as UMS and PhMS-c, respectively.
2. Synthesis of modified mesoporous materials via grafting
For preparation of phenyl- or aminopropyl-grafted materials, 1.5 mL PhTMOS (or APTES) was added to an ethanolic suspension of unmodified silica particles (5 g in 150 mL). The suspension was stirred at room temperature for 20 h. The sample was finally centrifuged and washed two times in ethanol. The prepared-via-grafting phenyl- and APTES-modified silica samples were denoted as PhMS-g and AMPMS-g, respectively.
C. Methods of investigation
1. Fourier transform infrared spectroscopy measurements
Fourier transform infrared (FTIR) spectra of the synthesized silica materials both containing the templates and without them were recorded using an Avatar 360 FT-IR ESP spectrometer at room temperature. The spectra were recorded in the range of 4000 to 400 cm−1. The samples were examined as potassium bromide (KBr) disks.
2. N2 adsorption/desorption measurements
The N2 adsorption–desorption isotherms of the synthesized silica materials were measured using a Micromeritics ASAP 2010 analyzer (Micrometrics Inc., Norcross, GA) at −196 °C. Prior to measurement, the samples were degassed at appropriate temperature for overnight in vacuum. The surface area of the materials was calculated using Brunauer, Emmett, Teller (BET) equation, which is the most widely used model for determining the specific surface area. The total pore volume was estimated as liquid volume of adsorbate adsorbed at a relative pressure of 0.99. All surface area measurements were calculated from the nitrogen adsorption isotherms by assuming the area of the nitrogen molecule to be 0.162 nm2. The pore size distributions were plotted according to Barrett-Joyner-Halenda (BJH) method using desorption isotherms.
3. Scanning and transmission electron microscopy (SEM, TEM)
The scanning electron micrographs were taken using a SEM-100 L (Russia). Suspension of silica material in ethanol was sonicated for 10 min. The sample was deposited onto a carbon-coated support and sputtered with gold. Transmission electron microscopy (TEM) characterization was performed through a JEM-2010 electron microscope with an acceleration voltage of 200 kV.
4. Element analysis method
Carbon, hydrogen, nitrogen and oxygen contents of the samples were determined using a FlashEA 1112CHNS/O elemental analyzer (Carlo Erba Termoclas, Italy).
5. Adsorption experiments
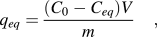
Typically, 0.3 g of the synthesized mesoporous silica and 67 mL of molsidomine solution in buffer (50 mM, pH = 7.4) were mixed and stirred for 5 h and after centrifugation for 15 min, the supernatant was analyzed with ultraviolet-visible (UV–Vis) absorption spectroscopy, by monitoring the major peak at 311 nm, which corresponds to the absorption maximum of molsidomine. The initial concentration of molsidomine was changed from 0.016·10−3 to 0.158 10−3 mmol/mL. The surface concentrations of the adsorbed molsidomine were calculated according to the equation
 $$<![CDATA[$$q_{eq} = {{(C_0 - C_{eq} )V} \over m}\quad,$$
where qeq is the surface molsidomine concentration (mmol/g), C 0 and Ceq are the bulk molsidomine concentrations before and after adsorption (mmol/mL), V is a volume (ml), and m is a mass of the adsorbent sample (g).
III. RESULTS AND DISCUSSION
A. Characterization of silica materials
1. FTIR analysis
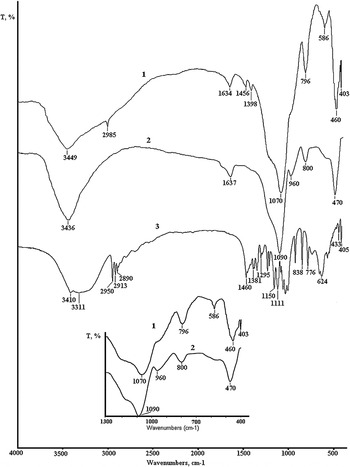
Traditionally mesoporous silica materials are prepared by sol–gel synthesis using different template molecules. In this work the synthesis of unmodified and phenyl-modified silica materials has been prepared with D-glucose as a pore-forming agent in the sol-gel reactions of TEOS or TEOS-PhTMOS precursor mixture using hydrochloric acid (HCl) as the catalyst for the prehydrolysis and sodium hydroxide (NaOH) as catalyst for the polycondensation. Then D-Glucose was removed by washing with water. As an example, Fig. 2 shows FTIR spectra of D-glucose and of both as-synthesized and water-washed samples of UMS.
FTIR spectra of as-synthesized (1), water-washed (2) silica samples and D-glucose (3).

As can be seen from Fig. 2, the spectrum of the as-synthesized sample (spectrum 1) exhibits the band at 2985 cm−1 asymmetrical C–H stretching modesReference Wei, Xu, Dong, Dong, Qiu and Jansen-Varnum10 of D-glucose alkyl groups and the band at 403 cm−1 which is characteristic for the template.Reference Yang, Weng, Ferraro and Wu14, Reference Zhbankov, Andrianov, Ratajczak and Marchewka15 Disappearance of the indicated bands in the spectrum of the washed sample (spectrum 2) testifies about removal of the organic templates from the silica matrix. Changes in the spectrum of phenyl-modified silica are analogous.
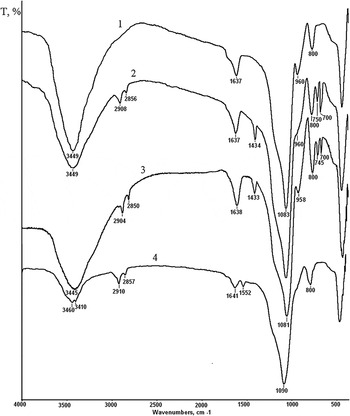
The incorporation of the functional groups in silica matrix was proved by the FTIR spectra presented in Fig. 3. The spectra of the phenyl-modified silica samples (prepared by both cocondensation and grafting) (spectra 2 and 3) show additional bands emerging at 2908–2850, 1434, 750–745, and 700 cm−1 which can be assigned to asymmetrical and symmetrical C–H stretching modes,Reference Wei, Xu, Dong, Dong, Qiu and Jansen-Varnum10, Reference Slade, Bambrough and Williams16 C–H deformation mode,Reference Slade, Bambrough and Williams16 phenyl out-of-plane C–H deformation mode.Reference Slade, Bambrough and Williams16 The spectrum of the aminopropyl-modified silica (spectrum 4) also exhibits the bands at 2910 and 2857 cm−1 assigned to C–H stretching modes and a new band 1552 cm−1 appears. The band can be assigned to N–H deformation mode of NH2 groups.Reference Song, Hidajat and Kawi12, Reference Kitadai, Yokoyama and Nakashima17 So, the FTIR spectra testify about successful modification of the silica surface.
FTIR spectra of unmodified silica (UMS)(1), phenyl-modified silica prepared by cocondensation (PhMS-c) (2), phenyl-modified silica prepared by grafting (PhMS-g) (3) and aminopropyl-modified silica prepared by grafting (AMPMS-g).

2. Elemental analysis data
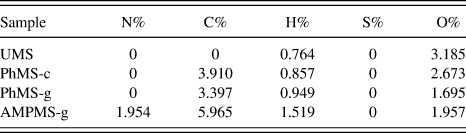
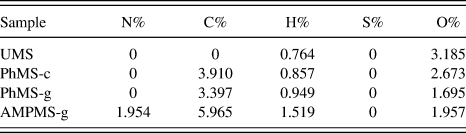
The data of elemental analysis of the prepared samples presented in Table I also qualitatively confirm the modification of the silica surface by phenyl and amino groups.
Elemental analysis data.
3. Pore structure characterization
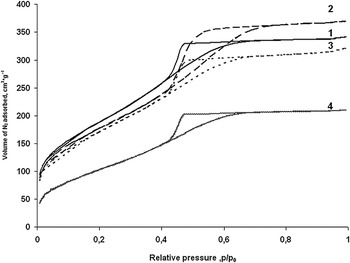
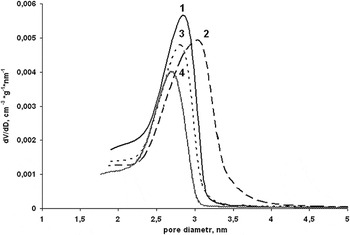
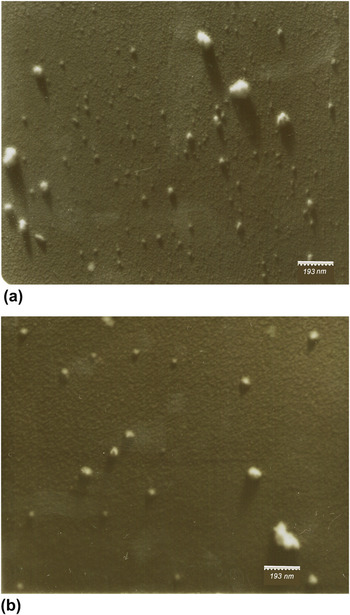
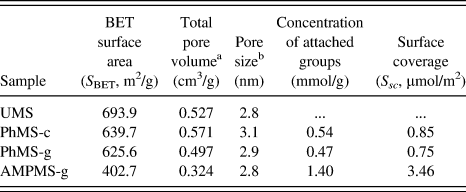
Physical structure of materials (surface area, pore volume, etc.) is one of the major reasons for their effectiveness as adsorbents. It is therefore necessary to accurately characterize the physical nature of the synthesized materials. Figure 4 provides a comparison of nitrogen adsorption isotherms of the synthesized samples. The isotherms of all samples synthesized by grafting as well as by cocondensation show typical type IV adsorption isotherms with H2 hysteresis loops, which are characteristic of mesoporous materials as defined by International Union of Pure and Applied Chemistry (IUPAC).Reference Sing, Everett, Haul, Moscou, Pierotti, Rouquerol and Siemieniewska18 The sharp nitrogen condensation step at P/P0 from 0.4 to 0.65 indicates on narrow pore size distribution (Fig. 5) and a highly ordered pore system. The specific surface area and pore sizes and volumes of the materials are reported in Table II. The data reveal that the modified silica materials exhibit lower surface areas. The highest decrease of surface area and pore volume is observed for the AMPMS-g. The initial surface area of 694 m2/g for the UMS is decreased by about 42%, i.e., to 403 m2/g for the modified silica. From the literature a significant decrease in BET surface area, pore volume and pore size for amino-modified silica materials in comparison to the original ones is known.Reference Wang, Otuonye, Blair, Denton, Tao and Asefa13, Reference Rosenholm and Lindén19 Similar behavior was observed for other organic-functionalized mesoporous silicas. This may be attributed to the partial collapse of the mesopore domains and the occupation of the functional groups in the mesopore channels which leads to less available space for adsorbed nitrogen. It should be noted that the highest decrease in parameters of porous structure for the aminopropyl-modified silica in comparison with the phenyl-modified ones might be associated with amount of the functional groups attached to the UMS silica surface. From element analysis data the concentration of the attached functional groups (C, mmol/g) and surface coverage (Ssc, mmol/m2) for the prepared silica materials were calculated according toReference Hughes20 and are presented in Table II. As can be seen from Table II, the surface coverage by the aminopropyl groups is about four times larger than that by the phenyl groups. Besides, the lower specific surface area of the AMPMS-g in comparison with the PhMS-g may be resulted from a smaller particle size of the latter material. This is confirmed by SEM images of the grafted silica materials presented in Fig. 6. Both samples are composed of relatively uniform, round particles and their aggregates. However, as can be seen from the SEM images, the particle size of PhMS-g is smaller than that for AMPSM-g sample.
Nitrogen adsorption/desorption isotherms for UMS (1), PhMs-c (2), PhMS-g (3), and AMPMS-g (4).

Pore size distribution for UMS (1), PhMs-c (2), PhMS-g (3), and AMPMS-g (4).

SEM images of PhMS-g sample (a) and AMPMS-g sample (b).

Parameters of porous structure and concentration of attached functional groups for synthesized silica materials.
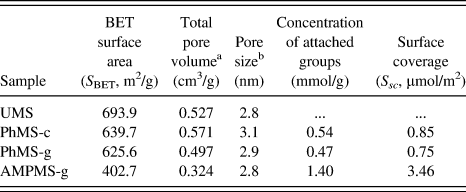
a The single point pore volume determined at P/P0≈ 1.
b Pore diameter according to the maximum of the BJH pore size distribution calculated from the desorption branch of the isotherm.
B. Adsorption of molsidomine on silica materials
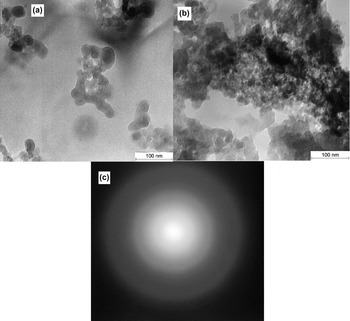
For the silica materials synthesized by cocondensation TEM images are presented in Fig. 7. As can be seen from Figs. 7(a) and 7(b) the samples show a morphology consisting of aggregated and essentially round particles. The particle size is about 20–30 nm. Wide diffracting rings and the absence of reflections typical for crystalline systems [Fig. 7(c)] testify about amorphous state of UMS. The analogous results were obtained for the other samples (not shown). It should be noted that according to the TEM images the modification of the silica surface by phenyl groups via cocondensation has no strong influence on the morphology of the silica material.
TEM images of UMS (a) and PhMS-c (b) and diffraction pattern of UMS (c).

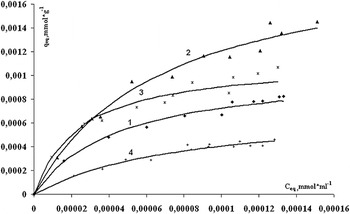
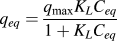
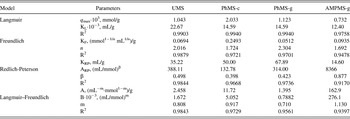
The adsorption isotherms of molsidomine on the synthesized silica materials are presented in Fig. 8. The experimental results were fitted with the well-known models of Langmuir, Freundlich, Redlich–Peterson, and Langmuir–Freundlich (Sips).Reference Aksu, Idil Tatli and Tunc21 All the correlation coefficient, R2 values, and the constants obtained from the models are summarized in Table III. By comparing the correlation coefficients (R2) values for the four models, it can be inferred that Langmuir model is better than others in describing the adsorption of molsidomine on the silica materials indicating the adsorption process is mainly a monomolecular layer adsorption. The maximum adsorption capacity (q max) of the silica materials in relation to molsidomine obtained by Langmuir isotherms is decreased in the following order:
 $${\rm{PhMS {\hbox-} c > PhMS {\hbox-} g > UMS > AMPMS {\hbox-} g}}{\rm{\quad.}}$$
Adsorption isotherms of molsidomine on the silica materials: UMS (1), PhMs-c (2), PhMS-g (3), and AMPMS-g (4).

Isotherm parameters obtained by fitting equilibrium data with the Langmuir, Freundlich, Redlich–Peterson, and Langmuir–Freundlich isotherms for the adsorption of molsidomine on silica materials.
The adsorption capacity depends on different factors such as physical parameters of the silica surfaces, concentration and arrangement of the attached functional groups, chemistry of the surfaces. To exclude the effect of surface area of the silica materials, the q max values per unit surface area were calculated and found to be decreasing in the order:
 $${\rm{PhMS{\hbox-}c > }}\,\,{\rm{PhMS{\hbox-} g}}\, \approx {\rm{AMPMS{\hbox-}g > UMS}}{\rm{\quad.}}$$
As can be seen from the order, the silica adsorbents functionalized by aromatic groups exhibit a higher adsorption capacity for molsidomine in comparison to the materials with hydrophilic surface groups. So, this confirms a well-known fact that the adsorption capacity of the silica materials is affected by the nature of the surface functional groups. The difference in adsorption capacity of the phenyl-modified silica materials under study may be explained by different surface cover of the samples. As can be seen from the data presented in Table II, the surface cover of PhMS-c sample is slightly higher than that of PhMS-g sample.
The adsorption of molsidomine represents a reversible process:
 $${\rm{molsidomine \,\,in \,\,solution\,\, }} \leftrightarrow \,\,{\rm{ molsidomine \,\,on \,\,silica \,\,surface\quad,}}$$
which is characterized by apparent equilibrium constant. The constant is the ratio of the concentration of molsidomine on the silica surface (qeq) to the concentration of molsidomine in solution (Ceq). The standard thermodynamic equilibrium constant, K, can be calculated as
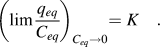 $$<![CDATA[$$\left( {\lim {{q_{eq} } \over {C_{eq} }}} \right)_{C_{eq} \to 0} = K\quad.$$
The Gibbs free energy, ∆adsG 0, for the adsorption process was determined as
 $$<![CDATA[$$\Delta _{ads} G^0 = - RT\,\ln \,K\quad.$$
The values of ∆adsG 0 for molsidomine adsorption on the synthesized silica materials are given in Table IV. The negative values of ∆adsG 0 indicate that the adsorption of molsidomine on the synthesized materials is a spontaneous process, whereby no energy input from outside of the system is required. It should be noted that values of ∆adsG 0 are increased (become less negative) in the following order:
 $${\rm{PhMS{\hbox-} g < PhMS {\hbox-}c\, <\, UMS\, <\, AMPMS {\hbox-}g\quad,}}$$
Gibbs free energy for adsorption of molsidomine onto different silica materials.

i.e., the adsorption process has become less favorable.
The aminopropyl-modified silica sample (AMPMS-g) exhibits the lowest ∆adsG 0 value whereas the unmodified silica sample (UMS) shows a higher affinity. It is well known that at pH = 7.4 unmodified silica surface is negatively charged due to deprotonation of silanol groups and formation of ionized ≡SiO− groups.Reference Iler8 In contrast, the aminopropyl-modified silica surface is positively charged as a result of the protonation of aminopropyl groups at this condition.Reference Kim, Seidler, Wan and Fill9 So, the adsorption of molsidomine on the negatively charged particles is more favorable than on the positively charged ones. It is likely that the interactions of electrostatic nature (for example, ion-dipole interaction) are responsible for the adsorption. Formation of hydrogen bonds between the adsorbents and the adsorbate cannot be excluded.
The adsorption of molsidomine on the phenyl-modified silica samples is the most favorable process. It is reasonable to assume that this phenomenon is mainly attributed to the effective π-π stacking interaction between phenyl groups of the silica sample and aromatic heterocycle of molsidomine molecules. An important role of π-π stacking interactions at adsorption of anticancer drugs on carbon nanotubes has been emphasized by Chen et al.Reference Chen, Pierre, Hea, Tanc, Pham-Huyd, Honga and Huang22 and Liu et al.Reference Liu, Fan and Rakhra23 The adsorption of benzene on phenyl-SBA-15 adsorbents reported inReference Hu, Li, Hao, Li and Qiao24 was explained by strong interactions between π-electron systems of the phenyl groups of the silica and benzene molecules. The grafted phenyl-modified silica (PhMS-g) exhibits a higher affinity to molsidomine than the phenyl-modified sample prepared via cocondensation (PhMS-c). It is often proposed that grafting leads to an accumulation of anchored groups on the external particle surface and at the pore entrances.Reference Brühwiler25 Although the surface cover of PhMS-c sample is slightly higher than that of PhMS-g sample, desolvation of such groups should entail lesser energy expenses than that of the groups located at the internal pore surface. So, the interaction of molsidomine molecules with the phenyl groups of the grafted sample is energetically more favorable in comparison with the phenyl-modified sample prepared via cocondensation.
Besides different localization of the surface phenyl groups, different ratio of the phenyl to hydroxyl groups may play a specific role. It should be remember that besides the phenyl groups, PhMS-c and PhMS-g samples contain a number of free hydroxyl groups due to incomplete modification of their surfaces. As has been proposed by Darga et al.,Reference Darga, Kecht and Bein26 the surface of PhMS-c bears a larger number of free hydroxyl groups than the grafted sample. The combination of these two factors would result in a lower affinity of PhMS-c in comparison with PhMS-g. It should be noted that one more type of interaction might be contribute to ∆adsG 0. It is (OH)/π hydrogen bonding between the adsorbents and the adsorbate.Reference Parida, Dash, Patel and Mishra27 However this is unlikely to be a dominant bonding mode, for reasons of stereochemistry and these interactions cannot contribute significantly to the adsorption energy of molsidomine on the synthesized silica materials.
Thus, it can be concluded that molsidomine exhibits the highest affinity to the silica particles modified by phenyl groups. It is likely that the interaction between π-electron systems of molsidomine and the surface phenyl groups of the silica materials is mainly responsible for the drug adsorption.
IV. SUMMARY
The mesoporous silica materials, unmodified and modified by aminopropyl and phenyl groups, were synthesized via cocondensation and grafting routes. The adsorption properties of the silica materials for mesoionic compound molsidomine from buffer solution (pH 7.4) were investigated. The experimental equilibrium data were fitted to the Langmuir, Freundlich, Redlich–Peterson and Langmuir–Freundlich (Sips) models. All silica materials are best fitted by Langmuir model in accordance with the linear correlation coefficients (R2). It has been found that the adsorption of molsidomine onto the synthesized materials is spontaneous process. The adsorption of molsidomine was found to be dependent on chemistry of surface of the silica materials. The phenyl-modified silica samples are the best adsorbents for molsidomine. They exhibit the highest adsorption capacity and the strongest binding energy in relation to this mesoionic compound due to prevailing π-π interaction between aromatic systems of the adsorbent and the adsorbate. The interactions of electrostatic nature result in weaker adsorption of molsidomine onto the silica materials.