Clostridium difficile infections (CDI) are commonly reported healthcare-associated infections (HAIs) in U.S. healthcare facilities with ∼290,000 illnesses and ∼27,000 associated patient deaths occurring in 2011.Reference Lessa, Mu and Bamberg1 Antibiotic exposure is the primary risk factor for CDI; it can increase a patient’s risk for infection both during and after antibiotic use.Reference Seekatz and Young2, Reference Leffler and Lamont3 Patients that develop CDI can shed spores into their environment during the acute phase of their illness and in convalescence.Reference Sethi, Al-Nassir, Nerandzic, Bobulsky and Donskey4 At either time, patients may receive care at multiple healthcare facilities. Therefore, CDI prevention measures among healthcare facilities that share patients can affect CDI incidence across the healthcare continuum. Guidelines from the Infectious Diseases Society of America (IDSA) and Society for Healthcare Epidemiology of America (SHEA) recommend that healthcare facilities implement multiple strategies to prevent CDI, such as antibiotic stewardship programs (ASPs) and infection control practices.Reference McDonald, Gerding and Johnson5 Additionally, the Centers for Disease Control and Prevention (CDC) recommends that public health departments engage networks of healthcare facilities with a shared patient population in coordinated initiatives to prevent the interfacility spread of antibiotic-resistant organisms and CDI.Reference Slayton, Toth and Lee6
Previous studies demonstrated that patient sharing among healthcare facility networks in Orange County (OC), California, contributed to the burden of CDI and other antibiotic-resistant infections in the region.Reference Lee, McGlone and Song7–Reference Simmering, Polgreen, Campbell, Cavanaugh and Polgreen9 Based on unpublished analyses of National Healthcare Safety Network (NHSN) data, the California Department of Public Health (CDPH) Healthcare-Associated Infection (HAI) Program identified elevated CDI incidence in Orange County compared with state levels. For these reasons, the HAI Program and the Orange County Health Care Agency convened a CDI prevention collaborative from June 2015 through June 2016 with hospitals and skilled nursing facilities (SNFs) in Orange County. The goal of the collaborative was to implement a coordinated, regional initiative that reduced CDI incidence by strengthening infection control and ASP practices among Orange County healthcare facilities. To evaluate the impact of the collaborative, we used a controlled, interrupted time series design to assess changes in monthly hospital-onset (HO) and community-onset (CO) CDI rates among participating and nonparticipating short-stay acute-care hospitals (ACH).
Methods
Collaborative format
We invited all 34 hospitals and 76 SNFs in Orange County to participate in the collaborative. Participants were asked to obtain support from their facility’s leadership team and to sign a commitment form prior to the start of the collaborative.
Representatives from participating hospitals were invited to attend 5 in-person learning and discussion sessions at the Orange County Health Care Agency during the collaboration period (June 2015–June 2016). The professional backgrounds of individuals who attended these sessions included infection control practitioners, hospital and facility administrators, environmental services staff, nurses, pharmacists, and quality control professionals. Each session included an educational presentation followed by facilitated breakout group discussions and information sharing among participants. Session topics included an overview of CDI epidemiology, pathogenesis, and evidence-based prevention strategies; ASP strategies targeting CDI prevention; environmental cleaning and disinfection strategies; and using National Healthcare Safety Network (NHSN) data reporting and analysis for prevention. The information provided during the learning and discussion sessions were developed largely from CDC, IDSA, and SHEA best practice recommendations; content delivered during the learning and discussion sessions can be found on the HAI program’s website (www.cdph.ca.gov/hai).
All participating facilities were offered an onsite infection control assessment by CDPH HAI program infection preventionists. Onsite assessments were completed in a single-day visit during the first 3 months of the collaborative to identify each facility’s strengths and areas of infection control practice that needed improvement. The assessment reviewed facilities’ current CDI policies and practices through a series of interviews with key personnel and direct observation (ie, adherence monitoring) of hand hygiene, contact precautions, and environmental cleaning and disinfection practices. Following the assessment, each facility received a feedback report with tailored recommendations for process improvements. Abbreviated versions of the standardized assessment tools were made available for internal use by the facilities. We collected infection control assessment data from internal reviews at the end of the collaborative to measure changes in CDI prevention strategy implementation.
With input from collaborative participants, the HAI Program and Orange County Health Care Agency developed an interfacility patient transfer communication tool and local process for improving communication between healthcare facilities when patients with CDI were transferred. The Orange County Health Care Agency distributed a letter to all Orange County healthcare facilities in December 2015 specifying that pertinent patient information be shared during every patient transfer within the county.
Evaluation
We assessed changes in HO-CDI and CO-CDI rates using data reported by ACHs from facilitywide inpatient locations to CDPH via NHSN. The NHSN surveillance and reporting guidelines for CDI are described elsewhere.10 CDI are designated as CO-CDI or HO-CDI based on the number of days after admission that a stool specimen is collected: CO-CDI if collected on days 1, 2, or 3 of admission or HO-CDI if collected >3 days after hospital admission. Community-onset, healthcare facility-associated CDI cases were excluded from the analysis.
We hypothesized that improved infection control and antimicrobial stewardship practices derived from participation in the collaborative would reduce CDI transmission within participating facilities. Additionally, we hypothesized that decreased CDI transmission within participating facilities along with improved communication between facilities countywide might reduce CO-CDI rates in Orange County. Therefore, we assessed changes in CO-CDI among all Orange County ACHs to account for direct and indirect effects of the collaborative.
We used an interrupted time series design to measure level and rate changes in monthly HO-CDI and CO-CDI rates from 2014 to 2017.Reference Schweizer, Braun and Milstone11 The baseline period comprised 17 months (January 2014–June 2015) prior to the collaborative, and the follow-up comprised 28 months (September 2015–December 2017) after the start of the collaborative. We included a 3-month lag period in the analysis from June through August 2015 to reflect the period during which onsite infection control assessments were conducted. To make causal inferences about the effects of the collaborative, we included ACHs from 3 San Francisco Bay Area counties (ie, San Francisco, San Mateo, and Santa Clara) in the analysis. We used San Francisco Bay Area ACHs as comparators because of their geographic separation from Orange County. Population estimates for Orange County and the 3 San Francisco Bay Area counties were similar at 3.2 million and 3.5 million residents, respectively, in 2015.12
Analysis
We excluded long-term acute-care (LTAC) hospitals, children’s hospitals, and SNFs from the analysis. These facility types have unique risk factors for HO-CDI that necessitate a stratified modeling approach.13 Due to sample size limitations, additional models could not be developed.
We developed 2 generalized linear mixed models to perform segmented regression on HO-CDI and CO-CDI rates for ACHs.Reference Gebski, Ellingson, Edwards, Jernigan and Kleinbaum14 The main effects for both models included 3 time-specific terms (ie, month, collaborative, and collaborative month) and an indicator for participation status. These terms allowed for segmentation of rates over time and were set to interact with participation status to allow for effect estimates specific to the groups: participating ACHs, nonparticipating ACHs, and the differences between participating and nonparticipating ACHs. The main effect estimates of interest for the 3 groups consisted of (1) the baseline rate trend; (2) the level change in rate immediately following collaborative implementation in September 2015; (3) the change in rate trend between the baseline and follow-up periods; and (4) the follow-up rate trend. To evaluate the impact of the collaborative, we focused on the difference between participating and nonparticipating ACHs for the level change in rate immediately following collaborative implementation and the change in rate trend between the baseline and follow-up periods.
We included the following covariates in the HO-CDI model, in accordance with CDC’s CDI risk-adjustment model for standardized infection ratio calculations: CDI test method (nucleic acid amplification test, enzyme immunoassay, other); inpatient CO-CDI rate; medical school affiliation; number of intensive care unit (ICU) beds; and hospital bed size.13 We evaluated CDI test method, medical school affiliation, and hospital bed size as confounders in the CO-CDI model. ACHs report the CDI test method used in their facility on a quarterly basis to NHSN; we captured changes in CDI test methods over time in both HO-CDI and CO-CDI models, as reported by each ACH.
We assumed a negative binomial distribution for the HO-CDI model and offset HO-CDI counts by monthly patient days to assess changes in HO-CDI rates. We also assumed a negative binomial distribution for the CO-CDI model and offset CO-CDI counts by monthly hospital admissions to assess changes in CO-CDI rates. For both HO and CO models, we included a random intercept to account for variation in baseline rates among ACH. We assessed each model for first-order positive and negative autocorrelation of error terms via the Durbin-Watson statistic. Both models had significant, first-order autocorrelation. We specified a first-order autoregressive correlation structure for monthly residual effects by facility for the HO-CDI and CO-CDI models. We used the classical sandwich estimator to generate standard errors more robust against correlation structure misspecification. Mean marginal values were used to estimate summary incidence rate ratios (IRRs). Statistical significance was defined as P < .05. All analyses were performed with SAS version 9.4 software (SAS Institute, Cary, NC).
The CDI collaborative met the criteria for nonresearch activity as a program evaluation and did not require an exemption determination from the California Committee for the Protection of Human Subjects.
Results
Overall collaborative participation comprised 15 ACHs, 3 LTAC hospitals, 1 children’s hospital, and 20 SNFs. This represented 56% of hospitals (19 of 34) and 26% of SNFs (20 of 76) in Orange County.
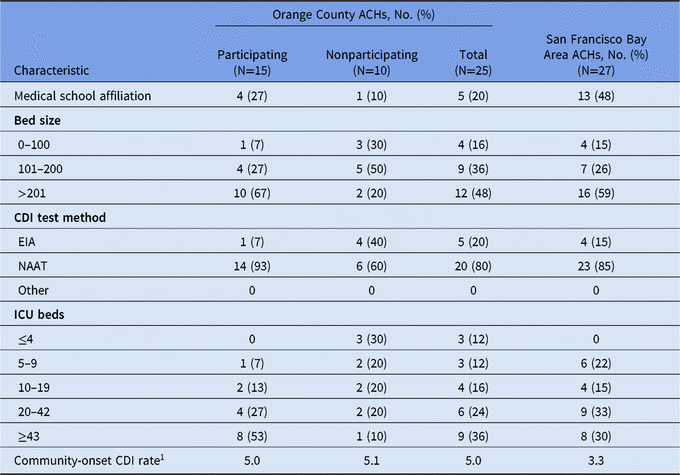
The distributions of ACHs between Orange County (N = 25) and the San Francisco Bay Area (N = 27) were similar across all hospital characteristics except medical school affiliation (Table 1); 13 San Francisco Bay Area ACHs (48%) were affiliated with a medical school compared with 5 Orange County ACHs (20%).
Characteristics of Short-Stay Acute-Care Hospitals (ACHs) by Participation Status and Region

Note. Data reflect hospital characteristics at the start of the collaborative in June 2015. EIA, enzyme immunoassay; NAAT, nucleic acid amplification test; ICU, intensive care unit.
1 Community-onset CDI rate is reported per 1,000 hospital admissions.
All participant facilities, except 2 SNFs, had an onsite infection control assessment and received tailored feedback. The most common CDI prevention gaps among participating ACHs that received a baseline onsite assessment and returned a self-assessment at the end of the collaborative (N = 12) included implementing laboratory-based alert systems for immediate notification of clinical staff regarding positive CDI test results; implementing a policy for hand hygiene with soap and water before exiting the room of a patient with CDI; and tracking antibiotic use associated with CDI (Supplemental Tables A and B online). Participating ACHs reported progress in these areas after completing a postcollaborative self-assessment survey.
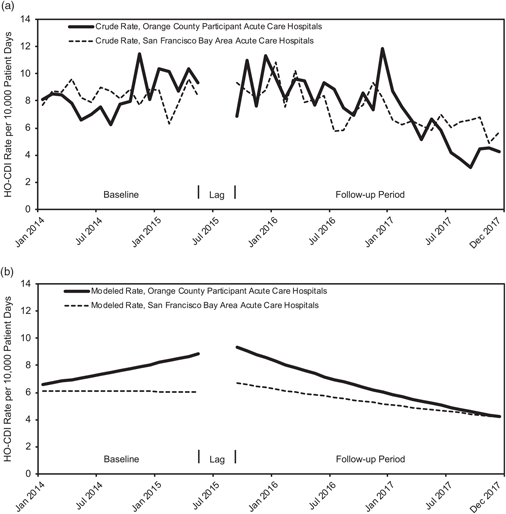
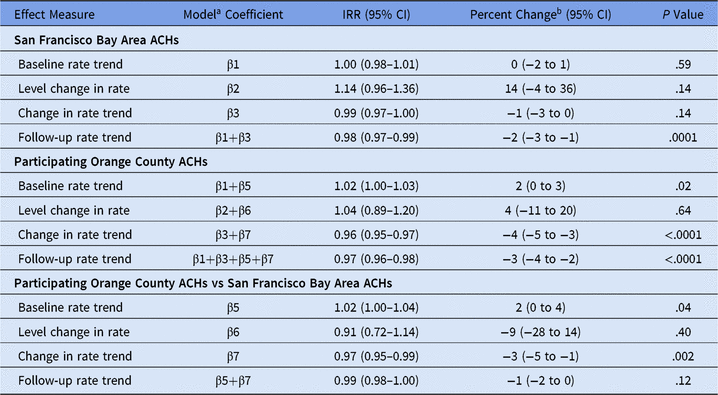
At the start of the baseline period, unadjusted rates of HO-CDI were ∼8.1 cases per 10,000 patient days for the participating Orange County ACHs (N = 15) and ∼7.7 cases per 10,000 patient days for the San Francisco Bay Area ACHs (N = 27) (Fig. 1). HO-CDI rates increased significantly by 2% (IRR, 1.02; 95% CI, 1.00–1.03; P = .02) per month among participating Orange County ACHs during the baseline period; baseline HO-CDI rates did not change among San Francisco Bay Area ACHs (IRR, 1.00; 95% CI, 0.98–1.01; P = .59) (Table 2). The HO-CDI change in rate trend among participating Orange County ACHs decreased by 4% (IRR, 0.96; 95% CI, 0.95–0.97; P < .0001) per month comparing the follow-up period to baseline. No corresponding change was observed among San Francisco Bay Area ACHs (IRR, 0.99; 95% CI, 0.97–1.00; P = .14). The difference between Orange County ACHs and San Francisco Bay Area ACHs for the change in rate trend was significant (IRR, 0.97; 95% CI, 0.95–0.99; P = .002). At the end of the follow-up period, unadjusted HO-CDI rates were ∼4.2 cases per 10,000 patient days for participating Orange County ACHs and 5.7 cases per 10,000 patient days for San Francisco Bay Area ACHs (Fig. 1).
Monthly hospital-onset Clostridium difficile infection (CDI) rates among short-stay acute-care hospitals by region. Breaks in monthly rates reflect a 3-month lag period (June–August 2015) included the analysis. Participating Orange County acute-care hospitals (N = 15); San Francisco Bay Area acute-care hospitals (N = 27). Note. HO, hospital-onset.

Incidence Rate Ratios (IRR) and Percent Change in Hospital-Onset Clostridium difficile Infection (HO-CDI) Rates Among Short-Stay Acute-Care Hospitals (ACHs) by Region and Participation Status

Note. The hospital-onset CDI model was adjusted for CDI test method, number of ICU beds, hospital bed size, medical school affiliation, and community-onset CDI rate.
a HO-CDI model: ln(λ) = β0(intercept) + β1(month) + β2(collaborative) + β3(collaborative month) + β4(participation) + β5(month × participation) + β6(collaborative × participation) + β7(collaborative month × participation) + β8(CDI test method) + β9(no. of ICU beds) + β10(inpatient community-onset CDI rate); λ = monthly incidence rate. A random intercept was included to account for variation in baseline rates between facilities; a first-order autoregressive covariance structure was specified to account for within-facility monthly residual effects.
b Percent change = (IRR – 1) × 100.
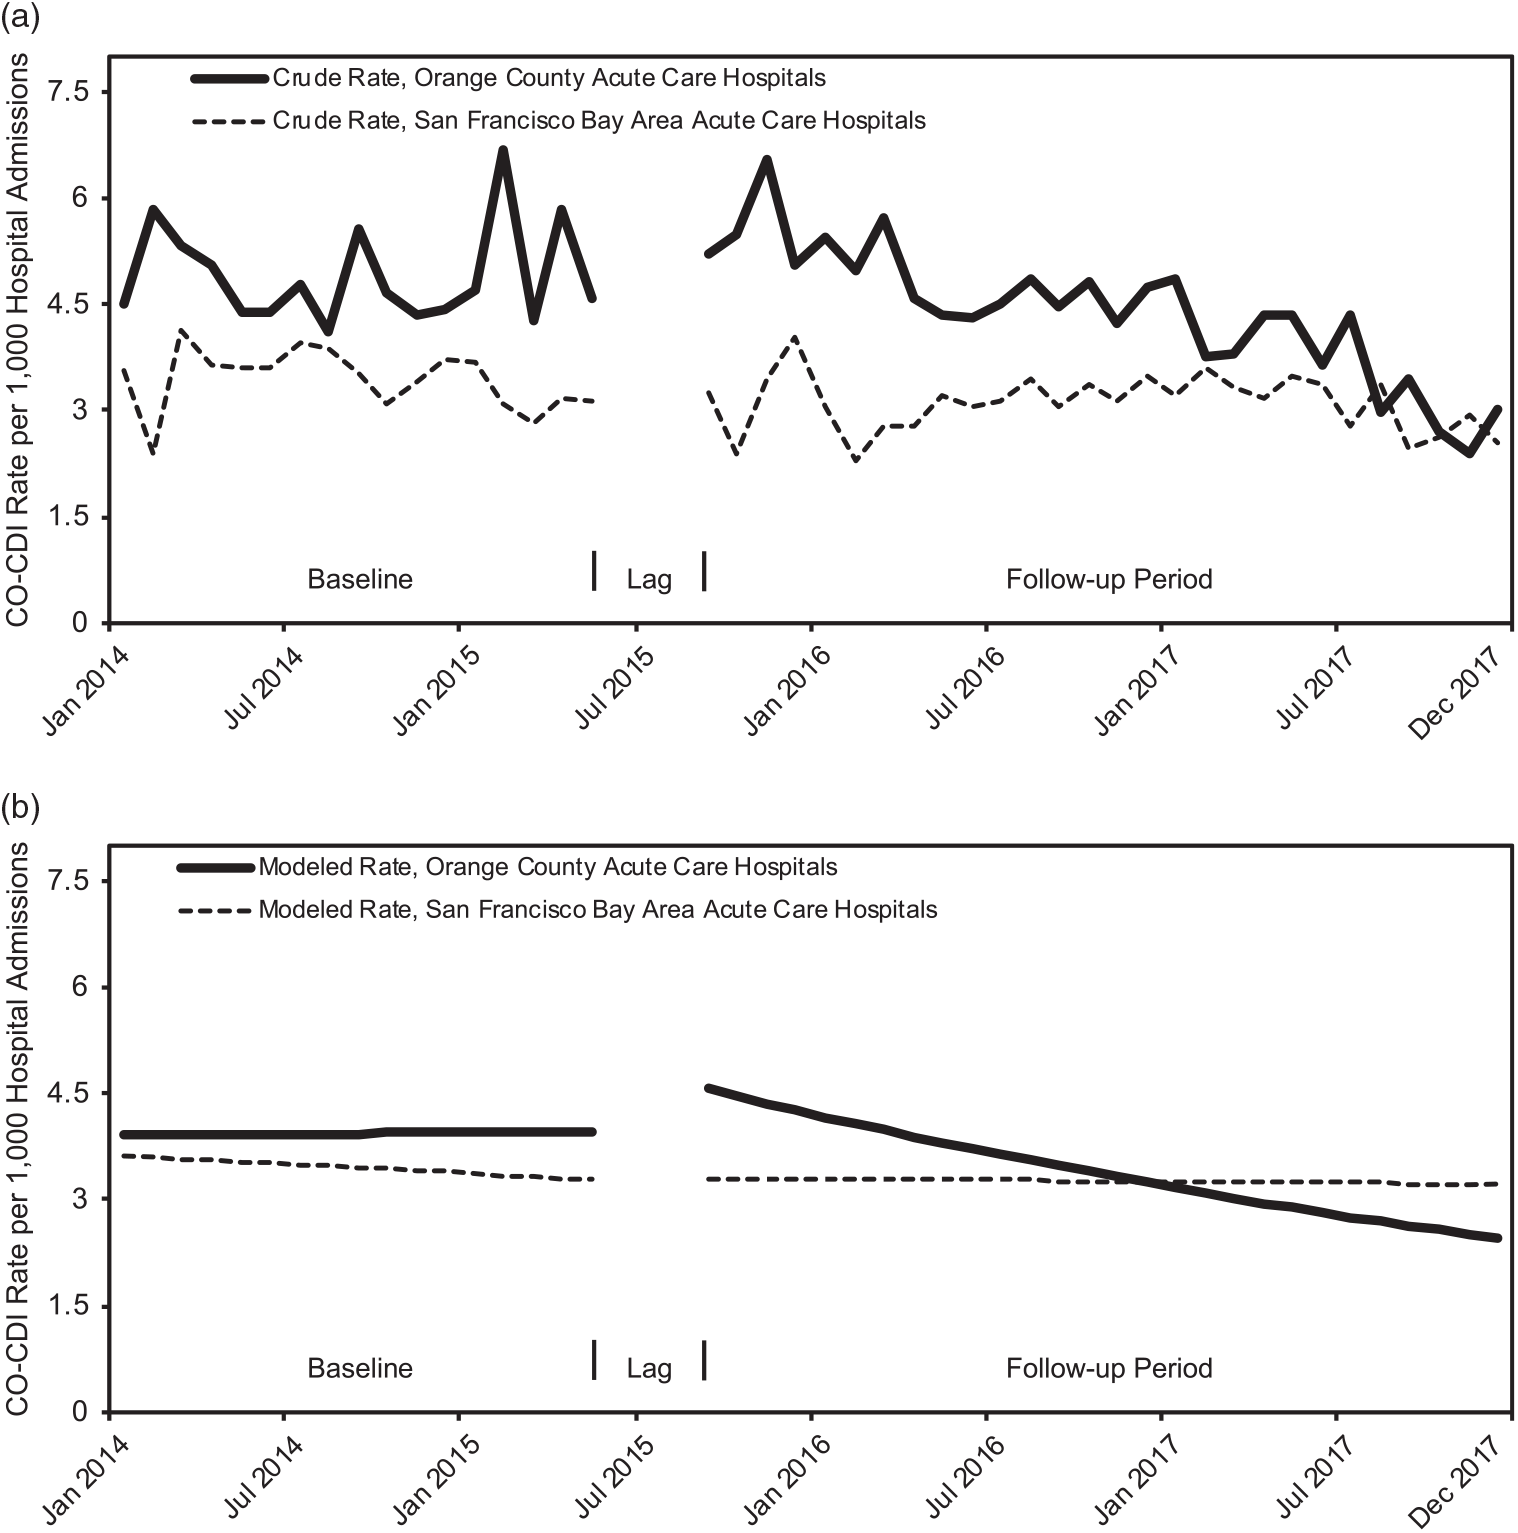
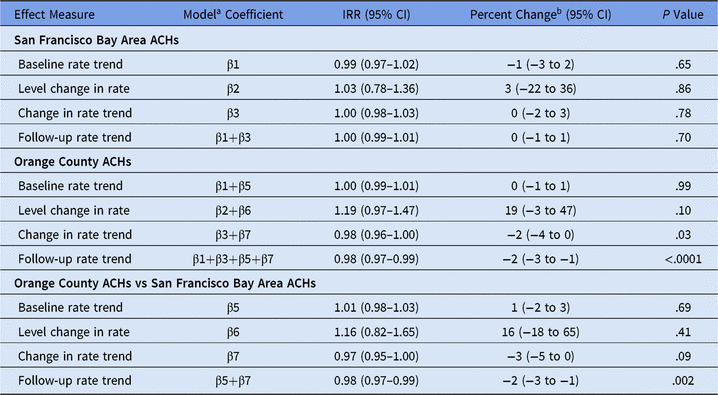
Unadjusted CO-CDI rates were ∼4.5 cases per 1,000 hospital admissions among participating Orange County ACHs (N = 25) and ∼3.6 cases per 1,000 hospital admissions for San Francisco Bay Area ACHs (N = 27) at the start of the baseline period (Fig. 2). The final CO-CDI model was adjusted for CDI test method and hospital bed size. The CO-CDI change in rate trend among Orange County ACHs decreased by 2% (IRR: 0.98, 95%CI: 0.96, 1.00; P = 0.03) per month during the follow-up period compared to baseline; no corresponding change was observed among San Francisco Bay Area ACHs (IRR, 1.00; 95% CI, 0.98–1.03; P = .78) (Table 3). The difference between Orange County ACHs and San Francisco Bay Area ACHs for the change in rate trend was not significant (IRR, 0.97; 95% CI, 0.95–1.00; P = .09). At the end of the follow-up period, unadjusted CO-CDI rates were ∼3.0 cases per 1,000 hospital admissions for Orange County ACHs and 2.5 cases per 1,000 hospital admissions for San Francisco Bay Area ACHs (Fig. 2).
Monthly community-onset Clostridium difficile infection (CDI) rates among short-stay acute care hospitals by region. Breaks in monthly rates reflect a 3-month lag period (June–August 2015) included the analysis. Orange County acute-care hospitals (N = 25); San Francisco Bay Area acute-care hospitals (N = 27). Note. CO, community-onset.

Incidence Rate Ratios (IRRs) and Percent Change in Community-Onset Clostridium difficile Infection (CO-CDI) Rates Among Short-Stay Acute-Care Hospitals (ACHs) by Region

Note. The community-onset CDI model was adjusted for CDI test method and hospital bed size.
a CO-CDI model: ln(λ) = β0(intercept) + β1(month) + β2(collaborative) + β3(collaborative month) + β4(participation) + β5(month × participation) + β6(collaborative × participation) + β7(collaborative month × participation) + β8(CDI test method) + β9(hospital bed size); λ = monthly incidence rate. A random intercept was included to account for variation in baseline rates between facilities; a first-order autoregressive covariance structure was specified to account for within-facility monthly residual effects.
b Percent change = (IRR – 1) × 100.
Discussion
Following implementation of a regional, coordinated CDI prevention collaborative in Orange County, California, we observed a statistically significant 4% monthly decrease in HO-CDI rates among collaborative participant ACH during the follow-up period compared with the baseline period. Furthermore, in evaluating the impact of the collaborative, we observed a statistically significant 3% monthly decrease between baseline and follow-up HO-CDI rates among participating ACHs when compared directly to San Francisco Bay Area ACHs. We also observed a statistically significant 2% monthly decline in community-onset CDI rates across all Orange County ACHs during the follow-up period compared with the baseline period, although the change in CO-CDI rate trend was not statistically different from the San Francisco Bay Area ACH comparator. The month-to-month decreases in HO-CDI and CO-CDI rates represented incremental progress in CDI prevention that, when taken collectively over the course of the 28-month follow-up period, had a moderate cumulative impact on lowering CDI incidence in Orange County. These findings provide evidence that the implementation of this coordinated, regional prevention initiative reduced CDI incidence in Orange County ACHs.
In this study, we did not measure which specific collaborative initiatives may have been most effective at reducing CDI incidence or if the CDI rate reductions are the result of cumulative effects. However, based on preliminary feedback, participants reported that the learning and discussion sessions were an essential aspect of the CDI collaborative. During learning and discussion sessions, results from onsite infection prevention assessments were presented in aggregate. We highlighted common CDI prevention gaps, provided education on best practices, and asked facilities to present their strategies for addressing these issues. As public health agencies, we emphasized that CDI prevention is a collective responsibility for healthcare facilities that share patients. The in-person learning and discussion sessions also helped build relationships among healthcare facility personnel and public health and fostered improved communication and coordination. Furthermore, the Orange County Health Care Agency implemented the interfacility communication initiative countywide, regardless of participation in the collaborative.
A key strength of this evaluation was the use of a controlled, interrupted time series design, which allowed us to analyze CDI rate changes in 2 ways. First, by finding the difference in CDI rate trend from respective baseline period and follow-up period rate trends, we were able to identify changes in CDI rates that could be attributed to the collaborative. Second, we approximated the counterfactual experience of participant ACHs in the HO-CDI analysis and Orange County ACHs in the CO-CDI analysis by comparing their changes in rate trends to a similar hospital cohort in the San Francisco Bay Area that did not participate in the collaborative, while controlling for variation in potential confounders. We also compared changes in HO-CDI rates of participating Orange County ACHs to nonparticipating Orange County ACHs and observed analogous results to the comparison that used San Francisco Bay Area ACHs, further demonstrating the impact of the collaborative (Supplemental Table C online). The decreased CDI transmission within participant healthcare facilities and efforts to improve communication between facilities may account for the CO-CDI rate reductions that we observed in Orange County because a portion of CO-CDI cases would have been associated with exposures in other healthcare facilities. Finally, controlled interrupted time series designs minimize the impact of time-varying confounders, which might have affected both participating and nonparticipating ACHs.Reference Lopez Bernal, Cummins and Gasparrini15
This study has limitations. Participation in the collaborative was voluntary and we do not have information regarding why healthcare facilities joined or did not join the collaborative. Rates of HO-CDI were increasing during the baseline period among participating Orange County ACHs compared with nonparticipating Orange County ACHs, and although we controlled for baseline rates in the analysis, higher CDI rates may have influenced facilities’ decision to participate and adhere to the recommendations of the collaborative. Consequently, selection bias may have affected our results. Additionally, because the contributions of all participating facilities, such as SNFs and LTAC hospitals, were not directly analyzed, we cannot generalize these findings beyond ACHs. California SNFs are not mandated to report HAI data to CDPH via NHSN, and only a subset electively report and share HAI data. Furthermore, we did not have data on changes in antimicrobial use, which could have influenced changes in CDI incidence.
Cointerventions unrelated to the collaborative may have also reduced CDI incidence in Orange County hospitals during the follow-up period. At least 1 participating Orange County ACH reported that a diagnostic stewardship intervention, not associated with the collaborative, reduced HO-CDI incidence within their hospital.Reference Quan, Yim and Merrill16 The SHIELD OC initiative, led by the University of California, Irvine, and LA BioMed at Harbor, University of California, Los Angeles, in partnership with Orange County Health Care Agency, CDPH and CDC, has enrolled 36 Orange County healthcare facilities in an intervention in which chlorhexidine is used to decolonize specific facility patient populations to prevent transmission of multidrug-resistant organisms across the Orange County healthcare network.17, 18 The intervention phase of SHIELD OC began in July 2017 and coincided with the final 6 months of the follow-up period in this analysis. There is overlap among the hospitals and skilled nursing facilities that participated in the CDI collaborative and that are participants in SHIELD OC. Although the CDI collaborative preceded the SHIELD OC intervention, the sustained reduction in CDI through December 2017 may be attributable to factors beyond the collaborative.
Similar multifacility initiatives focused on preventing CDI have been described elsewhere, but they vary in methodology and results.Reference Koll, Ruiz and Calfee19–Reference Singh, Evans, Simbartl, Kralovic and Roselle21 However, this study, in line with other multifacility and multicenter initiatives, provides evidence that HAI prevention interventions can be successfully implemented across healthcare systems and settings.Reference Warren, Cosgrove and Diekema22–Reference Ellingson, Muder and Jain24 Health departments and networks of healthcare facilities that share patients should consider coordinating similar multifacility approaches to reduce transmission and incidence of CDI and antibiotic-resistant infections in their regions. The Orange County Health Care Agency, California Department of Public Health, and Centers for Disease Control and Prevention will continue to support initiatives that prevent the occurrence of these infections in healthcare facilities. Coordination among local and regional public health partners and networks of healthcare facilities can support facility-level efforts to prevent CDI and protect patient health.
Supplementary material
To view supplementary material for this article, please visit https://doi.org/10.1017/ice.2019.135
Acknowledgments
We thank all of the healthcare facilities and their staff who participated in the Orange County CDI Collaborative. The findings and conclusions in this report are those of the authors and do not necessarily represent the official position of the Centers for Disease Control and Prevention.
Financial support
Aspects of this work were supported by Centers for Disease Control and Prevention Epidemiology and Laboratory Capacity grant funds.
Conflicts of interest
All authors report no conflicts of interest relevant to this article.