INTRODUCTION
Charcoal is produced when biomass is heated in an oxygen-poor environment (pyrolysis), and is the result of natural or human-mediated burning events. Intentional production of charcoal by humans has enabled its use as a fuel, a reductant, an adsorbent, and a soil amendment for millennia (Antal and Grønli Reference Antal and Grønli2003). These uses exploit the fact that conversion of biomass to charcoal results in a highly aromatic, carbon-rich, O/H/N/S-poor material that has high porosity and reactivity, with a large surface area. The high aromaticity of charcoal confers chemical recalcitrance, leading to the persistence of at least some charcoal in the environment for thousands, or even millions of years (Collinson et al. Reference Collinson, Featherstone, Cripps, Nichols and Scott2000; Schmidt et al. Reference Schmidt, Skjemstad and Jäger2002; Preston and Schmidt Reference Preston and Schmidt2006). However, some charcoals have been observed to degrade over much shorter timescales, with loss at the decadal scale being reported for charcoal deposited in soils (Bird et al. Reference Bird, Moyo, Veenendaal, Lloyd and Frost1999; Ascough et al. Reference Ascough, Bird, Francis, Thornton, Midwood, Scott and Apperley2011; Zimmermann et al. Reference Zimmermann, Bird, Wurster, Saiz, Goodrick, Barta, Capek, Santruckova and Smernik2012). Currently, there is considerable interest in the production of charcoal as a soil amendment (in this context known as “biochar”) as a means of mitigating climate change through long-term terrestrial sequestration of carbon (C) in refractory forms (Lehmann et al. Reference Lehmann, Gaunt and Rondon2006; Ciais et al. Reference Ciais, Sabine, Bala, Bopp, Bovkin, Canadell, Chhabra, DeFreis, Galloway, Heimann, Jones, Le Quéré, Myneni, Piao and Thornton2013; Gurwick et al. Reference Gurwick, Moore, Kelly and Elias2013).
In this study, we apply both stable isotope ratio measurements and measurement of radiocarbon by accelerator mass spectrometry (AMS) to quantify the decomposition rates of labile (i.e. indigenous) soil organic C and recalcitrant (i.e. charcoal) C in an acidic soil rich in organic matter. The use of 14C content as a tracer to detect microbial utilization of charcoal C has significant advantages. Stable carbon isotope ratio measurements of natural abundance 13C/12C (expressed as δ13C) have been used to quantify the turnover of charcoal C in soils (e.g. Major et al. Reference Major, Lehmann, Rondon and Goodale2010). These studies predominantly exploit the isotopic difference between organic matter derived from C3 and C4 photosynthetic pathways, for example, the incubation of C3 charcoal (δ13C≈−25‰) in soil containing organic matter from C4 plants (δ13C≈−12‰). However, the approach has insufficient measurement sensitivity for reliable deployment in situations where one source of carbon (e.g. charcoal) makes a much smaller contribution to the respired carbon in comparison with another source (e.g. SOM). In contrast, measurement of charcoal with a 14C content distinct from that of SOM provides an ultrasensitive means of quantifying contributions from charcoal mineralization within the short timescales of most experiments. In previous work, charcoal that is labeled, or artificially enriched, with 14C has been used to good effect (Kuzyakov et al. Reference Kuzyakov, Subbotina, Chen, Bogomolova and Xu2009, Reference Kuzyakov, Bogomolova and Glaser2014). Analyses of recent material containing bomb 14C have also provided much information on the turnover rates and mean residence times (MRTs) of individual SOM pools in undisturbed systems (Pataki et al. Reference Pataki, Ellsworth, Evans, Gonzalez-Meler, King, Leavitt, Lin, Matamala, Pendall, Siegwolf, van Kessel and Ehleringer2003). In this study, we employ an alternative approach, using charcoal prepared from material with a highly depleted 14C content relative to modern biomass (i.e. “14C dead”), which avoids the logistical issues associated with the use of enriched material in most 14C laboratories (e.g. use of dedicated lines to avoid cross-contamination). This approach has been used to study C turnover where 14C-dead CO2 from fossil fuel sources has been used to introduce a distinctive 14C-depleted signal to living plants, e.g. field-scale free-air CO2 enrichment (FACE) experiments (Leavitt et al. Reference Leavitt, Paul, Kimball, Hendrey, Mauney, Rauschkolb, Rogers, Lewin, Nagy, Pinter and Johnson1994; Staddon et al. Reference Staddon, Ramsey, Ostle, Ineson and Fitter2003), but has not to our knowledge been used to study charcoal mineralization rates. The present study therefore employs this approach to distinguish between the decomposition of indigenous SOM and charcoal, thereby resolving some of the uncertainties surrounding the rate of charcoal decomposition in soil.
MATERIAL AND METHODS
Soil and Amendments
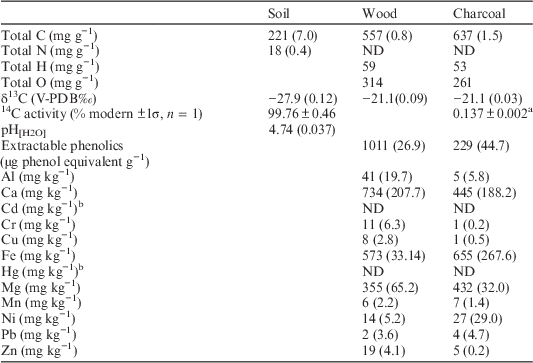
14C-dead Nothofagus spp. wood (Table 1) was obtained from the Yallourn seam of brown coal (13.6–16.3 Ma) in southeastern Australia (38.195°S, 146.360°E). Despite the great age of this wood, it retains much of its original ligno-cellulosic structure and despite some postdepositional alteration it is representative of typical woody biomass (see below). Large (up to 5 m) fragments of tree trunks, often retaining their original bark, are among the common readily identifiable macroscopic plant remains present in the Yallourn seam (Holdgate et al. Reference Holdgate, McGowran, Fromhold, Wagstaff, Gallagher, Wallace, Sluiter and Whitelaw2009). Subsamples (100 g) of dried (105°C, 24 hr), chipped (2–4 mm) wood were pyrolyzed to charcoal for 1 hr at 300°C under a stream of nitrogen (3.5 L min−1). Soil (0–10 cm depth) from the A horizon of a Typic Humaquept (Soil Survey Staff 2006) was collected from under a mixed stand of mature trees in west central Scotland (55.757°N, 4.163°W). The soil was sieved to 2 mm in the field moist state (Table 1) and stored in a sealed plastic bag at 5°C for 48 hr before use.
Selected physico-chemical characteristics of soil, wood and charcoal. Values are the means of three replicates (unless otherwise stated), 1σ standard deviation given in brackets. ND = Not detected.

a Bird and Ascough (Reference Bird and Ascough2012). Note that this value was obtained on charcoal prepared at 450°C, instead of the 300°C charcoal used in this paper. The starting material was the same for both samples, however, so differences in 14C content are not expected.
b Limits of detection are 100 µg kg−1 for cadmium and 1 mg kg−1 for mercury.
Soil Microcosms and CO2 Measurement
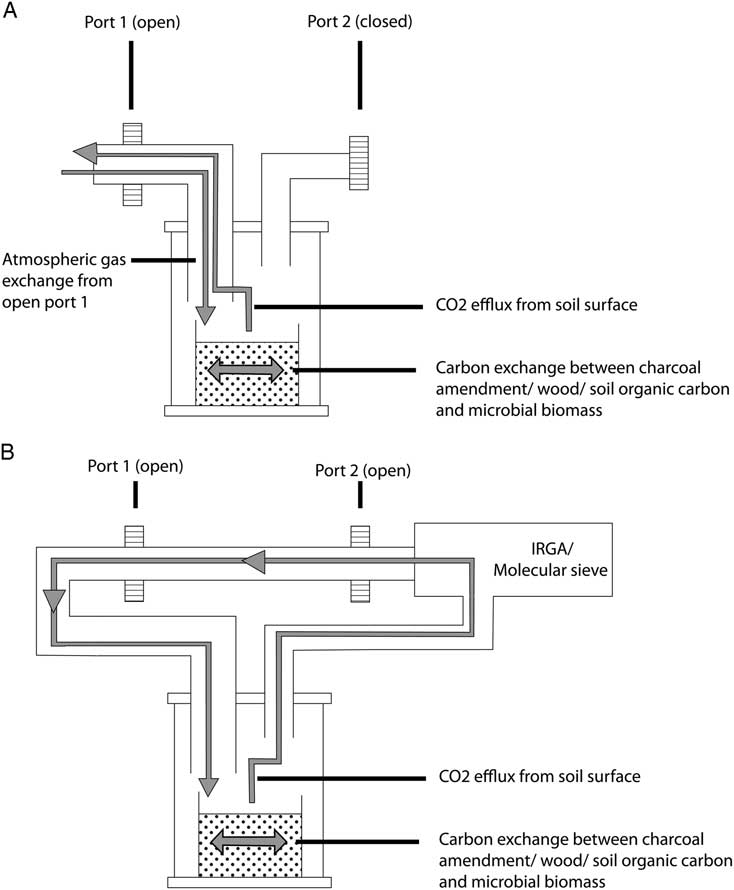
Triplicate microcosms comprising aliquots of field moist soil equivalent to 30 g dry weight were established for each treatment in gas-tight glass preserving jars (1011 mL capacity), which had been modified to accommodate two gas sampling ports (Figure 1). The moisture content of the soil was adjusted to 70% water-holding capacity and based on the different carbon contents and substrate availability, the microcosms were amended with either 3.0 g of wood chips or 1.7 g of charcoal, with unamended soil as a control sample. The mass of wood or charcoal mixed with the soil was calculated on the basis that the added carbon comprised 20% of C in the wood/soil or charcoal/soil mixture, based on a wood %C of 40% and charcoal %C of 70% (see Ascough et al. Reference Ascough, Bird, Francis, Thornton, Midwood, Scott and Apperley2011). These values are commensurate with typical standard applications of organic amendments (including biochar) to arable soil (Soffe Reference Soffe1995), and should allow for a sensitive test for charcoal CO2 emissions under representative conditions, without danger of major alteration of the soil physico-chemical properties and allied impacts on microbial activity.
Schematic of experimental apparatus showing carbon pathways during (A) incubation and (B) measurement and collection of CO2. Prior to measurement or collection of CO2, port 1 was closed for 4 days to allow buildup of the gas evolved from the soil surface.
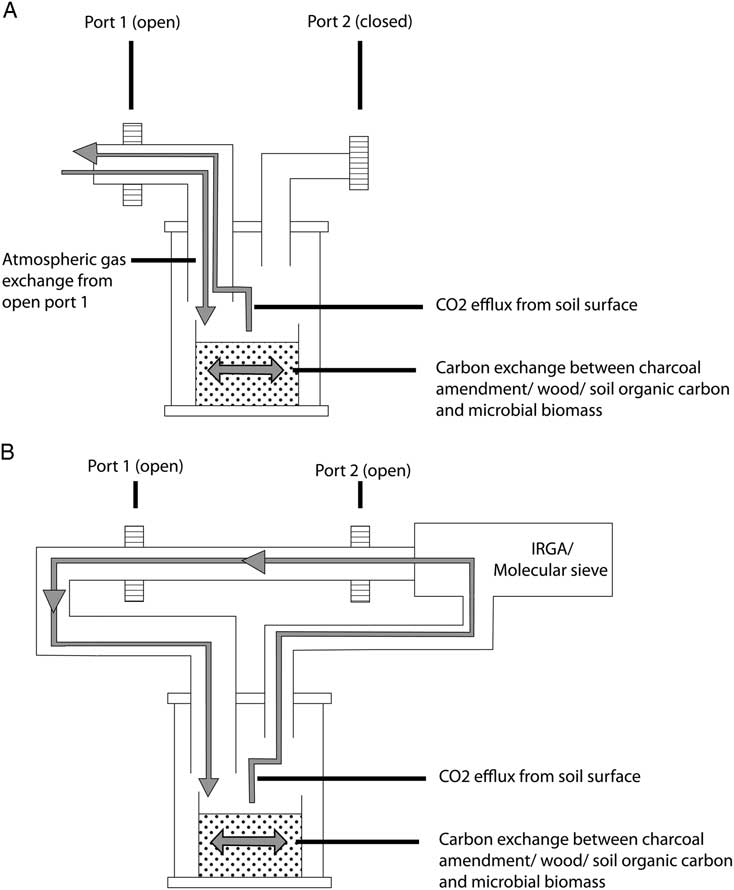
The microcosms were incubated with one sampling port open for ventilation, in the dark at 20–21°C for 55 days. Soil respiration rates were determined on a weekly basis by measuring headspace CO2 accumulation during a 4-hr period with an infrared gas analyzer (EGM-4, PP Systems, Hitchin, UK), after which the soil moisture content was checked and adjusted with additions of distilled water as required.
Elemental and Isotope Ratio Analyses
Four days prior to gas sampling, the headspace gases of each jar were pumped through a soda lime cartridge to exclude CO2 and the jars were sealed. Four days later, on days 27 and 55 of the incubation, the CO2 accumulated in headspace gases was collected from the unamended and charcoal-amended microcosms using a pump-based molecular sieve technique (Hardie et al. Reference Hardie, Garnett, Fallick, Rowland and Ostle2005). To provide sufficient sample for analysis, CO2 concentrations reached between 1.0 and 1.7%. While high CO2 concentrations can affect microbial activity, these concentrations were well within the usual range experienced by soils (1–5%; Šantrůčková and Šimek Reference Šantrůčková and Šimek1997). One aliquot of CO2 was analyzed for δ13C by isotope ratio mass spectrometry (VG Optima, Micromass, Manchester, UK) for normalization of sample 14C/13C and a second aliquot was cryogenically purified and converted to graphite for analysis using Fe/Zn reduction (Slota et al. Reference Slota, Jull, Linick and Toolin1987). Sample 14C/13C ratios were measured by AMS at the Scottish Universities Environmental Research Centre. Measured 14C/13C ratios were normalized to δ13C of –25‰ and expressed as percent modern carbon (pMC) according to Stuiver and Polach (Reference Stuiver and Polach1977). The background 14C measurement for the molecular sieve process was 0.37% modern, based upon analysis of 14C-dead 14C CO2 standards collected using the same molecular sieve sampling system (Garnett and Murray Reference Garnett and Murray2013). Although a specific incubation process background was not obtained, this was deemed unnecessary due to the fact that the respired CO2 had a modern 14C/13C ratio.
Total C and nitrogen (N) contents and δ13C values of the soil, wood, and charcoal samples described above were determined on ball-milled subsamples using a DeltaPlus XL isotope ratio mass spectrometer (IRMS, Thermo Finnigan GmbH, Bremen, Germany), linked to a Costech elemental analyzer (Milan, Italy) via a ConFlo III (Werner et al. Reference Werner, Bruch and Brand1999). Each sample sequence run included a mix of samples, laboratory standards, and blanks, with precision better than ±0.2‰ (1σ) for δ13C. The stable C isotope values (δ13C) are reported as per mil (‰) deviations from the VPDB international standard. Total O and H contents were also determined on ball-milled subsamples using a high-temperature conversion elemental analyzer (TC/EA) connected via a Conflo III to a DeltaPlus XP IRMS (all Thermo Finnigan, Bremen, Germany). Precisions for the quality control standard (benzoic acid) were as follows: total H=5.26±0.07% and total O=26.74 ±0.27% [mean ± standard deviation (SD), n=5].
13C CP-SS NMR
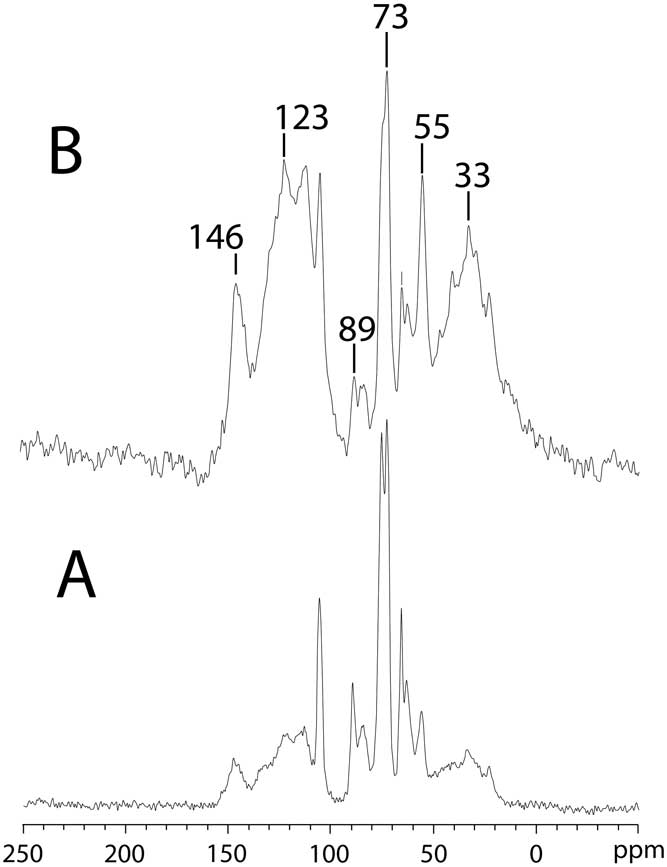
Solid-state 13C nuclear magnetic resonance spectroscopy, using cross-polarization magic angle spinning (13C-CP-SS NMR spectroscopy), was used to characterize the uncharred wood and the charcoal produced at 300°C. The 13C CP-SS NMR spectra were recorded using a 4-mm MAS probe at a 13C frequency of 100.56 MHz on a Varian VNMRS instrument. Samples were spun at 10 or 12 kHz with a CP contact time of 1 or 2 ms and a 1-s recycle time. Spectra were referenced to neat tetramethylsilane and interpreted according to the following chemical shift limits (after Wilson Reference Wilson1987): 0 to 45 ppm=methyl- and alkyl-C (indicative of aliphatic compounds including amino acids, lipids, and waxes); 45 to 60 ppm=methoxyl-C and N-alkyl-C (indicative of lignin substituents, amino acids and amino sugars); 60 to 110 ppm=O-alkyl-C, acetal- and ketal-C (indicative of monomeric and polymeric sugars); 110 to 145 ppm=aromatic-C (indicative of phenyl compounds including lignin and tannins); 145 to 160 ppm=O-aromatic-C (indicative of phenyl compounds); 160 to 190 ppm=carbonyl-C (indicative of organic acids and peptides).
Wet Chemical Analyses
Soil pH was determined on 1:2.5 w/v aqueous suspensions of soil. Colorimetric methods were used to determine the phenolic content of hot-water extracts (1:500 w/v, 100°C, 1 hr) of wood and charcoal (Box Reference Box1983), the concentrations of extractable (1:4 w/v 0.5 M K2SO4) nitrate (Cataldo et al. Reference Cataldo, Haroon, Schrader and Youngs1975), and ammonium (Anderson and Ingram Reference Anderson and Ingram1993) and to estimate the microbial biomass content after chloroform-fumigation (Amato and Ladd Reference Amato and Ladd1988). Estimates of ninhydrin-reactive microbial biomass N were converted to microbial biomass carbon using a conversion factor of 35.3, as proposed by Joergensen (Reference Joergensen1996) for soils with a pH of 5 or less. The total metal contents of the wood and charcoal were determined by inductively coupled plasma–optical emission spectroscopy (Optima 5300 DV, Perkin Elmer, Waltham, USA) after aqua-regia digestion (0.1 g sample+1.5 mL ARISTAR grade concentrated hydrochloric acid and 1.5 mL ARISTAR grade concentrated nitric acid, VWR, Lutterworth, UK).
Soil Microbiology
The size of culturable microbial populations in the presence of unextracted and hot-water-extracted wood and charcoal were determined using spread agar plates and the wood and charcoal samples used to determine the concentration of hot-water-extractable phenolics. Fifty-milligram aliquots of surface sterilized (5 min 10% commercial sodium hypochlorite, 1.5% free chlorine; rinsed two times in sterile distilled water) wood or charcoal were suspended in 100µL of sterile distilled water and applied to the surface of 10% tryptic soy agar (Sigma-Aldrich, Gillingham, UK). The plates were then inverted and allowed to dry before 100 µL of a 10−3 dilution of a 1:20 w/v soil suspension was spread over each plate. The diluent throughout was 10% tryptic soy broth. Plates were incubated at 20°C and enumerated after 7 and 14 days.
Data Handling and Statistics
Decomposition rates were modeled using the first-order negative exponential decay equation (Jenny et al. Reference Jenny, Gessel and Bingham1949) (Equation 1):
 $$C_{t} /C_{0} \,=\,C_{0} {\times}e^{{-kt}} $$
where C t is the amount of original carbon (C 0) remaining at time t, and k is the decomposition rate constant, or the slope term in the logarithmic transformation of Equation 1 (Equation 2):
 $${\rm log}_{n} \,(C_{t} /C_{0} )\,=\,{\rm log}_{n} \,C_{0} -k{\times}t$$
If the mean residence time of a given substrate is defined as being the time taken for 90% decomposition to occur, i.e. C t /C 0=10/100=0.1, or −1 after log10 transformation, then by rearranging Equation 3, the mean residence time can be estimated as the reciprocal of k (Cresser et al. Reference Cresser, Kilham and Edwards1993).
 $$k{\times}t\,=\,{\minus}\!1$$
The % contribution of 14C-depleted charcoal to respired CO2-C (CCharcoal%) was calculated by isotope mass balance using a two-component mixing model (Equation 4):
 $${\rm C}_{{{\rm Charcoal}}} \,\%\,{\rm }\,=\,{\rm }\left( {\left( {\,\%\,{\rm mod}_{{{\rm AResp}}} {\minus}{\rm }\,\%\,{\rm mod}_{{{\rm UnResp}}} } \right){\rm }/{\rm }\left( {\,\%\,{\rm mod}_{{{\rm Charcoal}}} {\minus}{\rm \,\%\,mod}_{{{\rm UnResp}}} } \right)} \right){\times}100$$
where the 14C content of CO2 emitted from unamended soil (%modUnResp) represents a 100% contribution from the SOM fraction being actively turned over by the microorganisms (cf. 14C total soil, Table 1) and the 14C content of the pure charcoal (%modCharcoal=0.137% modern; Bird and Ascough Reference Bird and Ascough2012) represents 100% charcoal-derived CO2; %modAResp is the 14C content of CO2 respired by charcoal-amended soil. The propagated standard deviation (SDCCharcoal%) of values obtained were calculated using the standard deviations of %modern values for CO2 respired by charcoal-amended soil (SDA) and unamended soil (SDU) and the dynamic range associated with each treatment based on the % modern values for respired CO2, the added charcoal, and for total soil (%modSoil=99.76% modern) according to Equation 5:
 $$\eqalignno{ {\rm SDC}_{{{\rm Charcoal}}} \,\%\,{\rm }\,=\,{\rm }\surd{\rm }\left( {{\rm SD}_{{\rm A}} /{\rm }\left( {\,\%\,{\rm mod}_{{{\rm AResp}}} {\minus}{\rm \,\%\,mod}_{{{\rm Charcoal}}} } \right)} \right)^{2} \cr{\plus}{\rm }\left( {{\rm SD}_{{\rm U}} /\left( {\,\%\,{\rm mod}_{{{\rm UnResp}}} {\minus}{\rm }\,\%\,{\rm mod}_{{{\rm Soil}}} } \right)} \right)^{2} $$
The SOM contribution to respired CO2 (SOMRespCA) in charcoal-amended soil was calculated with Equation 6 using the respired C flux from charcoal-amended soil (RespCA) on days 29 and 50 (the nearest days for which we have flux measurements) and the % contribution of 14C-depleted charcoal to respired CO2-C (CCharcoal%, from Equation 4):
 $${\rm SOM}_{{{\rm Resp}}} {\rm C}_{{\rm A}} ={\rm RespC}_{{\rm A}} {\rm -}\left( {{\rm RespC}_{{\rm A}} \,{\bullet}\,\left( {{\rm C}_{{{\rm Charcoal}}} \,\%\,{\rm }/{\rm }100} \right)} \right)$$
In Equation 4, the reduction in SOM mineralization in charcoal-amended soil was estimated as the relative mineralization intensity (RMI) using the SOM contribution to respired CO2 (SOMRespCA) in charcoal-amended soil as calculated in Equation 6 and the amount of C respired by unamended soil (RespCU):
 $${\rm RMI}=\left( {\left( {{\rm RespC}_{{\rm U}} -{\rm SOM}_{{{\rm Resp}}} {\rm C}_{{\rm A}} } \right){\rm }/{\rm RespC}_{{\rm U}} } \right){\times}100$$
All statistical analyses (two-way analysis of variance, repeated measures analysis of variance, residual maximum likelihood analysis, and the Bartlett-Box F-test) were performed using Genstat 13 (VSN International, Hemel Hempstead, UK). Significant differences between means were identified with Fisher’s least-significant difference test (P<0.050).
RESULTS AND DISCUSSION
Charcoal Chemistry
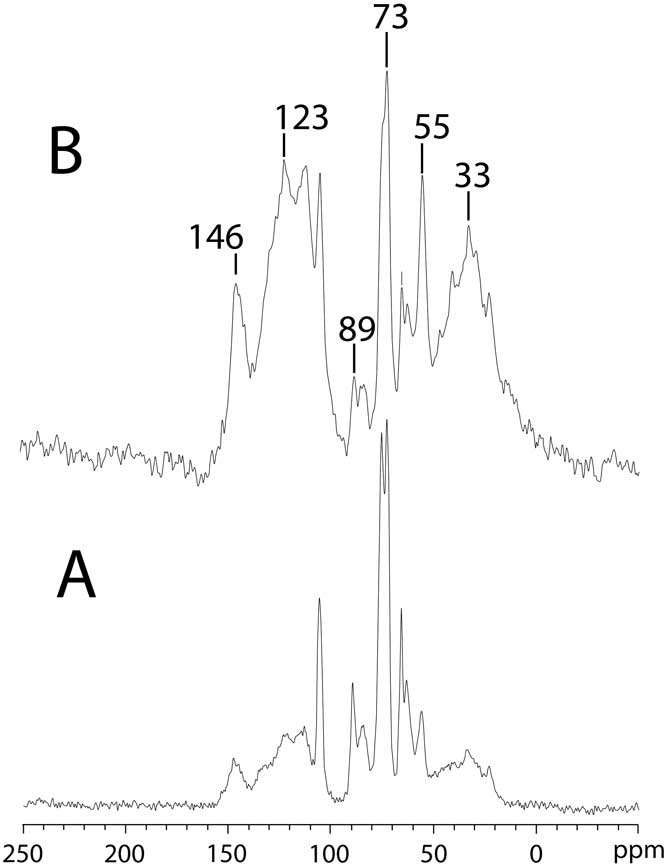
The C content of the wood (~56%, Table 1) used in this study was slightly greater than that of contemporary Nothofagus trees (~49% C) (Clinton et al. Reference Clinton, Buchanan, Wilkie, Smail and Kimberley2009), and the 13C CP-SS NMR spectrum shows some depletion of the most labile fractions (cellulose and hemicellulose) (Figure 2). The overall spectrum remains, however, similar to that of typical woody biomass (Hopkins and Chudek Reference Hopkins and Chudek1997), with distinct signals in shift ranges 20–45 ppm and 60–90 ppm, with a number of smaller peaks between 90 and 160 ppm, indicating the presence of waxes and fatty acids, hemicellulose and cellulose and carboxylic acids, plus various phenolic components (lignin). After pyrolysis the relative abundance of peaks between 60 and 90 ppm (cellulosic polymers) is reduced, but increased for peaks between 110 and 145 ppm (ligninaceous phenolics) (Figure 2). Therefore, the charcoal produced contains predominantly aromatic forms of C, but some untransformed lipids, waxes, and cellulosic polymers remain. It is also notable that as a consequence of the partially transformed chemistry of the woody starting material, the C content of the charcoal produced at 300°C for use in this study is similar to that of charcoals produced at greater temperatures e.g. 400 or 550°C for the studies of Cross and Sohi (Reference Cross and Sohi2011) and Kasozi et al. (Reference Kasozi, Zimmerman, Nkedi-Kizza and Gao2010), respectively.
Solid-state 13C CP-MAS NMR spectra of the uncharred beech wood (A) and charcoal prepared at 300°C (B). Major peaks of interest are highlighted in Figure 2B.
Soil Respiration Dynamics and 14C Measurements
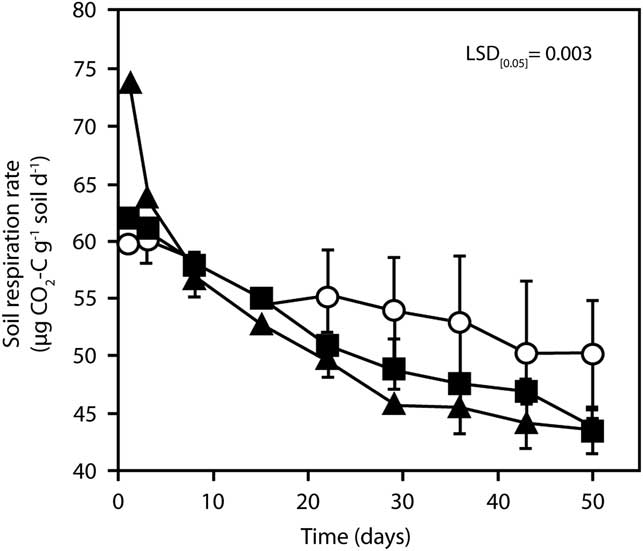
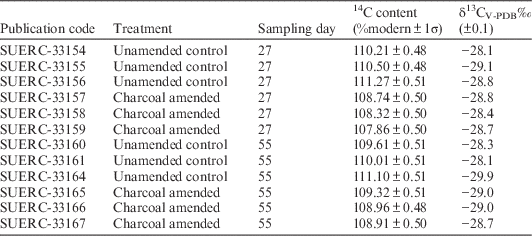
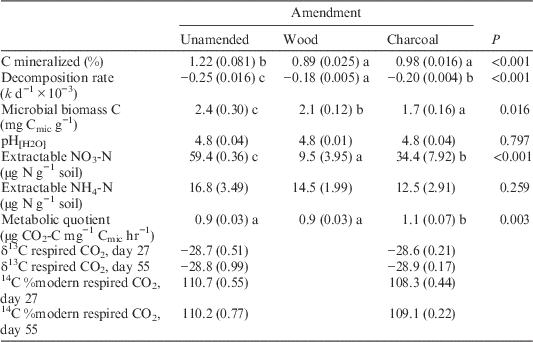
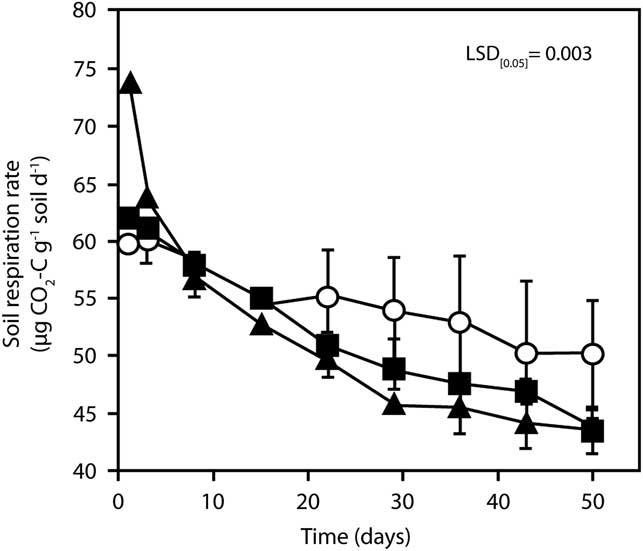
Consistent with the contrasting abundances of labile components such as hemicellulose and cellulose, as indicated by the NMR spectra, soil respiratory activity was significantly greater in the 3 days after amendment with wood than after amendment with charcoal (Figure 3). Thereafter, the respiration rates of all three treatments converged and continued to decline for the remainder of the incubation period. After day 15, the respiration rates of the treatments diverged, resulting in small (~6.5%), but statistically significant, reductions in soil respiration from day 29 onwards for wood amendment and on day 50 for charcoal amendment. The soil respiration rate typically shows a biphasic response to the addition of organic matter, whereby mineralization of the labile fraction results in the short-lived increase in respiratory activity and the longer-lived decline is attributed to decomposition of more recalcitrant components (Marstorp Reference Marstorp1997). The results of 14C measurements on samples of head-space gases accumulating above charcoal-amended and unamended control soils are given in Table 2. Over the course of the experiment, the total amount of C respired, as calculated on the basis of 14C measurements, was equivalent to 1.22% of total C present in unamended soil, with significantly less C being mineralized after amendment with either wood or charcoal (Tables 2 and 3). These differences between treatments are also reflected in similarly reduced decomposition rate constants (Table 3) and derived mean C residence times of 11.2 yr for C in unamended soil and 15.4 and 13.8 yr for C in wood- and charcoal-amended soils, respectively. The reduced amount of C mineralized from both wood- and charcoal-amended soils was also associated with about a 30% reduction in microbial biomass in charcoal-amended soil or a 9% reduction in wood-amended soil (Table 4), compared with that measured in unamended soil.
Soil respiration rates in unamended (○), wood-amended (▲), and charcoal-amended (■) soil. Values are the mean of three replicates; error bars where visible indicate 1 standard deviation. The bar indicates the least-significant difference of means at the same time point (P=0.003; df=10.51) based on a repeated measures analysis of variance.
13C and 14C content of respired CO2.

Selected physico-chemical characteristics of unamended soil and soil amended with either wood or charcoal after 55 days of incubation and the 13C and 14C contents of respired CO2. Values are the means of three replicates, with the standard deviation given in parentheses. Values within a row identified with common letters are not significantly different from each other according to Fisher’s least-significant difference test (P<0.050).

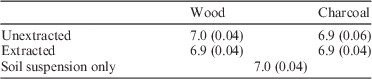
Culturable microbial population sizes (Log10 colony forming units (CFU) g–1 soil) in the presence of unextracted and hot-water-extracted wood and charcoal. Values are the mean of three replicates (except soil suspension n=6); standard errors are given in parentheses.

Assessment of Amendment Toxicities
It is unlikely that the reductions in microbial biomass and allied responses are due to the amendments being toxic, or inducing toxicity by concurrently reducing soil pH and increasing the free-ion concentration of heavy metals (Lofts et al. Reference Lofts, Spurgeon, Svendsen and Tipping2004). Not only were the concentrations of potentially toxic elements in both the wood and the charcoal (Table 1) considerably less than the threshold values proposed for biochar (International Biochar Initiative 2013), their addition had a negligible impact on soil pH (Table 3). Furthermore, in agar-plate-based microbial toxicity tests, no statistically significant (P=0.411) differences in the number of colonies of culturable microorganisms were observed between either amendment, or after removal of soluble components by hot-water extraction (Table 4).
Resource Availability Limits Microbial Respiration
Instead of amendment toxicity, we propose that the size of the microbial population declined because the availability of a key nutrient, such as nitrogen, became limiting, resulting in the death of a proportion of the microbial community (Miltner et al. Reference Miltner, Bombach, Schmidt-Brücken and Kästner2012). Extractable (available) nitrogen, as nitrate-N and ammonium-N, concentrations declined after wood and charcoal addition (Table 3). Unusually for soils recently amended with organic matter with a high C-to-N ratio, there was no concomitant increase in microbial biomass N (from which the microbial biomass C data in Table 3 are derived), attributable to the immobilization of mineral N within microbial tissues. Losses of N through conversion of mineral N to nitrous oxide are unlikely to have occurred because the soil used had been sieved to promote aeration and the moisture content was maintained below that required for the development of anaerobic conditions and denitrification (Linn and Doran Reference Linn and Doran1984). Furthermore, acidic soils often have lower denitrification potential than more neutral soils because of the indirect action of limitations such as the availability of labile C and slower rates of N mineralization (Šimek and Cooper Reference Šimek and Cooper2002; Šimek et al. Reference Šimek, Jíšová and Hopkins2002). There are, however, two physico-chemical explanations for the reductions in mineral N observed following the addition of both amendments. Not only do charcoals have considerable adsorption and cation exchange capacity for mineral N, especially NH4 + (Clough et al. Reference Clough, Condron, Kammann and Müller2013), but also the wood used was rich in extractable polyphenolics, which can form stable complexes with organic forms of nitrogen (Northup et al. Reference Northup, Yu, Dahlgren and Vogt1995), such as the amino sugars released during lysis of microbial necromass (Miltner et al. Reference Miltner, Bombach, Schmidt-Brücken and Kästner2012).
The presence of conditions that constrained microbial activities on day 50 is further indicated by consideration of metabolic quotients (qCO2), which are defined as the microbial respiration rate (measured CO2 efflux) per unit of microbial biomass (Anderson and Domsch Reference Anderson and Domsch1993). Although larger quotients are associated with the addition of more respirable substrates (Sparling 1997), they are also associated with the greater energetic requirements of cell maintenance under environmental stress conditions (Odum Reference Odum1985; Anderson and Domsch Reference Anderson and Domsch1993). The chemistry (high C-to-N ratio) of both the charcoal and wood suggests that neither were labile decomposition substrates, so it is more likely that the smaller elevation of qCO2 in charcoal-amended soil (Table 3) is due to the microbial community experiencing less favorable conditions.
Isotopic Partitioning of Respiratory C Sources
Although both the indigenous SOM and the added charcoal had distinct δ13C isotopic signatures (Table 1), this did not translate into a significant difference between the δ13C values for the C respired by unamended and charcoal-amended soils (Tables 2 and 3). However, the greater analytical sensitivity and potential dynamic range (0.137 pMC to ~100 pMC) associated with measuring the natural abundance of 14C compared with 13C (where the dynamic range is –21 to –28‰), did enable attribution of the relative contributions of SOM and charcoal to soil respiration. The abundance of 14C in respired CO2 was diminished by only ~1.75 pMC after charcoal amendment (average of both 27- and 55-day incubations, Tables 2 and 3); this indicates that SOM was the predominant source of respiratory C. Furthermore, the slight 14C enrichment relative to the contemporary atmosphere indicates that most of the respired C had been originally fixed within the last few decades. Even though the reduction in the 14C content of the CO2 emitted by charcoal-amended soil relative to unamended soil was small (Tables 2 and 3), it was nonetheless statistically significant (P<0.001) and was unaffected by sampling day (P=0.093, two-way ANOVA interaction term). The contribution of charcoal C to respired C (calculated according to Equation 4) was 2.1% (1 SD=0.05) on day 27, declining to 1.1% (1 SD=0.07) on day 55. These values are similar to those reported by Kuzyakov et al. (Reference Kuzyakov, Subbotina, Chen, Bogomolova and Xu2009) and Major et al. (Reference Major, Lehmann, Rondon and Goodale2010) following the addition of charcoals with comparable C contents to soil. Furthermore, if the C-respiration data are revised accordingly to reflect the decomposition of charcoal only, the decomposition rate constant declines to −3.03 d−1×10⁻⁶ and the corresponding mean residence time increases to 903.7 yr. These values are slightly slower than the values reported by Kuzyakov et al. (Reference Kuzyakov, Subbotina, Chen, Bogomolova and Xu2009, Reference Kuzyakov, Bogomolova and Glaser2014) for charcoal decomposing under laboratory conditions, but the ~85-fold difference from indigenous soil C is nonetheless consistent with the expected greater recalcitrance of charcoal.
The reduction in SOM mineralization (Equations 6 and 7) in charcoal-amended soil (RMI) was estimated to be 11.7% on day 27 and 14.1% on day 55. Other studies have also reported retardation of SOM decomposition after the addition of high-temperature charcoal to organic C-rich soils (e.g. Kuzyakov et al. Reference Kuzyakov, Subbotina, Chen, Bogomolova and Xu2009, Reference Kuzyakov, Bogomolova and Glaser2014; Cross and Sohi Reference Cross and Sohi2011; Zimmerman et al. Reference Zimmerman, Gao and Ahn2011). Various physico-chemical mechanisms by which the availability of both decomposition substrates and key nutrients can be reduced have been proposed to account for this response, including the sorption of mineral N (as previously discussed) and the sorption of labile SOM fractions to charcoal (Kasozi et al. Reference Kasozi, Zimmerman, Nkedi-Kizza and Gao2010). Reduced accessibility of SOM fractions, and an allied depletion of the range of respiratory substrates used by the microbial community in the presence of charcoal, is also suggested by the significantly greater homogeneity of variance (i.e. smaller standard deviations) in the δ13C signature of respired C (Table 3; P=0.026).
Positive and Negative Priming
The addition of charcoals to soil is frequently associated with so-called “priming” effects (Zimmerman et al. Reference Zimmerman, Gao and Ahn2011), which are short-term changes in the decomposition of SOM brought about by the addition of organic or mineral substances (Jenkinson et al. Reference Jenkinson, Fox and Rayner1985; Kuzyakov et al. Reference Kuzyakov, Friedel and Stahr2000). As documented by the expanding and often contradictory literature, charcoal-SOM-microbe relationships are complicated and dynamic, with a range of priming effects occurring both concurrently and sequentially. With respect to the results of our experiment, it is probable that initial decomposition of the labile fraction of the charcoal was facilitated by synchronous provision of additional labile C and N by microbial decomposition of indigenous SOM, i.e. positive priming. In the longer term, the loss of the most labile component of charcoal increased its recalcitrance to further decomposition processes. As the incubation proceeded, the effects of kinetically slower charcoal-soil interactions such as sorption of SOM and N became more influential with the result that not only was SOM mineralization repressed (Zimmerman et al. Reference Zimmerman, Gao and Ahn2011), but the amount of microbial biomass present was also reduced (Dempster et al. Reference Dempster, Gleeson, Solaiman, Jones and Murphy2012), resulting in negative priming of SOM decomposition (Blagodatskaya and Kuzyakov Reference Blagodatskaya and Kuzyakov2008). As reported by this study, negative priming typically develops in the 4 to 5 weeks after the addition of 200–500% more substrate C than that present as microbial biomass C, which was also observed in the work by Blagodatskaya and Kuzyakov (Reference Blagodatskaya and Kuzyakov2008).
The absence of other treatments such as amendment with 14C-labeled glucose to introduce an isotopic signature for microbial biomass (Blagodatskaya et al. Reference Blagodatskaya, Yuyukina, Blagodatsky and Kuzyakov2011) or additional analyses such as 14C dating of the microbial biomass (Garnett et al. Reference Garnett, Bol, Bardgett, Wanek, Bäumler and Richter2011) means that we are unable to partition the respired C between microbial biomass C and SOM C sources. Consequently, with particular reference to the wood amended soil, it is not possible to distinguish between “real” and “apparent” priming effects. During a “real” priming effect, there is additional decomposition of recalcitrant SOM as a result of co-metabolism and greater enzyme production, possibly because of activation of previously dormant microbes with substrate-specific metabolic capabilities. However, an apparent priming effect is one in which there is a change in the turnover of microbial biomass that is unrelated to change in SOM decomposition (Jenkinson et al. Reference Jenkinson, Fox and Rayner1985; Kuzyakov et al. Reference Kuzyakov, Friedel and Stahr2000). The period of maximal respiration occurring in the 1 to 3 days after the addition of the wood chips is most likely to be an apparent priming effect arising from pool substitution and related to changes in activity within the microbial community and the microbial demand for other nutrients such as N (Blagodatskaya and Kuzyakov Reference Blagodatskaya and Kuzyakov2008). In addition, further work is required to investigate the longer-term effects, such as the duration of the resource-limited conditions.
CONCLUSIONS
The approach used in this study employing 14C-dead charcoal as a tracer enabled partitioning of respired CO2-C into charcoal and indigenous SOM sources. Not only was it possible to measure the small contributions of charcoal C to respired C (<2.1%) at specific times during the incubation, but quantification of opposing concurrent effects, specifically charcoal decomposition and inhibition of indigenous SOM decomposition (by up to 14.1% on day 55), was also possible. Further work is required in order to determine the direction, persistence, and extent of these effects in the long term. The use of 14C-depleted source material for quantification of charcoal-C mineralization rates represents a viable alternative to 14C-enriched tracers. Potential sources of 14C-depleted material include controlled environment plant growth facilities with regulated atmospheres (Romer Reference Romer2001) using commercially available “industrial” 14C-dead CO2 (Topham Reference Topham1986). Overall, we recommend that our approach is most suited to fine-scale studies of functional microbial ecology at the soil-charcoal interface.
ACKNOWLEDGMENTS
Samples of 14C-depleted Nothofagus wood were kindly provided by Mr B Wood (TRUenergy, Australia). We thank David Apperley and the EPSRC NMR facility (Durham, UK) for the NMR experiments and Barry Thornton (James Hutton Institute, UK) for the elemental analyses for oxygen and hydrogen. Andrew Tait, Caroline Donnelly, and Julie Dougans provided excellent technical assistance at SUERC, as did Lorna English at the University of Stirling. The cooperation of Gillian MacKinnon (SUERC) and Philip Wookey (University of Stirling) for access to laboratory facilities is also gratefully acknowledged. Support for 14C measurements within this study was provided through the NERC Radiocarbon Facility NRCF010001 (alloc. 1510.1010). Overall financial support was provided by NERC (NE/F017456/1).